Data Representation, Experiments, Outcomes, Events, Discrete Probability,
Probability Rules, Conditional Probability
Counting, Random Variables (Discrete and Continuous), Mean and Variance of
Probability Distribution
Data: Representation, Avarage, Spread(平均、広がり)
89 84
87
81
89
86
91
90
83
84
86 87
78 89
87
99
83
89 Age of 14 people
87
89
89
89
90
Sort these data. (ソート)
78 81
89
91
99
Stem-and-leaf prot(幹葉表示)
1
4
7
8
8
134
11
13
14
8
9
9
6779999
01
9
Stem-and-leaf plot of the data
Absolute frequency(絶対度数)
Cumulative absolute frequency (累積絶対度数)
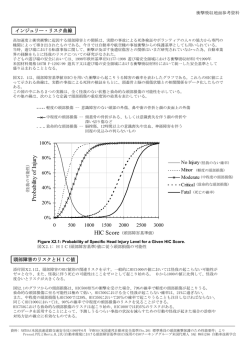
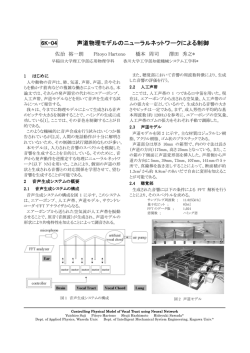
Histogram(棒グラフ)
0.60
0.50
0.40
0.30
0.20
0.10
0.00
77
82
87
92
97
図 1: Histgram of the data
Center and Spread of Data: Median, Quartiles(データの中心と広がり:中位数、四分値)
Median(中位数)
The seventh data is 87, the eighth is 89. So, the median is 88
1
Range(範囲) : R = xmax − xmin
Interquartile range(四分値範囲): IQR = qU − qL
Upper quartile(上位四分位): qU
Lower quartile(下位四分位): qL
qU = 89, qL = 84, IQR = 89 − 84 = 5
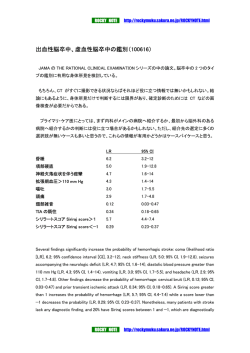
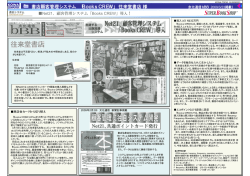
Boxplot(箱ヒゲ図)
Non symmetric data : 78 81 83
More symmetric data : 91 89 93
84
91
100
86
87
x max =99
87
94
87
92
89
85
89
91
89
90
89
96
90
93
91
89
99
99
x max = 96
95
q U = 93
90
qU
85
qL = 84 x min = 85
80
qL = 89
x min =78
75
図 2: Boxplots
Outliers(外れ値)
An outlier is a value that appears to be uniquely different from the rest of the data set.
(外れ値とはデータの大部分が含まれるデータ値の区間から, かけ離れたところに位置するデータ
のことである)
Frequency (度数), Relative Frequency (相対度数), and Cumulative Frequency (累
積度数) Twenty five students are asked how many hours they study per day. The responses
are as follows:
5; 6; 3; 3; 2; 6; 4; 7; 5; 2; 3; 5; 3; 6; 5; 4; 5; 2; 4; 3; 5; 2; 4; 5; 3;
Data
Value
Frequency
Frequency
Relative
Frequency
Cumulative
Frequency
2
4
4/25=0.16
0.16
3
6
6/25=0.24
0.16+0.24
4
4
5
7
6
3
7
1
Frequency Table for students’ work hour per day
A Frequency is the number of times a given data occurs in a data set. For example, here 6
students (度数) work for 3 hours per day.
A Relative Frequency is the fraction of times a data occurs. To get it, just divide the
frequency with the total number of students.
Cumulative relative frequency is the accumulation of the previous relative frequencies.
2
Mean. Standard Deviation. Variance(平均、標準偏差、分散)
Remember that Population is a fixed set of examples, and Sample is a small set of examples
available/selected/used from a much larger set. Average/Mean (平均):
1
1∑
xj = (x1 + x2 + · · · + xn )
n j=1
n
n
x̄ =
Standard deviation(標準偏差) σ (or s) and its square, varience (分散)
Population Variance is defined as:
]
1∑
1[
(x1 − x̄)2 + · · · + (xn − x̄)2
(xj − x̄)2 =
n j=1
n
n
σ2 =
However, if we have only a small set of samples out of a large
∑ one, we do not know the true
xi
average µ. We estimate the average from the samples, i.e., n = a. But a differs from the
actual average of the whole set, i.e., µ, though the average of all as is µ (from Central limit
theorem). It can be shown that the estimated variance using a will be smaller, and the correct
Sample variance will be
]
1 ∑
1 [
(xj − x̄)2 =
(x1 − x̄)2 + · · · + (xn − x̄)2
n − 1 j=1
n−1
n
s2 =
Problem
Represent the following data by a stem-and-leaf plot, a histogram, and a boxplot.
(次のデータを、幹葉表示、棒グラフ、箱ひげ図のそれぞれを使って示せ)
1. 12 11 9 5 12 6 7 9 11 11
2. 17 18 17 16 17 16 18 16
3. 46 48 44 23 31 20 34 27 41 36 46 28 28 39 29
4. 50.6 50.9 49.1 51.3 50.5 49.7 51.5 49.8 51.1 48.9 50.3 49.2 51.2 50.4 52.8
Find the mean and compare it with the median. Find the standard deviation and compare it
with interquartile range, for the data in Prob. 1, Prob. 2, and Prob. 4.
( Prob. 1, Prob. 2, and Prob. 4 において、平均、中位数、標準偏差、四分値範囲をそれぞれ示せ)
Experiments, Outcomes, Events(実験、結果、事象)
Probability theory(確率論)
An experiment(実験) is a prosess of measurement or observation, in a laboratory, in a factory,
on the street, in nature, or wherever; so ”experiment” is used in rather general sense.
A trial(試験) is a single performance of an experoment. Its result is called an outcome or a
sample point. n trials then give a sample of size n consisting of n sample points. The sample
space S of an experiment is the set of all possible outcomes.
Example:
(1) Inspecting a lightbulb. S ={ Defective, Nondefective}
(2) Counting daily trafiic accidents in NewYork. S the integers in some interval
(3) Rolling a die. S={ 1,2,3,4,5,6 }
Events
A={ 1, 3, 5 }(”Odd number”), B= { 2, 4, 6 }(”Even nunber”)
3
Unions, Intersections, Complements of Events(和集合、共通部分、補集合)
Union A ∪ B of A and B.
Intersection A ∩ B of A and B.
A ∩ B = ϕ, A and B mutually exclusive(互いに素,disjoint)
Complement(補集合)AC of A. S not in A
A ∩ AC = ϕ, A ∪ AC = S
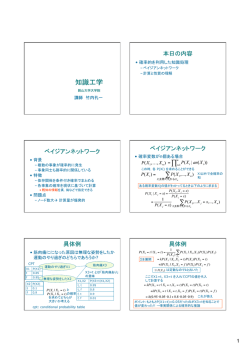
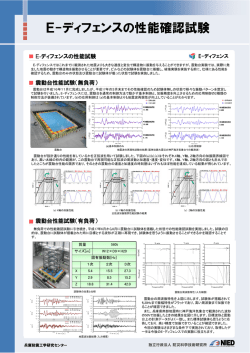
Venn diagram (ベン図)
3
1
5
6
A
2
C
4
S
図 3: ven diagram
For the experoment of rolling a die, showing S,
A = {1, 3, 5}, C = {5 6}, A ∪ C = {1, 3, 5, 6}, A ∩ C = {5}
Problem
Write down the sample space for the following experiments
(次に示す実験の標本空間を示せ)
1. Rolling two dice
(2 つのさいころを振る)
2. Tossing two coins
(2 つのコインを投げあげる (コイントスをする))
3. Rolling a die until the first 6 appears
(6 が出るまでさいころを振る)
4. Drawing bolts from a lot of 10, containing 1 defective D, until D is drawn, assuming
sampling both with and without replacement.
(欠陥品 D を 1 個だけ含む 10 個のボルトから D が出るまでボルトを取り出す。このとき、取り出
した D 以外のボルトを戻す、戻さない、ときの標本をそれぞれ示せ)
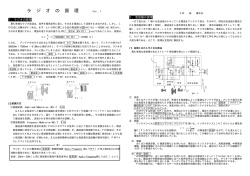
5. In connection with a trip to Europe by some students, consider the events P that they see
Paris, G that they have a good time, and M that they run out of money, and describe in words
the events 1, · · · 7 in the diagram. (学生たちが共同でヨーロッパを旅行する。事象 P(パリを訪れ
る), G(有意義な時間を過ごす), M(所持金を使い切る), が起こるとき、以下の図の 1 · · · 7 の事
象を文章で示せ)
4
G
3
4
2
7
5
6
M
1
P
図 4: problem 5
Probability(確率)
The probability P (A) of an event A is
P (A) =
N umber of points in A
N umber of points in S
P (S) = 1
Example:
In rolling a fair die, what is the probability P (A) of A of obtaining at least a 5? The
probability of B: ”even number”?
(サイコロが少なくとも 5 以上の目が出る事象 A の起こる確率、及び偶数になる事象 B の起こる
確率は?)
Probability as the counterpart of relative frequency
frel (A) =
f (A)
N umber of times A occurs
=
n
N umber of trials
For mutually exclusive events A and B (A ∩ B = ϕ),
P (A ∪ B) = P (A) + P (B)
Complementation rule (余事象の確率): For an event A and its complemente AC in a sample
space S
P (AC ) = 1 − P (A)
Example
Five coins are tossed simultaneously. Find the probability of the event A: At least one head
turns up. Assume that the coins are fair.
(5 つの硬貨を同時に投げるとき、次の事象 A が起こる確率を求めよ A:少なくとも一つが表に
なる)
Example: Mutually exclusive events(排反事象)
If the probability that on any workday a garage will get 10-20, 21-30, 31-40, over40 cars to
service is 0.20, 0.35, 0.25, 0.12, respectivery, what is the probability that on a given workday
the garage gets at least 21 cars to service?
平日に駐車所に車の入る台数が 10-20,21-30,31-40,41 以上, の時の確率がそれぞれ
0.20,0.35,0.25,0.12, のとき、平日に少なくとも車が 21 台以上駐車場に入る確率は?
5
Addition rule for arbitrary events(任意の事象の加法定理)
For events A and B in a sample space,
P (A ∪ B) = P (A) + P (B) − P (A ∩ B)
Example: Union of arbitrary events
In tossing a fair die, what is the probability of getting an odd number or a number less than 4?
(一つのサイコロを投げるとき、サイコロの目が奇数または 4 未満になる確率は?)
Conditional Probability. Independent Events (条件付き確率、独立事象)
Conditional probability of B given A:
P (B|A) =
P (A ∩ B)
P (A)
Conditonal probability of A given B is
P (A|B) =
P (A ∩ B)
P (B)
Multiplication rule :
In producing screws, let A mean ”screw too slim ” and B ”screw too short.” Let P (A) = 0.1
and let the conditional probability that a slim screw is also short be P (B|A) = 0.2. What is
the probability that a screw that we pick randomly from the lot produced will be both too slim
and too short?
Independent events(独立事象)
P (A ∩ B) = P (A)P (B)
1. sampling with replacement
2. sampling without replacement
Sampling with and without replacement:
A box contains 10 screws, three of which are defective. Two screws are drawn at random. Find
the probability that none of the two screws is defective.
Problem
1. In rolling two fair dice, what is the probability of obtaining a sum greater than 3 but not
exceeding 6?
(2 つのサイコロを投げるとき、その和が 3 より大きく 6 以下の確率は?)
2. In Prob. 1, what is the probability of obtaining a sum not exceeding 10?
(1 において、その和が 10 以下の確率は?)
3. If a box contains 10 left-handed and 20 right-handed screws, what is the probability of
obtaining at least one right-handed screw in drawing 2 screws with replacement?
(箱の中にそれぞれ左巻きねじが 10 本、右巻きのねじが 20 本あり、そこから 1 本ねじを取ってそ
れをもどし、2 本目を取る。このとき少なくとも 1 本が右巻きのねじである確率を求めよ)
4. Under what conditions will it make practically no difference whether we sample with or
without replacement?
どんな条件のもとであれば、元に戻すか戻さないかという条件を考える必要が無くなりますか?)
5. If a certain kind of tire has a life exceeding 30000 miles with probability 0.90, what is the
probability that a set of these tires on a car will last longer than 30000 miles?
6
(一つのタイヤの寿命が 30000 マイル以上である確率が 0.9 である時に、ある車の 3 つのタイヤが
30000 マイル以上保つ確率は?)
Permutations and Combinations(順列と組み合わせ)
Permutations:
(a) Different things :
n! = 1 · 2 · 3 · · · n
(b)Classes of equal things :
n!
n1 !n2 ! · · · nc !
(n1 + n2 + · · · + nc = n)
Example
If a box contains 6 red and 4 blue balls, the probability of drawing first the red and then blue
balls? (箱の中に 6 つの赤いボールと 4 つの青いボールがありそこから順番に 2 個ボールを取り出
すときに、最初が赤で、次が青である確率は?)
Permutations(2)
The number of different permutations of n different things, k at a time, without repetitions, is
n(n − 1)(n − 2) · · · (n − k + 1) =
n!
(n − k)!
Example
In a coded telegram the letters are arranged in groups of five letters, called words. What is the
number of different such words? (コード化された電報では文章はワードと呼ばれる 5 つの文字列
に分割される。それらのワードの種類は何通りになるか?)
Combinations:
The number of different combinations of n different things, k at a time, without repetitions is
(
)
n
n!
n(n − 1) · · · (n − k + 1)
=
=
k!(n − k)!
1 · 2···k
k
With repetitions:
(
n+k−1
)
k
Stirling fomula for n!(スターリングの公式)
( n )n
√
n! ∼ 2πn
e
(e = 2.718 · · ·)
Problem
1. List all permutations of four digits 1, 2, 3, 4, taken all at a time.
(1,2,3,4 の数字で作ることの出来る 4 桁の順列を全て示せ)
2. How many different samples of 4 objects can be drawn from a lot of 50 objects?
(50 個の対象から 4 つの違うサンプルを引く組み合わせは何通りか)
3. In how many ways can we choose a committee of 3 from 8 persons?
(8 人から 3 つの委員会を作るとき、何通りの組み合わせが存在しますか?) 4. How many different
license plates showing 6 symbols, namely, 3 letters follower by 3 digits could be made? (前半部
分が 3 つの数字、後半部分が 3 つの文字の計 6 つの記号で表される許可証を何通り作ることが出
来ますか)
7
Discrete random variable and distribution (離散確率変数と分布): count
Continuous random variable and distribution (連続確率変数と分布): measure
Distribution function(確率分布): For Dice rolling
f(x)
F (x) = P (X ≤ x);
1
6
1
2
3
4
5
6 x
1
2
3
4
5
6
F(x)
1
1
2
x
Discrete Random Variables and Distribution
Random variable X, its distribution is discrete(離散値)(x1 , x2 , · · ·)
Possible values and their probability X : p1 = P (X = x1 ), p2 = P (X = x2 ), · · ·
Continuous Random Variable and Distribution
Discrete random variables appear in experiments in which we count
Continuous random variables appear in experiments in which we measure
Random variable X and F (X):
∫
x
F (X) =
f (v)dv
−∞
∫
b
P (a < X ≤ b) = F (b) − F (a) =
f (v)dv
a
Curve of
density
function
P (a < X <= b)
f(x)
a
∫
b
∞
f (v)dv = 1
−∞
8
Problem
1. Sketch the probability function f (x) = x2 /14 (x = 1, 2, 3) and the distribution function
(確率関数 f (x) = x2 /14 (x = 1, 2, 3) と確率分布を図示せよ)
2. Sketch f and F when f (0) = f (3) = 1/6, f (1) = f (2) = 1/3 . Canf have further positive
values ?
(f (0) = f (3) = 1/6, f (1) = f (2) = 1/3 のときの f と F を図示せよ。またその時 f は正の値を取
れるか?)
3. If X has the probability function f (x) = k/x! (x = 0, 1, 2 · · ·) , what are k and P (X ≥ 3) ?
(X が確率関数 f (x) = k/x! (x = 0, 1, 2 · · ·) をもつときの k と P (X ≥ 3) を求めよ)
Mean and Variance of a Distribution
Mean(平均):
∫
∞
µ=
x f (x)dx
−∞
Variance(分散):
∫
σ2 =
∞
−∞
(x − µ)2 f (x)dx
Standard deviation(標準偏差): σ
Uniform distribution(一様分布):
∫
b
σ2 =
a
(
)2
a+b
1
(b − a)2
x−
dx =
2
(b − a)
12
9
© Copyright 2026 Paperzz