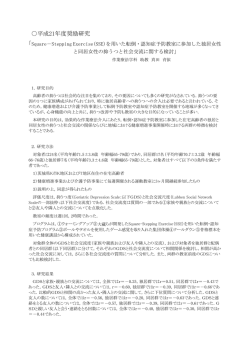
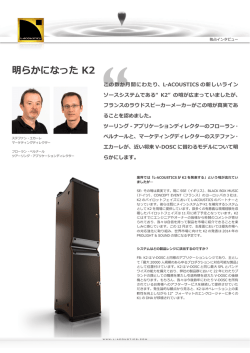
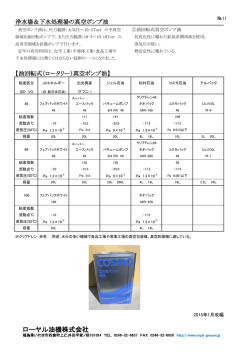
9-2 短期的スロースリップイベント自動モニタシステムによる準リアルタイム検出
Quasi real-time monitoring system of short-term slow slip events
防災科学技術研究所
National Research Institute for Earth Science and Disaster Prevention
防災科学技術研究所では,Hi-net 併設の高感度加速度計(傾斜計)記録を用いた短期的スロース
リップイベント(SSE)の自動検出手法 1)をもとに,準リアルタイムでの短期的 SSE 自動モニタ
システムを構築し,2011 年 2 月より四国全域を対象に運用を開始している.このシステムにより,
2011 年 5 月に四国西部で発生した短期的 SSE2)を初めて自動検出することが出来た(第 1,2 図).
検出と同時に推定された SSE の規模は Mw 5.8 であり,5 月 21-22 日の 2 日間をイベント期間と
して同定した.推定されたすべり域は同期して発生した微動活動 5)とよく対応しており(第 3 図),
規模・期間・すべり域のいずれも手動解析結果 2)とよく一致している.
また,検出された SSE の期間と微動活動の発生期間を詳細に比較すると,SSE の発生前(5 月
19-20 日)に比較的小規模な微動活動が先行し,SSE の発生とともに微動活動が活発化している(第 2,
3 図).この様な微動活動と SSE の開始時期の差は,この地域で発生した他の SSE についても見ら
れる特徴である 1).
なお,自動検出手法は下記の 3 つのステップからなり,これを毎日実行している.詳細について
は参考文献 1)を参照されたい.
Step 1: 最新 30 日間の傾斜データを用いて,短期的 SSE の最適モデルを推定する.モデルパラメー
タのうち,断層位置(フィリピン海プレート上面に固定)・開始時・継続時間についてはグリッド
サーチを行い,すべり量・各傾斜データの背景リニアトレンド成分については Network Inversion
Filter6)を用いて推定する.なお,断層サイズは 30 km × 30 km で固定し,すべり量は断層面上で
一様,すべり速度はイベント期間中一定と仮定する.
Step 2: Step 1 で推定した SSE を含む最適モデルと SSE の応答を含まないモデルを Akaike
Information Criterion(AIC)で比較する.SSE を含むモデルの方が良ければ Step 3 へ進む.
Step 3: Step 2 で得られた解のロバスト性テストを行う.ある 1 観測点の傾斜データを除外して
Step 1,2 を再実行する.これを全観測点で行い,全てのケースで Step 2 をクリアできれば,SSE
として検出する.
謝辞
気象庁のホームページで公開されている気象台等の気象観測データを使用させていただきまし
た.記して感謝いたします.
( 木村武志 )
Takeshi Kimura
- 539 -
参 考 文 献
1)Kimura, T., K. Obara, H. Kimura, and H. Hirose, Automated detection of slow slip events
within the Nankai subduction zone, Geophys. Res. Lett., 38, L01311, doi:10.1029/2010GL045899,
2011.
2)木村武志・廣瀬仁 , 西南日本における短期的スロースリップイベント(2010 年 11 月〜 2011 年
5 月),本連絡会報 , 2011.
3)Shiomi, K., M. Matsubara, Y. Ito, and K. Obara, Simple relationship between seismic activity
along Philippine Sea slab and geometry of oceanic Moho beneath southwest Japan, Geophys. J.
Int., 173, 1018-1029, doi: 10.1111/j.1365-246X.2008.03786.x.
4)Tamura, Y., T. Sato, M. Ooe, M. Ishiguro, A procedure for tidal analysis with a Bayesian
information criterion, Geophys. J. Int., 104, 507-516, 1991.
5)松澤孝紀ほか , 西南日本における深部低周波微動活動 (2010 年 11 月—2011 年 5 月 ), 本連絡会報 ,
2011.
6)Segall, P., and M. Matthews, Time dependent inversion of geodetic data, J. Geophys. Res., 102,
22,391-22,409, doi: 10.1029/97JB01795.
- 540 -
第11
図 (左上)自動モニタシステムで使用している
Hi-net 観測点(黒三角)と短期
的 SSE の断層モデルの候補(赤四角).コンターはフィリピン海スラブモホ
面の等深度線 3) を示す.(その他)各解析期間において,Step 2 で見積もら
れた AIC の差の分布(SSE を含むモデルの方が含まないモデルよりも良け
れば負).SSE として検出された断層位置を矢印で示す.
Fig. 1 (upper left) Distribution of Hi-net tiltmeter stations used for SSE detection
(triangles) and candidate fault models (red rectangles). Solid lines are
isodepth contours of the Moho of the Philippine Sea Plate3). (the others)
Distribution of differences of AIC between models with and without the
SSE calculated in Step 2. Arrows show the position of the detected SSE.
2 3 第 3 図 検出された短期的 SSE と微動活動のスナップショット.青丸が微動の震央,
SSE 断層面の色はモーメント解放レートを示す.
Fig. 3 Snapshots of the moment release rate of the SSE and epicenters of tremor
(blue circles). Rectangles show the estimated SSE fault which are colored
according to the moment release rate when it occurs. Solid lines are
isodepth contours of the Moho of the subducting Philippine Sea plate3).
- 541 -
第 2 図 2011 年 4 月 25 日から 5 月 24 日までの四国西部における観測傾斜時系列(赤・
青線)と推定された SSE モデルによる理論傾斜時系列(灰線).観測点位置
は第 1 図に示した.記録は上方向への変化が北・東下がりの傾斜変化を表す.
BAYTAP-G4) により気圧応答・潮汐成分を除去し,さらに推定された各観
測点・成分の直線リニアトレンドを補正した記録を示している.点線で示し
た期間が推定された SSE の期間である.同地域での微動活動度,宇和島で
の気圧変化および雨量をあわせて表示した.
Fig. 2 Comparison between observed tilt data (red and blue lines) and synthetic
response to the estimated SSE model (gray lines) from April 25 to May
24, 2011.‘N’and‘E’that follow a four-character station code denote
the northward and eastward ground down tilt components, respectively.
The displayed tilt records are ones which were detided and atmospheric
pressure-corrected with BAYTAP-G4) and were detrended. Vertical
dashed lines show the estimated time period of SSE. The daily number of
tremor within 50 km from the estimated fault, atmospheric pressure and
precipitation at the JMA Uwajima meteorological observatory are also
shown.
© Copyright 2026 Paperzz