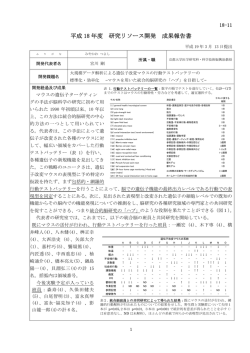
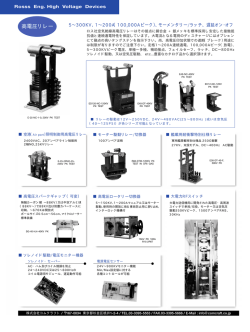
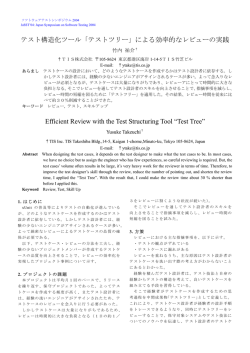
INVESTORS GUIDE
Year Ended of March 31, 2015
2015年3月期
Business Segments
事業セグメント
1
Market Data
市場データ
3
Consolidated Financial Results, Geographic Sales,
Number of Employees
連結経営成績、地域別売上高、従業員数
Operating Results by Business Segment
事業別セグメントの状況
Profitability, R&D Expenses, Capital Expenditures,
Depreciation and Amortization
収益性、研究開発費、設備投資額、減価償却費
Financial Position, Cash Flow Condition
連結財政状態、連結キャッシュ・フローの状況
Share Information
株式情報
© Copyright 2015 ADVANTEST CORPORATION
4
5
6
7
8
Business Segments | 事業セグメント
Semiconductor and Component Test System 半導体・部品テストシステム事業
Semiconductor test systems, known as Automatic Test Equipment (ATE), are essential to quality
assurance. Advantest is a pioneer in this field and a world leader in test technology. Our diverse,
high-productivity solutions provide unmatched support for suppliers of various devices, ranging
from logic ICs to the memory chips used in computers, servers, game consoles, smartphones and
vehicles.
Non-Memory Test System 非メモリ半導体用テストシステム
半導体試験装置(ATE)は、半導体デバイスが正しく動作するか、良否判定を⾏うための装置です。業界随⼀の技術⼒により、
世界トップクラスの市場シェアを占める当社の主⼒事業です。スマートフォン、パソコン、ゲーム機、⾃動⾞などに使われるロジックICや
メモリICなどのさまざまな半導体の試験ニーズを、多彩なソリューションと高い生産性で支えます。
Memory Test System メモリ半導体用テストシステム
V93000
T2000
T6391
T5503HS
T5833
T5831
SoC Test System
SoCテスト・システム
SoC Test System
SoCテスト・システム
Display Driver Test System
ディスプレイ・ドライバ・テスト・システム
Memory Test System
メモリ・テスト・システム
Memory Test System
メモリ・テスト・システム
Memory Test System
メモリ・テスト・システム
Mechatronics System メカトロニクス関連事業
Test Handlers テスト・ハンドラ
Test handlers transfer packaged semiconductors in large batches to a
test system, then grade them, identifying faulty devices. Featuring highthroughput thermal control and highly accurate placement technology,
Advantest’s test handlers support the manufacturing of leading-edge
semiconductor devices.
テスト・ハンドラは、パッケージされた半導体を多数個同時に半導体試
験装置に搬送し、判定結果に従って分別する装置です。当社の高
速・高精度な温度コントロール技術と位置決め技術が、最先端半導
体デバイスの量産を支えています。
M4871
M6245
SoC Test Handler
SoCテスト・ハンドラ
Memory Test Handler
メモリ・テスト・ハンドラ
Device Interfaces デバイス・インタフェース
DI products are electrical and mechanical units that connect semiconductor devices to test systems. They include probe cards, load boards,
HIFIX, and change kits. Advantest’s high-quality data transfer technology,
and our worldwide network of design and production facilities, enable
our DI products to contribute significantly to reducing customers’ timeto-market.
デバイス・インタフェースは、半導体デバイスを半導体試験装置に接続
する際に必要となる、プローブ・カード、HIFIX、チェンジ・キットなどの周
辺ユニットの総称です。世界を網羅する設計・生産ネットワークと電気
信号を高品質に伝送する技術で、お客様の設計・製造リードタイム短
縮に貢献します。
Change Kit
チェンジ・キット
1
© Copyright 2015 ADVANTEST CORPORATION
HIFIX
Probe Card
プローブ・カード
Business Segments | 事業セグメント
Nanotechnology ナノテクノロジー
Advantest offers two families of nanotechnology products that contribute to cutting-edge semiconductor manufacturing and process development, utilizing the electron beam (EB) control technologies we have amassed through our R&D activities. Our EB lithography systems write 1x nanometer
node circuit patterns onto semiconductor wafers and other substrates, while our metrology/review
systems enable real-time measurement and defect review of pattern width, height, and side wall
angles.
F7000
EB Lithography System
電⼦ビーム露光装置
アドバンテストが培ってきた電子ビーム(EB)制御技術を応用した、最先端の半導体製造・プロセス開発に貢献する製品です。半
導体ウエハなどに微細な回路パターンを描画するEB露光装置と、フォトマスクや半導体ウエハに描画された回路パターンの幅、高さ、
側壁角度をリアルタイム3次元計測/⽋陥レビューできる測⻑SEM(走査型電子顕微鏡)などのEB計測装置を提供しています。
E3640
E5610
E3310
MASK MVM-SEM®
MASK DR-SEM
WAFER MVM-SEM®
Services, Support and Others サービス他
Advantest provides diverse customer-support solutions, including semiconductor test equipment
installation and maintenance, and applications to improve the productivity of installed test systems.
Additionally, we continue to develop groundbreaking products such as SSD protocol testers, terahertz spectroscopic / imaging systems, on-demand testing systems, and mobile handset system test
solutions, targeting diverse new markets. Earnings from these new businesses are also included in this
segment.
半導体試験装置の設置・メンテナンスサービスや、設置済みの試験装置の生産性を改善するアプリケーションの提供など、お客様を
サポートするさまざまなソリューションをお届けしています。
また、SSDプロトコル・テスタ、テラヘルツ分光・イメージング解析システム、オンデマンド型テスト・ソリューション、モバイル機器のシステ
ム・レベル・テストソリューションなど、半導体デバイス以外の市場を対象とする新たな事業の育成にも挑戦しています。
MPT3000
TAS7500
CX1000P
SSD Test System
SSDプロトコル・テスタ
Terahertz Spectroscopic Imaging System
テラヘルツ分光・イメージング解析装置
CloudTestingTM Station
クラウドテスティング・ステーション
Test Cells テスト・セル
Test Handler
テスト・ハンドラ
Advantest uniquely manufactures and provides customers with complete semiconductor test
cell solutions encompassing test systems, test handlers, and device interfaces. These “test cells”
significantly boost device quality and production efficiency, and have been widely adopted by
customers.
Device Interface
デバイス・インタフェース
アドバンテストは、「テスト・システム」「テスト・ハンドラ」「デバイス・インタフェース」の全てを1社で供給することができます。これら
を統合した「テスト・セル・ソリューション」は、業界最高レベルのテスト品質およびテスト効率が評価され、多くのお客様に導⼊
されています。
Test System(Test Head)
テスト・システム (テスト・ヘッド)
© Copyright 2015 ADVANTEST CORPORATION
Test System (Mainframe)
テスト・システム (メインフレーム)
2
Market Data | 市場データ
Semiconductor Market by Category in 2014
Worldwide IC Manufacturing Equipment Sales Top 10
Breakdown of IC Automated Test Equipment Market in 2014
2014年半導体品種別売上高
世界半導体製造装置メーカー売上上位10社
2014年の半導体試験装置市場
(US$ million, CY 百万米ドル、暦年)
(US$ billion 十億米ドル)
COMPANY
Discrete
MOS Memory
ディスクリート
Optoelectronics
メモリ
28
オプトエレクトロニクス
80
32
ANALOG
アナログ
44
MOS Logic
163
ロジック
(US$ million 百万米ドル)
2014
Applied Materials
7,944
ASML
7,550
Tokyo Electron 東京エレクトロン
5,540
Lam Research
4,861
KLA-Tencor
2,868
SCREEN Holdings SCREENホールディングス
1,522
Advantest アドバンテスト
1,440
Teradyne
1,301
Hitachi High-Technologies ⽇⽴ハイテクノロジーズ
1,187
Nikon Corporation ニコン
Others
SOC Test Systems
その他
SOCテスタ
369
Memory IC Test Systems
391
メモリテスタ
1,896
887
Source: VLSI Research, 2015
Source: VLSI Research, 2015
Source: VLSI Research, 2015
Trend of Worldwide Semiconductor Market
Trend of IC and Related Equipment Market
Trend of IC Automated Test Equipment Market
半導体市場の推移
半導体製造装置市場の推移
半導体試験装置市場の推移
(US$ billion 十億米ドル)
(billion units 十億個)
778 800
400
348
350
700
300
600
250
500
200
400
150
300
100
200
50
100
0
0
'05
'06
'07
'08
'09
'10
'11
'12
'13
'14
(US$ million 百万米ドル)
(US$ million 百万米ドル)
60,000
49,228
50,000
3
6,000
60.0
5,000
50.0
40,000
4,000
36.1
40.0
30,000
3,000
2,657
30.0
20,000
2,000
20.0
10,000
1,000
10.0
0
0
'05
'06
'07
'08
'09
'10
'11
'12
'13
'14
■MOS Memory メモリ
■MOS Logic ロジック
■ANALOG アナログ
■Optoelectronics オプトエレクトロニクス ■Discrete ディスクリート
Total unit 個数
Source: VLSI Research, 2015
(%)
0.0
'05
'06
'07
'08
'09
'10
'11
'12
'13
'14
■SOC Test Systems SOCテスタ ■Memory IC Test Systems メモリテスタ
■Others その他
Advantest share 当社シェア
Source: VLSI Research, 2015
© Copyright 2015 ADVANTEST CORPORATION
Source: VLSI Research, 2015
Consolidated Financial Results, Geographic Sales, Number of Employees |
連結経営成績、地域別売上高、従業員数
Consolidated Financial Results
Geographic Sales
連結経営成績
地域別売上高
(¥ million 百万円)
(¥ million 百万円)
300,000
250,000
(%)
300,000
120.0
250,000
100.0
200,000
80.0
150,000
60.0
100,000
40.0
50,000
20.0
200,000
150,000
100,000
50,000
0
(50,000)
(100,000)
'06
'07
'08
'09
'10
'11
'12
'13
'14
0.0
0
'15
'06
■Net sales 売上高
■Operating income (loss) 営業利益(損失)
■Net income (loss) 当期純利益(損失)
'07
'08
'09
'10
'11
'12
'13
'14
'15
■Japan ⽇本
■Americas 米州
■Europe 欧州
■Asia (excluding Japan) アジア
Overseas net sales as a % of total net sales 海外売上⽐率
(¥ million 百万円)
Years ended March 31 (U.S. GAAP)
3月31⽇に終了した1年間
Consolidated financial results
連結経営成績
2006
2007
2008
2009
2010
2011
2012
2013
2014
2015
Net sales
売上高
253,922
235,012
182,767
76,652
53,225
99,634
141,048
132,903
111,878
163,329
Gross profit
売上総利益
132,493
126,294
93,930
19,815
25,928
48,470
68,748
68,920
49,333
90,426
Operating income (loss)
営業利益(損失)
64,458
56,792
22,716
(49,457)
(11,639)
6,111
837
80
(36,369)
14,619
Income (loss) before income taxes and equity
in earnings (loss) of affiliated company
税引前当期純利益(損失)
67,454
61,090
23,533
(52,761)
(9,926)
5,551
(3,442)
(1,293)
(35,501)
18,859
当期純利益(損失)
41,374
35,556
16,550
(74,902)
(11,454)
3,163
(2,195)
(3,821)
(35,540)
12,948
Net income (loss)
Geographic sales*
地域別売上高(※注)
Japan
⽇本
81,140
72,834
56,032
24,734
11,976
22,398
16,095
14,045
12,221
13,120
Americas
米州
25,516
10,158
9,616
11,759
4,930
9,278
29,742
20,583
10,720
27,695
Europe
欧州
Asia (excluding Japan)
アジア
Overseas net sales as a % of total net sales
Number of employees
海外売上⽐率
14,558
11,238
8,859
2,844
2,137
2,252
7,015
9,061
7,276
9,076
132,708
140,782
108,260
37,315
34,182
65,706
88,196
89,214
81,661
113,438
68.0%
69.0%
69.3%
67.7%
77.5%
77.5%
88.6%
89.4%
89.1%
92.0%
3,595
3,637
3,666
3,187
3,151
3,163
4,464
4,575
4,625
4,564
505
641
909
565
217
223
279
330
278
197
従業員数
Number of employees
従業員数(人)
Average temporary employees
(外、平均臨時雇用者数)
*Note: Geographic sales are based on the location to which the products shipped.
※注:地域別売上高は、出荷先の所在地に基づいています。
© Copyright 2015 ADVANTEST CORPORATION
4
Operating Results by Business Segment | 事業別セグメントの状況
Net sales by Business Segment
Operating Income (Loss) by Business Segment
事業セグメント別売上高
事業セグメント別営業利益(損失)
Net Sales Breakdown of Semiconductor and
Component Test System Segment
半導体・部品テストシステム事業売上高内訳
(¥ million 百万円)
(¥ million 百万円)
300,000
80,000
250,000
60,000
(¥ million 百万円)
200,000
160,000
40,000
200,000
120,000
20,000
150,000
0
100,000
80,000
(20,000)
50,000
40,000
(40,000)
0
(60,000)
0
'06
'07
'08
'09
'10
'11
'12
'13
'14
'15
'06
'07
'08
'09
'10
'11
'12
'13
'14
'06
'15
'07
'08
'09
'10
'11
'12
■Semiconductor and Component Test System
■Semiconductor and Component Test System
■Test Systems for Memory Semiconductors
■Mechatronics System
■Mechatronics System
■Test Systems for Non Memory Semiconductors
半導体・部品テストシステム事業
半導体・部品テストシステム事業
メカトロニクス関連事業
'15
非メモリ半導体用テストシステム
■Services, Support and Others
サービス他
'14
メモリ半導体用テストシステム
メカトロニクス関連事業
■Services, Support and Others
'13
サービス他
(¥ million 百万円)
Years ended March 31 (U.S. GAAP)
3月31⽇に終了した1年間
Net sales by business segment
事業セグメント別売上高
2007
2008
2009
2010
2011
2012
2013
2014
2015
Semiconductor and Component Test System
半導体・部品テストシステム事業
191,415
167,815
131,608
49,216
32,572
69,333
105,608
101,119
73,017
108,320
Mechatronics System
メカトロニクス関連事業
48,260
52,025
34,944
14,388
11,237
18,515
20,616
13,653
14,984
28,347
Services, Support and Others
サービス他
19,062
18,312
19,344
15,815
11,838
14,166
18,807
20,077
24,151
26,752
Elimination and corporate
消去または全社
(4,815)
(3,140)
(3,129)
(2,767)
(2,422)
(2,380)
(3,983)
(1,946)
(274)
(90)
14,588
Operating income (loss) by business segment
事業セグメント別営業利益(損失)
Semiconductor and Component Test System
半導体・部品テストシステム事業
57,517
48,608
23,263
(28,914)
(7,042)
9,857
9,845
10,956
(26,724)
Mechatronics System
メカトロニクス関連事業
11,966
13,647
3,266
(11,865)
(1,897)
(251)
(1,324)
(4,614)
(5,063)
3,768
Services, Support and Others
サービス他
3,853
2,870
3,177
(1,099)
2,175
2,133
1,614
775
3,012
3,348
Elimination and corporate
消去または全社
(6,994)
(5,767)
(6,132)
(7,331)
(4,732)
(5,463)
(8,715)
(6,176)
(6,311)
(7,085)
100,311
109,541
92,896
17,644
12,444
30,016
25,913
17,751
23,403
22,001
91,104
58,274
38,712
31,572
20,128
39,317
79,695
83,368
49,614
86,319
191,415
167,815
131,608
49,216
32,572
69,333
105,608
101,119
73,017
108,320
Net sales breakdown of Semiconductor and
Component Test System Segment
Test Systems for Memory Semiconductors
5
2006
半導体・部品テストシステム事業売上高内訳
メモリ半導体用テストシステム
Test Systems for Non Memory Semiconductors
非メモリ半導体用テストシステム
Total
合計
© Copyright 2015 ADVANTEST CORPORATION
Profitability, R&D Expenses, Capital Expenditures, Depreciation and Amortization |
収益性、研究開発費、設備投資額、減価償却費
Gross Profit Margin
Operating Income Margin
R&D Expenses
Capital Expenditures, Depreciation and Amortization
売上総利益率
営業利益率
研究開発費
設備投資額、減価償却費
(¥ million 百万円)
(%)
50.0
120,000
40.0
90,000
80,000
80.0
60,000
60.0
40,000
40.0
20,000
20.0
30.0
60,000
20.0
30,000
10.0
0.0
0
'06 '07 '08 '09 '10 '11 '12 '13 '14 '15
(%)
(¥ million 百万円)
60.0
150,000
0
0.0
(20,000)
-20.0
(40,000)
-40.0
(60,000)
-60.0
(80,000)
■Gross profit 売上総利益
Gross profit margin 売上総利益率
-80.0
(%)
(¥ million 百万円)
40,000
40.0
30,000
30.0
20,000
20.0
(¥ million 百万円)
15,000
12,000
9,000
6,000
10.0
10,000
0.0
0
'06 '07 '08 '09 '10 '11 '12 '13 '14 '15
'06 '07 '08 '09 '10 '11 '12 '13 '14 '15
■Operating income (loss) 営業利益(損失)
Operating income margin 営業利益率
■R&D expenses 研究開発費
R&D as a % of total net sales 研究開発費売上高⽐率
3,000
0
'06 '07 '08 '09 '10 '11 '12 '13 '14 '15
■Capital expenditures 設備投資額
■Depreciation and amortization 減価償却費
(¥ million 百万円)
Years ended March 31 (U.S. GAAP)
3月31⽇に終了した1年間
Profitability
収益性
2006
2007
2008
2009
2010
2011
2012
2013
2014
2015
Net sales
売上高
253,922
235,012
182,767
76,652
53,225
99,634
141,048
132,903
111,878
163,329
Cost of sales
売上原価
121,429
108,718
88,837
56,837
27,297
51,164
72,300
63,983
62,545
72,903
Gross profit
売上総利益
132,493
126,294
93,930
19,815
25,928
48,470
68,748
68,920
49,333
90,426
Gross profit margin
売上総利益率
52.2%
53.7%
51.4%
25.9%
48.7%
48.6%
48.7%
51.9%
44.1%
55.4%
Operating expenses*
営業費用(※注)
68,035
69,502
71,214
69,272
37,567
42,359
67,911
68,840
85,702
75,807
Operating income (loss)
営業利益(損失)
64,458
56,792
22,716
(49,457)
(11,639)
6,111
837
80
(36,369)
14,619
Operating income margin
営業利益率
25.4%
24.2%
12.4%
-64.5%
-21.9%
6.1%
0.6%
0.1%
-32.5%
9.0%
26,927
29,509
30,507
23,713
17,896
21,197
30,303
33,062
32,670
29,876
10.6%
12.6%
16.7%
30.9%
33.6%
21.3%
21.5%
24.9%
29.2%
18.3%
Research and development expenses
研究開発費
Research and development expenses
研究開発費
R&D as a % of total net sales
研究開発費売上高⽐率
Capital expenditures,
Depreciation and amortization
設備投資額、減価償却費
Capital expenditures
設備投資額
8,323
8,336
14,083
4,608
3,425
3,793
6,984
12,592
5,626
4,246
Depreciation and amortization
減価償却費
8,275
8,214
8,836
8,719
4,314
4,209
6,838
8,063
8,268
5,059
*Note: Operating expenses are composed of research and development expenses, selling, general and administrative expenses. Figures for the fiscal year ended March 31st, 2009, also include restructuring and impairment charges; figures
for the fiscal year ended March 31st, 2014, and the fiscal year ended March 31st, 2015, also include impairment charges.
※注:上記の営業費用は、研究開発費、販売費および⼀般管理費の合計です。なお、2009年3月期の値には構造改革費用および減損費用を、2014年3月期の値および2015年3月期の値には減損費用を含みます。
© Copyright 2015 ADVANTEST CORPORATION
6
Financial Position, Cash Flow Condition | 連結財政状態、連結キャッシュ・フローの状況
Shareholders’ Equity Ratio
ROE
Cash Flows
株主資本⽐率
株主資本利益率
連結キャッシュ・フロー
(¥ million 百万円)
(¥ million 百万円)
(%)
(%)
400,000
90.0
30.0
350,000
80.0
70.0
300,000
60.0
250,000
200,000
150,000
80,000
20.0
60,000
10.0
40,000
50.0
0.0
20,000
40.0
-10.0
0
30.0
100,000
100,000
(20,000)
-20.0
(40,000)
20.0
50,000
10.0
0
0.0
'06
'07
'08
'09
'10
'11
'12
'13
'14
'15
-30.0
(60,000)
-40.0
(80,000)
'06 '07 '08 '09 '10 '11 '12 '13 '14 '15
'06
■Total assets 資産合計
■Shareholders' equity 株主資本
Shareholders' equity ratio 株主資本⽐率
'07
'08
'09
'10
'11
'12
'13
'14
'15
■Cash flows from operating activities 営業活動によるキャッシュ・フロー
■Cash flows from investing activities 投資活動によるキャッシュ・フロー
■Cash flows from financing activities 財務活動によるキャッシュ・フロー
(¥ million 百万円)
Years ended March 31 (U.S. GAAP)
3月31⽇に終了した1年間
Financial position
連結財政状態
2006
2007
2008
2009
2011
2012
2013
2014
2015
Total assets
資産合計
350,776
366,374
298,684
202,059
188,663
180,312
219,226
225,515
229,856
273,041
Shareholders' equity
株主資本
257,927
294,797
254,184
163,616
150,242
138,132
131,552
141,241
116,252
140,938
Shareholders' equity ratio
株主資本⽐率
73.5%
80.5%
85.1%
81.0%
79.6%
76.6%
60.0%
62.6%
50.6%
51.6%
ROE
株主資本利益率(ROE)
17.8%
12.9%
6.0%
-35.9%
-7.3%
2.2%
-1.6%
-2.8%
-27.6%
10.1%
(17,746)
Cash flow condition
連結キャッシュ・フローの状況
Cash flows from operating activities
営業活動によるキャッシュ・フロー
59,480
48,951
24,166
2,357
(693)
12,302
(2,215)
(3,776)
24,481
Cash flows from investing activities
投資活動によるキャッシュ・フロー
(8,542)
(8,013)
(16,322)
(32,507)
10,824
(5,828)
(37,670)
(11,498)
(4,711)
(1,310)
Cash flows from financing activities
財務活動によるキャッシュ・フロー
(18,336)
(3,662)
(46,770)
(8,930)
(1,803)
(12,028)
9,887
(2,914)
27,202
(1,298)
Free cash flows
フリー・キャッシュ・フロー
Cash and cash equivalents at end of year
現⾦および現⾦同等物の期末残高
50,938
40,938
7,844
(30,150)
(6,922)
(6,521)
(25,368)
(13,713)
(8,487)
23,171
157,925
196,395
147,348
105,455
96,439
75,323
58,218
45,668
68,997
97,574
ROE= Net income / Average shareholders' equity 株主資本利益率=当期純利益÷株主資本(期中平均)
Free cash flows= Cash flows from operating activities + Cash flows from investing activities フリー・キャッシュ・フロー=営業キャッシュ・フロー+投資キャッシュ・フロー
7
2010
© Copyright 2015 ADVANTEST CORPORATION
Share Information | 株式情報
Quarterly Share Price Range
Dividend per Share
Breakdown of Shareholders
株価の推移
1株当たり配当⾦
所有者別株式数分布状況
(¥ 円)
(¥ 円)
9,000
Others Entities and Treasury Shares
302 holders,
27,417 thousand shares(*)
60.00
8,000
その他の法人・⾃己株式
302名 27,417千株(※)
7,000
6,000
Financial Institutions and
Securities Company
95 holders,
98,592 thousand shares
13.8%
⾦融機関・証券会社
95名 98,592千株
40.00
5,000
14.4%
4,000
3,000
Individuals and Others
36,451 holders,
28,791 thousand shares
20.00
株主数
'06
'07
'08
'09
'10
'11
'12
'13
'14
'15
Non-Japanese Holders
443 holders,
44,767 thousand shares
22.4%
1,000
0
49.4%
37,291名
個人・その他
36,451名 28,791千株
2,000
Number of shareholders
37,291 holders
外国人
443名 44,767千株
0.00
'06 '07 '08 '09 '10 '11 '12 '13 '14 '15
(*) 25,020,294 shares of treasury shares listed under "Other Entities and Treasury Shares."
(※)⾃己株式25,020,294株は「その他の法人・⾃己株式」に含めて記載しています。
Years ended March 31
各3月31⽇までの1年間
Quarterly share price range
株価の推移(四半期ベース)
1Q
2Q
3Q
4Q
High (\)
Low (\)
High (\)
Low (\)
High (\)
Low (\)
High (\)
Low (\)
1Q
2Q
3Q
4Q
2006
2007
2008
2009
2010
2011
2012
2013
2014
2015
高値(円)
4,235
7,605
5,750
3,100
1,910
2,516
1,663
1,386
1,887
1,303
安値(円)
3,700
5,160
5,120
2,235
1,423
1,860
1,387
952
1,246
1,063
高値(円)
4,580
6,065
5,450
2,660
2,550
2,020
1,591
1,261
1,710
1,422
安値(円)
3,955
5,185
3,410
2,050
1,581
1,571
802
914
1,121
1,126
高値(円)
5,945
6,820
3,850
2,240
2,525
1,916
970
1,374
1,343
1,586
安値(円)
4,140
5,640
2,855
996
1,864
1,456
718
838
1,061
1,192
高値(円)
7,715
6,720
2,975
1,666
2,615
1,924
1,323
1,525
1,315
1,678
安値(円)
5,965
5,100
2,100
1,122
2,033
1,179
671
1,156
988
1,301
2006
2007
2008
2009
2010
2011
2012
2013
2014
2015
Years ended March 31
3月31⽇に終了した1年間
Number of shares issued
発⾏済株式数の推移
Number of shares issued at year-end
Investment indicator
発⾏済株式数(期末)
199,566,700
199,566,770
199,566,770
199,566,770
199,566,770
199,566,770
199,566,770
199,566,770
199,566,770
199,566,770
74.31
投資指標
Net income (loss) per share-Basic (\)
基本的1株当たり当期純利益(損失)(円)
223.17
190.01
90.72
(419.09)
(64.09)
18.03
(12.67)
(22.03)
(204.10)
Net income (loss) per share-Diluted (\)
希薄化後1株当たり当期純利益(損失)(円)
221.98
188.85
90.57
(419.09)
(64.09)
18.03
(12.67)
(22.03)
(204.10)
67.16
Shareholders' equity per share (\)
1株当たり株主資本(円)
1,381.85
1,570.99
1,422.20
915.47
840.65
797.20
759.22
812.70
667.36
807.45
Dividend per share (\)
1株当たり配当⾦(円)
Dividend payout ratio
配当性向
35.00
50.00
50.00
30.00
10.00
10.00
15.00
20.00
15.00
15.00
15.7%
26.3%
55.1%
-
-
55.5%
-
-
-
20.2%
Note: On Oct. 1, 2006, a one to two stocks split was made to share of common stock. Prior to March 31, 2007, all share and per share information has been adjusted to reflect the stock split.
注:2006年10月1⽇に、当社は普通株式1株につき2株の割合で株式分割しました。それ以前の各期の株価情報と1株当たり指標は、それぞれの期⾸にこの株式分割が⾏われたと仮定して算出しています。
© Copyright 2015 ADVANTEST CORPORATION
8
http://www.advantest.com
© Copyright 2026 Paperzz