Energy Performance Indicator Tracking Schemes
for the Continuous Optimisation of Refurbishment
Processes in European Housing Stocks
Energy Performance Indicators
for Building Stocks
First version / starting point of the
EPISCOPE indicator scheme
(to be developed during the project)
(Deliverable D4.1a)
EPISCOPE Project Team
March 2014
Contract N°: IEE/12/695/SI2.644739
Coordinator:
Institut Wohnen und Umwelt, Darmstadt / Germany
Project duration: April 2013 - March 2016
Authors
Partner
City / Country
N. Diefenbach, T. Loga,
B. Stein (ed.)
IWU - Institut Wohnen und Umwelt /
Institute for Housing and Environment
Darmstadt / Germany
A. Arcipowska
BPIE - Buildings Performance Institute Europe
Brussels / Belgium
A. Rakušček, M. Šijanec Zavrl
Building and Civil Engineering Institute ZRMK
Ljubljana, Slovenia
K. B. Wittchen, J. Kragh
SBi - Danish Building Research Institute, AAU
Aalborg / Denmark
N. Altmann-Mavaddat
AEA -Austrian Energy Agency
Vienna / Austria
J. Hulme, J. Riley
BRE - Building Research Establishment Ltd.
Watford / United Kingdom
E. Dascalaki, C. Balaras
NOA - National Observatory of Athens
Athens / Greece
D. Cuypers, M. Van Holm
VITO - Flemish Institute for Technological Research
Mol / Belgium
V. Corrado, I. Ballarini
POLITO - Politecnico di Torino – Energy Department
Torino / Italy
T. Vimmr
STU-K
Prague / Czech Republic
M. Hanratty, B. Sheldrick,
C. Roarty
Energy Action Limited
Dublin / Ireland
T. Csoknyai, G. Szendrő,
S. Hrabovszky-Horváth
BME - Budapest University of Technology and Economics
Budapest / Hungary
L. Ortega
IVE - Valencian Institute of Building
Valencia / Spain
D. Serghides, M. Katafygiotou
CUT - Cyprus University of Technology
Limassol / Cyprus
N. Nieboer, F. Filippidou
DUT - Delft University of Technology
Delft / Netherlands
U. Rochard, S. Shanthirabalan
Pouget Consultants
Paris / France
H. Brattebø
NTNU - Norwegian University of Science and Technology
Trondheim / Norway
M. Jovanovic Popovic,
D. Ignjatovic
University of Belgrade
Belgrade / Serbia
Building Stock Energy Performance Indicators
- First version / Starting point of the EPISCOPE indicator scheme
EPISCOPE Project Team, March 2014
EPISCOPE website: www.episcope.eu
The sole responsibility for the content of this deliverable lies with the authors. It does not necessarily
reflect the opinion of the European Union. Neither the EACI nor the European Commission are
responsible for any use that may be made of the information contained therein.
Contents
I
Contents
1
Introduction .................................................................................................................... 1
2
Monitoring Indicators ...................................................................................................... 3
2.1 Basic data of the building stock ............................................................................... 3
2.2 Building insulation ................................................................................................... 5
2.3 Heat Supply ............................................................................................................ 7
2.4 Energy Consumption ..............................................................................................10
3
Scenario Indicators........................................................................................................11
3.1 State Indicators of building insulation and heat supply ...........................................11
3.2 Trend Indicators of building insulation and heat supply ..........................................12
3.3 Energy Balance Indicators .....................................................................................14
3.4 Summary Indicators ...............................................................................................18
Introduction
1
1
Introduction
A major objective of the EPISCOPE project is to lay a basis for the tracking of the energy
refurbishment progress of housing stock entities in the field of thermal protection and heat
supply (heating and hot water) against the background of energy saving and climate
protection needs. During the project different residential building stocks are analysed in 16
European countries – from local housing portfolios to regional or national housing stocks.
In this paper a first and preliminary version of an indicator scheme is introduced which makes
possible comparisons between national actions of energy performance tracking (within and
beyond EPISCOPE). Moreover, it is intended to define a generally applicable set of
quantities which – in case of a regular update – can deliver the basic information which is
necessary to observe and understand the development of energy performance in residential
building stocks 1.
Against that background the EPISCOPE indicator system intends to deliver a kind of
common language for the exchange of information on international level. It does not provide
any limiting rules with respect to the national pilot projects which are carried out
autonomously by the partners. But the results of the individual projects will have to be
translated to the common indicator system so that a comparison will be possible.
Carrying out energy performance analysis of a building stock is in principle a two step
process. This has accordingly to be considered by the indicator scheme:
1. Monitoring: Reliable data of the building stock have to be collected and updated regularly
(by representative surveys). Basic information is characterised by monitoring indicators.
2. Scenario analysis: A model of the building stock is established and scenario analysis of
possible future development (refurbishment and new buildings) is carried out. Scenario
indicators describe basic assumptions and the most important results.
During the EPISCOPE project special attention is paid to the first step. The question has to
be answered in how far reliable data about the European residential building stocks (here
represented by the national pilot actions) are actually available and – in case of deficiencies
– how the information basis could be improved and regular monitoring systems could be
established. The assigned indicator scheme (“monitoring indicators”) intends to deliver the
necessary basic information about thermal protection and heat supply on the one hand; on
the other hand the applied quantities must be compatible to the information which can be
collected by practicable, reliable surveys. Moreover, the monitoring indicators should directly
reflect the monitoring results, i. e. they should not (or only to a very small extent) depend on
additional (more or less unproved) model assumptions. All in all the monitoring aims at laying
an objective basis for further analysis.
Some vital questions cannot be directly answered by the monitoring, for example “How far
are we away from reaching our CO2 targets in the building stock? Which future development
of the building stock would reach the targets?” To analyse this kind of problems a second
step is necessary which includes model development and trend/scenario analysis. Model
development will be based on monitoring results but additional assumptions will have to be
made by the analysts to draw a coherent picture of the existing building stock and its future
development. Scenario indicators, which are based on monitoring data as well as on
additional settings, serve to make the basic assumptions and the results of the analysis
transparent and comparable.
1
Building stock analysis during the EPISCOPE project is to some extent connected to the building typologies,
which were developed during the TABULA and EPISCOPE projects (also documented on the joint EPISCOPE
and TABULA website www.episcope.eu). Nevertheless, defining indicators for building stocks is different from
describing example buildings of a typology, so for the EPISCOPE indicator scheme a new approach had to be
made.
2
Building Stock Energy Performance Indicators
Building stocks are characterised by a large diversity of houses and heat supply systems,
accordingly the number and variety of possible classification systems and indicators is very
large as well. The draft indicator scheme, which is described in the following chapters, tries
to keep the problem manageable by focussing on basic parameters. Later extensions during
the project are possible.
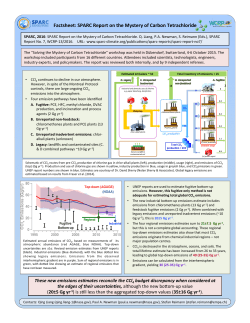
The following picture provides a more detailed overview of the different types indicators
which will be introduced in the following chapters.
Figure 1:
Overview of the EPISCOPE scheme of building stock energy performance indicators
The monitoring indicators (blue boxes) provide a reliable data basis for the establishment of
building stock modelling, but they will have to be accompanied by model assumptions to
close information gaps and to describe the future development. The complete indicator set
describing the building stock in its actual state (“basic case”) and in future conditions is called
the scenario indicators (purple boxes). They include the “structural” data of the building
stock, which means information about the state at a certain year (state indicators) as well as
time development in a certain period (trend indicators) of thermal building insulation and heat
supply systems. This structural data is a basis for the modelling of the energy balance
(including greenhouse gas emissions), which results in the energy balance indicators.
Whereas state, trend and energy balance indicators deliver quite detailed information, results
of general meaning will be shown as summary indicators, which are also dedicated to nonexperts.
In the course of the project a further development of the indicator scheme will be carried out.
In that process the options of extending the scheme (e.g. to improve the level of detail) and
of improving harmonisation (for a better cross-country comparability) will have to be
considered along with the target of a sufficiently good and universal applicability of the
concept.
Monitoring Indicators
2
3
Monitoring Indicators
For the collection of reliable statistical information surveys are necessary. At best they cover
the complete building stock (complete inventory count like a census) but usually sample
surveys will be available, which must be representative and deliver statistically significant
results. The interviewees must be people who know the information to be collected (e.g.
house owners better then tenants), maybe expert interviewers can also collect information
on-site.
The data in question concern structural data about the thermal protection of the buildings as
well as heat supply systems. Both “state indicators” and “trend indicators” have to be
considered: Whereas the state indicators describe the current situation in the building stock
(e. g. the distribution of different quality levels of wall insulation), the trend indicators are
related to the actual dynamics (e.g. annual rates of wall insulation). In other words: State
indicators provide information about the progress of energy efficiency which has been made
in the past whereas trend indicators provide information about the current velocity of
movement towards better energy efficiency and climate protection.
Besides structural data of thermal protection and heat supply which provide detailed
information of the progress and the processes in the building stock also energy consumption
values of the observed building stock in the recent years should be collected to make
possible an adjustment of the later model calculations (see chapter 3).
Only reliable data should be presented as monitoring indicators. Detailed information about
the used data sources and adaptations of the original data (if necessary) will have to be
documented. The project will stress the question of representativeness, significance and
reliability of such survey results. In the later project reports (to which all partners will
contribute) a detailed documentation of the applied data sources, of data reliability, and of
own model approaches to adapt the data will have to be given (Synthesis Reports 2, 3 and 4
- D3.4, D3.5, D4.4).
It may be the case that in some pilot projects information gaps occur, that means that not all
statistical data are available to create an empirically justified building stock model (and to fill
in the complete monitoring tables which follow). Carrying out additional surveys
(complementary to the available data sources) is mostly beyond the range of EPISCOPE 2 so
that such information gaps will have to be closed by model assumptions. But this will be part
of the model development (in chapter 3) whereas the monitoring indicators described in
chapter 2 should indeed be kept empty in such a case: One of the major aims of EPISCOPE
is to draw a realistic picture of available basic data of building stocks, to discover information
gaps and compare them internationally and to develop concepts for the future
implementation of regular monitoring systems which collect all necessary data. So the
system of monitoring indicators will make possible a review of the existing situation of data
availability 3.
2.1 Basic data of the building stock
The first monitoring table (Table M.1) delivers basic data of the building stock, e. g. from the
census (if available) in case of a national stock.
2
3
But for example in the Irish pilot action the carrying out of a survey is included.
On the other hand it has to be considered that (reliable) statistical data of national building stocks were already
collected during the TABULA activity (see “country pages” at www.episcope.eu/country). If applicable, this data
can be used for the EPISCOPE scheme of monitoring indicators as well. In contrast to the TABULA statistical
data the EPISCOPE scheme of monitoring indicators is a more clearly structured approach, which was chosen
to facilitate the application of monitoring indicators for model development and scenarios (i.e. to carry out a
transformation from the monitoring indicators to the scenario indicators of chapter 3).
4
Building Stock Energy Performance Indicators
According to the EPISCOPE project tasks it is intended that also interesting subgroups of the
building stock will be observed. In the proposed scheme it is foreseen that besides the
complete building stock also a subgroup “old building stock” and another one “new buildings”
is considered 4.
The partners can choose the definition of the age bands of the two subgroups individually.
The intention of monitoring new buildings separately is to learn about the actual trends in the
new building sector. A special subset “old building stock” is considered for two reasons: First
it is assumed that old buildings up to a certain construction period (which may be different in
different countries and building stocks) have an above-average energy consumption (if they
are not yet renovated for energy upgrading) and so this part of the building stock will be of
special interest for exploiting the energy saving potentials. Secondly it is a relatively stable
subgroup: In contrast to the complete building entirety the old building stock is not affected
by new construction of houses but only by demolition (with usually relatively small annual
rates). So it is proposed that every partner separately analyses and presents an “old building
stock” subset (including a major part of the existing building stock) in his analysis 5.
Table 1:
M.1 Basic data of the building stock
M.1 Basic data of the building stock
Complete building stock Old building stock
e.g. bs...2012|2012
e.g. bs...1980|2012
New buildings
e.g. bs2011-2012|2012
number of buildings
number of apartments
national reference area [m²]
sources / remarks
In the above and the following tables there is a field sources/remarks for the documentation
of the origin of the data and for additional remarks. Here, a short cross reference to the
original data source and – if necessary – some explanations that are necessary for the
understanding of the data should be given.
Excursus: building stock nomenclature
Building stocks are changing because of new construction and demolition of buildings. For a
clear definition of the observed residential building stocks the following writing is proposed:
bs{construction period}|{time of observation}, e.g.:
bs…1980|2012: building stock (bs) composed of all residential buildings constructed until end of
1980 as a subgroup of the residential building stock of the year 2012
bs2011-2012|2012: all residential buildings constructed in the years 2011-2012 as a subgroup of
the residential building stock 2012
bs…2012|2012 (or shortcut bs2012): complete residential building stock 2012
bs2012|2020 : all residential buildings constructed in the year 2012 as a subgroup of bs2020
If in later chapters not monitoring data but the results of model calculations are presented, a
shortcut for the scenario variant may be added if necessary (That means if the building
stocks of the scenarios are not the same because different construction and demolition rates
are assumed). For example:
bs…1980|2030|S1: all residential buildings constructed until 1980 as a subgroup of the residential
building stock in the year 2030 according to a scenario called S1.
4
5
Of course, further subgroups may be defined and observed by the partners. The same applies to all other
classifications and indicators: In the national pilot actions much more detailed information may be collected and
presented. But with the EPISCOPE building stock indicators a common scheme of data presentation is defined
which makes possible comparisons between the projects and which – as far as possible – should be followed
by each partner.
In the following table all buildings erected until 1980 are included in the old building stock, but this is just an
example.
Monitoring Indicators
5
2.2 Building insulation
Table M.2.1 documents basic information about energy-related building modernisation
(renovation for thermal upgrading) 6. The four different building elements wall, roof, ground
floor and windows are considered. Information is given about the state of the building stock
(Which percentage of walls has already been modernised?) and about the current trend
(What is the annual rate of wall insulation?). Because it can be assumed that new buildings
(erected in recent years) are not affected by refurbishment measures (until “now” or the time
of monitoring) they are not included in the table.
Table 2:
M.2.1 Building insulation: State and trends of modernisation
M.2.1 Building insulation: Basic information state and trends of modernisation
Complete building stock Old building stock
percentages related to....
walls
insulation improved (from original state)
20,4%
25,3%
(e.g.) building number
insulation improved (area-weighted)
15,0%
19,4%
element area
average thickness of improved insulation
4,7 cm
average of element area
annual rate of insulation improvement
0,65%/a
0,82%/a
(e.g.) building number
annual rate of insulation improvement (area-weighted)
0,51%/a
0,63%/a
element area
average thickness of insulation (recent modernisation)
8,4 cm
average of element area
roofs / upper floor ceilings
table like walls
...
...
...
ground floors / cellar ceilings
table like walls
...
...
...
windows {example of minimum standard:} (improvement to at least thermal protection double glasing)
...
table like walls
...
...
complete/old stock: percentages related to bs...2010|2010 / bs...1980|2010 [1]
sources / remarks
annual rates/recent insulation thickness: mean values 2007-2010
The documented information is typical for house owner surveys in which the interviewees are
asked which modernisation measures have already been carried out at the building and if
they were carried out during a recent time period (so that up-to-date average annual rates
can be calculated). An example of the complete table is given for the walls, in case of the
other elements the tables would have the same format.
The last column indicates the reference parameter of the percentages; in the first row it is the
building number. For example it is indicated that at 25,3 % of the buildings of the old building
stock (buildings constructed until 1980) a thermal modernisation of the wall has already been
carried out. Accordingly, the annual rate of 0,82 %/a means, that on average in a recent time
period (here: 2007-2010, see “sources/remarks”) every year wall insulation measures were
carried out at 0,82 % of the buildings.
Apart from the pure information if any modernisation has been carried out also area-weighted
numbers of the already achieved progress of thermal refurbishment (19,4 %) of the observed
modernisation rate (0,63 %/a) can be documented in the table. They give clearer information
about the actual progress of thermal modernisation, but of course they can only be filled in if
reliable data about the coverage area of insulation measures is actually available, e.g. if in
the house owner survey the question was asked which fraction of the total wall area had
been insulated.
Also the average values of the thickness of insulation applied to the walls by refurbishment
can be documented if the information is available (typically from house owner surveys). In
the given example mean values of insulation thickness are 4,7 cm for all energy-related wall
refurbishment measures carried out in the past and 8,4 cm for the recent measures (average
value of the years 2007-2010). Those values are only available for the complete building
stock and not separately for the old buildings so that the respective fields were kept empty.
6
The example numbers here and in the further tables are just given to illustrate the scheme. They are
hypothetical, not related to any real (also not the German) building stock.
6
Building Stock Energy Performance Indicators
Project partners may define minimum standards for the refurbishment measures which are
counted in table M.2.1, if applicable. If so, the used definition should be stated in the table.
For example, it might be argued that insulation layers below a certain thickness (e.g. 1 cm)
should not be taken into consideration 7.
Table M.2.2 gives additional, more detailed information about the distribution of different
levels of wall insulation. The project partners can define the number and the boundaries of
the levels. Later in the project we will examine opportunities to harmonise levels.
Again for simplification the detailed information is given for walls only, for the other elements
the tables would in principle have the same format. In contrast to table M.2.1 not only thermal
modernisation of elements of the building envelope (that means improvement in later years
after building construction) is documented but a general overview of the quality of building
insulation is provided. On the other hand, there is no information about the trends of thermal
modernisation.
Table 3:
M.2.2 Building insulation levels
M.2.2 Building insulation: Detailed information of the actual state
number of levels and boundaries defined by partners (maybe later harmonisation?)
Complete building stock Old building stock
levels of wall insulation (area-weigthed):
level 0 (U > 0,7 W/m²K)
60%
80%
level 1 (0,7 W/m²K >= U > 0,3 W/m²K)
25%
10%
level 2 (0,3 W/m²K >= U > 0,20 W/m²K)
12%
9%
level 3 (U <= 0,20 W/m²K )
3%
1%
roofs / upper floor ceilings
similar to walls (different system of levels)
...
...
ground floors / cellar ceilings
similar to walls (different system of levels)
...
...
windows
similar to walls (different system of levels)
...
...
sources / remarks
percent numbers related to element areas
numbers related to the following building stocks:
bs...2010|2010 [6]
bs...1980|2010 [6]
New buildings
0%
25%
60%
15%
...
...
...
bs2011-2012|2012 [7]
A typical source for providing data to Table M.2.2 could be a representative survey of energy
performance certificates or energy audits. In this case probably even more detailed
information could be given, for example the mean U-value (heat transfer coefficient) for every
level and building element. The project partners may of course document this in more
detailed reports, but for the time being it was not included in the common scheme for two
reasons:
Firstly, it must be recognised that results from energy certificates or energy audits are not
completely objective measurements but usually depend on the (often empirically unproved)
assumptions of the related energy balance models. This is even the case for basic
parameters like U-values, at least for non-refurbished walls: The exact U-value cannot be
measured but it is assigned to the element on basis of a simplified scheme (e.g. U-values of
walls are estimated by the type and age of the wall as in the TABULA typology approach).
Secondly, there is the possibility to fill in the table (at least partly) even if not a survey of
energy certificates or audits but a house owner’s survey is available: Of course the house
owners will not be able to tell exact U-values but they deliver some basic information (again
type and age of the wall as well as information about insulation layers) that will make
possible an assignment of the walls to the different insulation levels.
So this might be an example where basic model assumptions have to be applied even in the
framework of monitoring indicators. General criteria to define an exact border between the
7
In our German project we will prospectively use such a definition only in case of windows (see example in the
table): Thermal protection glazing (low-e-glazing, not simple double glazing) will be introduced as a minimum
standard of modernisation measures because in the past single glazing was already almost entirely replaced
by double glazing in the German building stock.
Monitoring Indicators
7
“objective” and empirically proved monitoring indicators and the model-dependent scenario
indicators cannot be given 8. The decision, if data is sufficiently reliable to be classified as
monitoring data (and the justification of this setting) is kept to the project partners. If any
possible, statistical errors of the monitoring data should be calculated and documented.
Comparing the tables M2.1 and M2.2 and the basic data table M.1.1 it turns out that they are
not completely related to the same building stocks: For example, in M1.1 the old building
stock is described from a 2012 point of view (bs1980|2012) whereas in M.2.1 and M.2.2 data
from the year 2010 is documented (bs1980|2010). This exemplary setting aims at making clear
again that monitoring data should be related closely to the original data. If only primary data
sources from different years are available they should be documented as they are, modelbased data processing should be restricted to a necessary minimum. Of course, for the
formation of building stock models the processing of the monitoring data will be necessary to
construct a coherent image of the building stock at a certain time as a starting point for trend
and scenario analysis. This modelling task will have to be carried out by all partners, but
according to the given definition it will be no longer part of building stock monitoring but the
first step of model development, so the results will not be documented as monitoring but as
scenario indicators (see “Basic Case” in chapter 3).
2.3 Heat Supply
Table M.3.1 indicates basic information of the applied heat supply systems for space heating.
The centralisation grade of the system, the main energy carrier and the type of heat
generation are considered separately.
The left part of the table shows the observed state of the complete, the old and the new
building stock; in the right part modernisation rates of the complete and old building stock are
documented.
Table 4:
M.3.1 Main heat supply system for space heating
M.3.1 Main Heat Supply Systems for Space Heating
Complete building stock
M.3.1.1 Centralisation of space heating system
district heating
building / apartment heating
room heating
M.3.1.2 Main energy carrier for space heating
district heating
gas (natural / liquid gas)
oil
coal
wood/biomass
electricity
state of the building stock
Old building stock New buildings
12%
80%
8%
100%
10%
75%
15%
100%
15%
83%
2%
100%
12%
42%
32%
2%
5%
7%
100%
...
...
...
...
...
...
100%
...
...
...
...
...
...
100%
12%
...
...
52%
...
24%
...
1%
...
M.3.1.3. Main heat generation system for space heating
district heating
combustion of fossil fuels: "level 0" systems:
stoves, non-condensing boilers
combustion of fossil fuels: "level 1" systems:
gas/oil condensing boilers
combustion of fossil fuels: "level 2" systems
gas/oil driven heat pumps / chp systems
combustion of wood/biomass: "level 0" systems:
simple/old/unefficient stoves and boilers (mostly split log)
combustion of wood/biomass: "level 1" systems: modern boilers and
stoves (mostly wood pellets, wood chips)
direct electric heating
electric heat pumps
sources / remarks
3%
modernisation trends
Complete building stock Old building stock
net modernisation rates
+0,1%/a
+0,3%/a
-0,4%/a
0%
net modernisation rates
+0,1%/a
+0,3%/a
-0,3%/a
-0,1%/a
+0,2%/a
-0,2%/a
0%
gross modernisation rates
...
...
...
...
...
...
...
...
...
+0,1%/a
...
...
+0,2%/a
...
...
+2,5 %/a
...
...
< +0,1%/a
...
0%/a
2%
...
...
+0,3 %/a
4%
...
...
0%/a
2%
...
...
+0,1%/a
100%
100%
100%
+3,2%/a
percentage numbers related to apartments
percentage numbers related to apartments
numbers related to the following building stocks:
numbers are mean values 2007-2011 [8]
bs...2011|2011 [8]
bs...1980|2011 [8]
bs2011-2012|2012 [7]
...
...
...
...
In M.3.1.3 the systems driven by fossil fuels are assigned to three classes (levels 0, 1, 2).
Level 0 includes old, comparably inefficient systems, level 1 is assigned to a typical “state of
8
In fact there might also be an overlap: (Reliable) monitoring indicators may be applied as scenario indicators at
the same time. But on the other hand scenario indicators which are not empirically justified may not be applied
as monitoring indicators.
8
Building Stock Energy Performance Indicators
the art” standard and level 2 includes forward-looking systems which are not yet established
at the market of heating systems but will prospectively be needed in the future. A similar
scheme of levels was applied to biomass systems.
The definition of such levels is just an example at the moment: For carrying out model
analysis more detailed information will be necessary in the individual projects. But the
indicator system aims at giving an overview only and the definition of levels is proposed here
to keep the number of quantities manageable. Project partners are invited to check if they
can also define suitable levels in a similar way and during the project it will be examined if a
harmonised approach is possible. Alternatively, the different system types will have to be
listed separately and in more detail in table M.3.1.3. For a start it will probably be the best
solution not to simplify too much, so everybody should find a way to categorise the main heat
generation systems in a suitable way that draws a sufficiently clear picture of the variety of
systems but on the other hand is not too detailed (so that later cross-country comparison is
also still clear and easy).
In the right part of the table two types of modernisation rates are considered: For
centralisation and energy carriers net modernisation rates and for the system types gross
modernisation rates are documented. The net rates indicate structural changes, for example
in the table it is shown that the fraction of systems which use gas as the main energy carrier
is growing by 0,3 % every year. But this number does not provide information of the number
of gas systems which is modernised every year, because if a gas driven system is replaced
by a new one (again driven by gas) this is not indicated. In contrast, for the modernisation of
heat generation systems the gross modernisation rates are documented. For example it is
indicated that every year 2,5 % level 2 fossil systems (gas or oil condensing boilers) are
installed. So this number indicates the total modernisation activities, but it cannot provide
information about the net growth of condensing boilers in the building stock (because it might
be that just old condensing boilers are replaced by new ones). Accordingly the gross rates of
all heat generation systems sum up to the complete modernisation rate of heat generation
systems in the observed building stock (in the above example 3,2 %/a for the complete
building stock), whereas net modernisation rates always add up to zero.
Of course, in principle both types of information are of interest – gross as well as net
modernisation rates. But again, it is intended to keep the overview tables manageable and so
it was decided to make a choice: In case of centralisation and energy carriers the net
development appears more interesting because it illustrates the structural changes. On the
other hand the necessary complementary information of gross modernisation activities must
also be given and it appears to be best suited to do this in the framework of the heat
generation systems, because here the gross rates give a detailed picture of the
modernisation effort which is made by the house owners: For example, the investment costs
for new systems are closely related to both the gross rates and to the type of applied
systems 9.
The next table M 3.2 provides information about additional systems, which might be of
special interest concerning heating and hot water supply. Again gross modernisation rates
are considered for the energy generation systems.
9
The question of gross or net rates also has to be clarified in case of thermal modernisation measures in table
M.2.1. Here we define that gross rates are documented, so that a picture of the total modernisation activities of
building insulation is drawn.
A difference between gross and net rates occurs only if building elements (e.g. walls) which have already been
modernised by thermal insulation measures in the past are now modernised again. At the moment it can
probably be assumed, that those cases do not play a major role in most observed building stocks, but in later
years it might become more important. So in the documentation of scenarios the difference will have to be
considered. (See later in chapter 3.2: Also there gross modernisation rates are indicated for thermal insulation
and the main heat generation systems, but the information of net changes is not lost because it can be derived
from the comparison of the state indicators (chapter 3.1) of different years.)
Monitoring Indicators
Table 5:
9
M.3.2 Special Systems
M.3.2 Special Systems (additional systems of special interest for space heating, hot water supply, ventilation, including photovoltaics)
state of the building stock
Complete building stock
Old building stock New buildings
solar thermal systems
14%
...
...for hot water supply only
11%
...
...for heating and hot water supply
3%
...
photovoltaic systems
12%
...
ventilation systems
(for buildings/apartments, not only kitchen/WC ventilation)
4%
...
....with heat recovery
1%
...
...without heat recovery
3%
...
additional systems of special interest for the observed building stock may be defined by the partners
sources / remarks
percentage numbers related to apartments
numbers related to the following building stocks:
bs...2011|2011 [8]
bs...1980|2011 [8]
bs2011-2012|2012 [7]
...
...
...
...
modernisation trends (gross rates)
Complete building stock Old building stock
+ 1,1%/a
+ 0,8 %/a
+ 0,3 %/a
+0,7%/a
...
...
...
+ 0,3%/a
<+0,1 %/a
+ 0,3 %/a
...
...
...
...
...
...
...
...
Besides solar thermal systems also photovoltaic systems at the buildings are considered.
Although they do not directly produce heat, they are of general interest for building stock
development and – depending on the algorithms applied by the partners – they can play a
role even in the energy balance for heat supply because they produce electricity which might
be used in electric heat pumps, for example. Ventilation systems – especially those with heat
recovery - are also linked to the buildings’ energy consumption for heat supply.
The partners, if applicable may add further systems, which are not yet considered in the
table.
The applied main systems of hot water generation (apart from solar thermal systems) are
considered in table M.3.3. This table is called “optional” because it is assumed that reliable
survey data about hot water generation (which usually plays a minor role compared to space
heating) might often not be available. For simplification only state indicators and no trend
indicators (modernisation rates) are considered and a break down of the cases with hot
water generation by the heating system is not given (but might be added, if information is
available).
Table 6:
M.3.3 Main system of hot water supply
M.3.3 Main System of Hot Water Supply
apart from additional solar thermal systems (see above)
Complete building stock
M.3.3.1 Main Energy carrier for hot water supply
district heating
gas
oil
coal
wood/biomass
electricity
M.3.3.2 Main heat generation system for hot water supply
hot water generation combined with heating system:
separate system of hot water generation:
- direct electric heat generation
- electric heat pump
- combustion of fossil fuels
- combustion of wood/biomass
sources / remarks
10%
42%
32%
2%
5%
9%
100%
Old building stock
...
...
...
...
...
...
100%
New buildings
...
...
...
...
...
...
100%
71%
...
...
21%
...
...
1%
...
...
6%
...
...
1%
...
...
100%
100%
100%
percentage numbers related to apartments
numbers related to the following building stocks:
bs...2011|2011 [8]
bs...1980|2011 [8]
bs2011-2012|2012 [7]
Solar thermal systems are not treated here but above in M.3.2. They are interpreted as
“additional systems” because they can generally not work alone (even if they often produce
around or even more than 50 % of the hot water energy in a year). They must be
accompanied by other basic systems, which generate the hot water when the sun is not
shining and which are here interpreted as the main systems (even if the contribution of the
solar thermal system might be higher) 10.
10
In contrast to this assumption it might be the case that within a building stock there is a considerable number of
buildings/apartments, which are only supplied by solar thermal (with no accompanying system). In such a case
the respective solar systems would have to be treated as an additional category of main hot water systems.
10
Building Stock Energy Performance Indicators
2.4 Energy Consumption
The collection of measured data of the total energy consumption of the observed building
stock (final energy consumption distinguished by energy carriers) during recent years will be
necessary to test if the applied calculation models deliver realistic results and to make
possible an adjustment of such models. An example for the presentation of collected data is
given in Table M.4.
Table 7:
M.4 Observed final energy consumption (Example table)
M.4 Final Energy balance: Measured values
Complete building stock
energy consumption in TWh/a (109 kWh/a)
district heating
gas
oil
coal
wood/biomass
electricity
sources / remarks
mean annual values of the years 2009-2011 for the national residential building stock [10,11]
...
...
...
...
...
...
energy consumption for all household appliances (heating, hot water, cooking, electric appliances, other)
fuel consumption is indicated by the gross calorific value
According to the TABULA definition the gross calorific value is applied to indicate fuels (see
also the remarks in chapter 3.3 to this question)
The appearance of this table might be different depending on the available information. In
general it must be considered that information will often not be available for the heat supply
of residential buildings separately. For example gas consumption for cooking and the electric
energy consumption for all household appliances will often be included in the numbers.
Additional analysis for making the given numbers comparable to the energy balance
calculations of the observed building stocks (including also weather / climate corrections) will
usually be necessary. But this will be done later during model analysis and it is not a part of
the monitoring. So in table M.4 the available data should be documented as it is.
Scenario Indicators
3
11
Scenario Indicators
3.1 State Indicators of building insulation and heat supply
A first step of model analysis will be the construction of a coherent building stock at a certain
starting point, for example at the end of the year 2013 (bs2013|2013). Presumably this building
stock defines a basic case with a special meaning because it will be the starting point for all
following trend and scenario analysis. Indicating this “Basic Case” may be done with the
letter B when appropriate, for example bs2013|2013|B.
To ensure a close link of monitoring indicators and scenario indicators (e.g. to make possible
an evaluation of the model assumptions by future monitoring activities) the same quantities
as in chapter 2 are applied here. The following table summarises all indicators of basic
building stock data, thermal protection and heat supply in an abbreviated way (explaining the
structure but not showing all details).
Table 8:
State Indicators of the Basic Case
Basic Case (Starting Point of Trend and Scenario Calculation) : Building Stock 2013
Basic Data
Complete building stock Old building stock
bs...2013|2013|B
bs...1980|2013|B
number of buildings
number of apartments
national reference area [m²]
TABULA/EPISCOPE reference area [m²]
Building insulation: state of modernisation
walls
insulation improved (from original state)
insulation improved (area-weighted)
roofs/ground floors/windows: in the same way
Building insulation: Detailed information
levels of wall insulation (area-weigthed):
level 0 (U > 0,7 W/m²K)
level 1 (0,7 W/m²K >= U > 0,3 W/m²K)
level 2 (0,3 W/m²K >= U > 0,20 W/m²K)
level 3 (U <= 0,20 W/m²K )
roofs/ground floors/windows: in the same way
Main Heat Supply Systems for Space Heating
Centralisation of space heating system
district heating
building / apartment heating
room heating
Main energy carrier for space heating
district heating
gas (natural / liquid gas)
.... (and so on: oil, biomass....)
Main heat generation system for space heating
district heating
combustion of fossil fuels: "level 0" systems:
stoves, non-condensing boilers
....(and so on)
Special Systems
solar thermal systems
...(and so on)
(optional): Main Energy carrier for hot water supply
district heating
gas
...(and so on)
(optional:)Main heat generation system for hot water supply
hot water generation combined with heating system:
...(and so on)
percentages related to ....
building number
element area
percentages related to....
element area
percentages related to....
apartment number
percentages related to....
...
...
...
percentages related to....
....
...
...
percentages related to....
... ...
...
percentages related to....
...
percentages related to....
12
Building Stock Energy Performance Indicators
Numbers are given for the complete and the old building stock, whereas indicators of new
buildings are not included in the table because they have more the character of trend than of
state indicators: The modelling of the new buildings is related to construction periods and not
to a certain year, so the related quantities are later considered in 3.2 as trend indicators.
The basic building stock data includes now also the TABULA/EPISCOPE reference area,
which depends on model assumptions so it was not considered in the monitoring indicators
of chapter 2.
The documentation of state indicators is not restricted to the basic case (in the example: the
year 2013), of course. The results of trend and scenario analysis of certain years can be
shown in the same way. Years of special interest like 2020, 2030, 2040 and 2050 which are
in many countries “anchor years” of energy saving and climate protection targets should be
documented in the same way.
In this context it has to be considered that the results do not only depend on the observed
year but also on the scenario in question. It is assumed that each partner will provide a
suitable individual numbering of scenarios (for example S1, S2, …) for a clear documentation
of model calculations.
For illustration the head of the table of state indicators is shown for a hypothetical scenario
S2 in the year 2030:
Table 9:
State Indicators of Scenario S2 observed in the year 2030
Scenario S2: Building Stock 2030
Basic Data
number of buildings
number of apartments
national reference area [m²]
TABULA/EPISCOPE reference area [m²]
Building insulation: state of modernisation
walls
insulation improved (from original state)
...(and so on)
Complete building stock Old building stock
bs...2030|2030|S2
bs...1980|2030|S2
percentages related to ....
building number
...
...
...
3.2 Trend Indicators of building insulation and heat supply
Like the state indicators of chapter 3.1 also the trend indicators of model analysis are defined
in correspondence to the monitoring indicators of chapter 2. In contrast to the state indicators
they are not related to a certain year (2013, 2020, 2030, …) but to the time period in
between. The following example shows the trend indicator table (again abbreviated) for the
first period after the basic year 2013 of scenario S2:
Scenario Indicators
Table 10:
13
Trend Indicators of Scenario S2 for the period 2014-2020
Scenario S2: Trend Indicators of the period 2014-2020
complete building
stock (contructed until old building
2013)
stock
Basic Data
bs...2013|2014-2020|S2
bs...1980|2014-2020|S2
construction and demolition
demolition rates
demolition/ construction of apartments
0,2%/a
0,3 %/a
Building insulation: modernisation trends
walls
mean annual modernisation rates
insulation improved (from original state)
1,2%/a
...
insulation improved (area-weighted)
1,0%/a
...
roofs/ground floors/windows: in the same way
Building insulation: Insulation levels
distribution of modernised elements
levels of wall insulation (area-weigthed):
level 0 (U > 0,7 W/m²K)
0%
level 1 (0,7 W/m²K >= U > 0,3 W/m²K)
20%
...
level 2 (0,3 W/m²K >= U > 0,20 W/m²K)
60%
...
level 3 (U <= 0,20 W/m²K )
20%
...
roofs/ground floors/windows: in the same way
net modernisation
rates
Main energy carrier for space heating
district heating
+0,1 %/a
...
gas (natural / liquid gas)
+ 0,3%/a
...
...(and so on)
....
...
Main heat generation system for space
heating
gross modernisation rates
district heating
0,5/a%
...
combustion of fossil fuels: "level 0" systems:
stoves, non-condensing boilers
0%/a
...
....(and so on)
...
...
Special Systems
solar thermal systems
...(and so on)
remarks
new buildings
bs2014-2020|2014-2020|S2
percentages related to....
apartment number 2013
construction rate
0,8 %/a
percentages related to....
apartment number of bs2013|2013
percentages related to ....
building number in 2013
element area in 2013
distribution of new buildings' elements
percentages related to....
element area
of modernised elements
percentages related to....
apartment number 2013
percentages related to....
apartment number 2013
gross modernisation rates
percentages related to....
1,5%/a
...
...
...
...
annual rates are mean values of the period
percentages related to....
0%
5%
55%
40%
distribution of
energy carriers
15%
65%
...
distribution of
systems
15%
0%
...
application of
systems
35%
...
element area of
new houses' elements
percentages related to....
number of new apartments
percentages related to....
number of new apartments
percentages related to....
...
The left part of the table shows the development of the building stock of the year 2013
(complete and “old” part of the stock). All annual rates are mean values of the period.
Demolition rates are new in this context, but the other quantities are well known from the
monitoring indicator tables of chapter 2. Again it is important to define the reference
quantities of percentage numbers. In the given example annual rates are related to the
building stock of a definite year (here: 2013). This is a convenient definition for scenario
analysis because the volume of existing building stocks (e.g. number of apartments) is
changing by demolition so that relating the modernisation rate to the volume of the building
stock of a fixed year (i.e. to a clearly defined total number of apartments) means that the
annual volume of modernisation measures (e.g.: How many apartments get a new solar
system every year?) can clearly and easily be derived from the documented rates.
For simplification the net changes of the centralisation of the heat supply systems were not
included in the table because the net development (e. g. the net increase or decrease of
district heating systems or room heating systems) can easily be derived from a comparison
of the state indicators of the beginning (2013) and the end (2020) of the period 11. In principle
this applies also to the net development of energy carriers (like gas, oil, …) but here it
appears convenient to see this information which is very important for the development of
CO2 emissions at a glance. Besides, the information of energy carrier distribution in the new
buildings section in the right part of the table has to be documented anyway.
Those new buildings, which were erected in the observed period, are documented in the right
part of the table. In contrast to the existing building stock the development of heating
systems is not described by annual rates but by percentage fractions, which are related to
the total number of new buildings (or here: apartments) of that period. Modernisation of new
houses (erected and modernised in the tabled period, here 2014-2020) can probably be
neglected in the scenarios; at least it is not foreseen to document any numbers in the table.
11
Accordingly also the net development of building insulation and modernisation of heat generation as well as
special systems can be derived for a comparison of the state indicators. So it is valuable additional information
if in the table of trend indicators the gross rates are documented in those cases.
14
Building Stock Energy Performance Indicators
3.3 Energy Balance Indicators
Within the indicator system it is intended to document some basic information of the energy
balance calculations of model and scenario analysis. The related quantities should be
documented at least for the Basic Case (e.g. 2013) and for the anchor years of scenario
analysis (e.g. 2020, 2030, 2040, 2050). For simplification of the harmonised approach it is
assumed that the numbers will be shown for the complete building stock of those years only,
but of course it would be possible to document subsets (e. g. the old building stock) in the
same way, if applicable.
The following table shows (for the basic case as an example) the demand-side energy
balance including the heat demand (energy need) for space heating and domestic hot water
and the heat losses of the distribution and storage systems inside the buildings, altogether
adding up to the total heat demand Qtotal. In addition, the total demand of electric auxiliary
energy (for system control, pumps and fans of the heating and ventilation systems) is shown
as well.
Table 11:
“Demand-side” energy balance: heat demand of space heating and domestic hot water
including distribution and storage losses)
Basic case (bs2013|2013|B): heat and auxiliary energy balance
Heat balance
Qnd,h
Building energy need for heating*
Qd+s,h
heat losses of distribution and storage systems for space heating (qd+s,h=qd,h+qs,h)
Qnd,w
Qd+s,w
energy need for domestic hot water (dhw)
heat losses of distribution and storage systems for dhw (qd+s,w=qd,w+qs,w)
Qtotal
total heat demand for space heating and hot water supply: qtotal = qnd,h+qd+s,h+qnd,w+qd+s
Electric auxiliary energy demand
Qdel,aux
total heat demand for space heating and hot water supply: Qtotal = qtotal*qAC,ref
106 kWh
11600
2700
3200
2900
20400
1350
* heat recovery by ventilation systems is not considered by Q nd,h according to TABULA definition
The energy balance of the heat supply systems is shown on the following page. The
balances of final energy, primary energy and greenhouse gas emissions are shown side by
side in one table to illustrate the principles. Later it will probably be more convenient to show
the numbers one below another in one column in separate tables (so that different columns
can be used for different anchor years or scenarios, for example). From the left to the right
the final energy balance 12, the primary energy balance and the greenhouse gas emissions
are shown 13.
Lines 1 and 2 indicate on the left the final energy demand of district heating (200x106 kWh =
200 GWh) and electricity (500 GWh) delivered to the buildings from district heating systems
or the public electric grid, respectively, for the purpose of heating and domestic hot water
supply 14. In the primary energy balance at the middle of the table district heating and
electricity are not directly considered (because they are not primary energy carriers) but they
are considered by separate columns so that a break-down of fuels and renewables which are
used for district heating an electricity production can be shown (if the information is
available).
12
13
14
The term “final energy” is at least widely similar to the “delivered energy” of prEN 15603 (which is dealing with
the energy performance of buildings, not of building stocks). In the norm it is a matter of (national) definition if
the contribution of renewables is included in the delivered energy balance. In EPISCOPE we include the
renewables but indicate them separately, so that both perspectives are enabled.
It is assumed here that CO2 emissions as well as CO2 equivalent emissions of other greenhouse gases are
included. Details of a harmonised definition of emissions (as well as primary energy) will have to be discussed
among the partners.
Auxiliary energy for heating and ventilation is included; other household appliances are not included in the
volume of electric energy.
10 kWh
6
20
0
10
10
-20
182
142
40
22,0%
100
400
600
-150
19070
16470
2600
13,6%
0
1290
1160
130
10,1%
40
90
100
50
500
200
70
10
22
400
10 kWh
6
80
1500
10 kWh
6
district heating
electricity (public
grid)
10 kWh
6
140
410
610
1610
1772
8180
550
7750
1090
210
-170
20542
17772
2770
13,5%
total primary
energy
-15
4823
66
1540
116
2541
218
46
311
10 kg CO2e
6
related to final
energy
106 kg CO2e
-15
4823
71
1636
116
2558
458
related to primary
energy
Greenhouse gas emissions
Table 12:
1650
7700
550
7700
520
on-site fuels and
renewables
on-site energy
balance
6
primary energy
final energy
10 kWh
1 district heating
200
2 electric energy from the public grid (used for heat supply)
500
fossil fuels / nuclear
3 natural gas
7000
4 liquid gas
500
5 oil
7000
6 coal
500
7 nuclear
biomass
8 wood /biomass
1500
9 - in that: renewable energy
1500
renewables (without biomass)
10 electric energy produced by pv / wind (used for heat supply)
100
11 energy delivered by solar thermal systems
400
12 environmental heat
600
bonus electricity (not used for heat supply but considered in the primary energy or emissions balance)
13 bonus (negative value) of electric energy produced by pv/wind and/or chp (if applicable)
14 total energy demand / total emissions: sum of above lines 1-13 (excluding line 9)
18300
15 non-renewable energy demand (including dh and el,publ): line 14 - line 16
15700
16 renewable energy demand: sum of lines 9-12
2600
17 fraction of renewables: line 16/ line 14
14,2%
18 demand of energy carriers: sum of lines 1 - 8
17200
remarks:
auxiliary electric energy for control, pumps, fans of heat supply and ventilation systems is included
fuel demand is indicated by the gross calorific value
Basic case (bs...2013|2013|B): Primary energy / end energy / emissions
Scenario Indicators
“Supply-side” energy balance: Final energy / Primary energy / Emissions
15
16
Building Stock Energy Performance Indicators
Lines 3 to 8 show the consumption of fuels in the buildings (final energy balance) and the
related primary energy demand (left column of primary energy balance). The fuel
consumption for district heating and electricity generation can be documented in the next two
columns of the primary energy balance. The amount of primary energy consumption must
correspond to the amounts of district heat (200 GWh) and electricity (500 GWh), which are
indicated in the final energy column 15. At the end the sum of all primary energy carriers used
for the heat supply of residential buildings is shown. It is the sum of the primary energy
carriers, which are applied on-site or in the district heating systems or for electric energy
supply.
It might be the case that project partners do not operate with detailed models of district
heating and electricity supply. In such a case the break down of different primary energy
carriers cannot be given for district heating and electricity. Nevertheless, comprehensive
primary energy factors will have to be applied so that at least the total primary energy
demand of district heating and electricity (bold numbers in line 14, here: 182 and 1290 GWh)
can be documented.
According to the TABULA definition (and also to the approach of draft prEN 15603, May
2013) always the gross calorific value is applied to measure the fuel energy demand (at the
level of final energy as well as primary energy) 16. In case of biomass the renewable part of
energy demand is indicated separately in line 9, so that at the end (in lines 16 and 17) the
renewable fraction of end and primary energy can be calculated.
Lines 10 to 12 indicate the section of renewable energy (excluding biomass) of the end and
primary energy consumption. It is assumed that the definition of counting 1 kWh of electric
energy from photovoltaics or wind engines as 1 kWh of final energy and 1 kWh of primary
energy at the same time is common for all partners. The same applies to 1 kWh thermal
energy from solar thermal systems or 1 kWh environmental energy (heat extracted from the
environment by heat pumps).
In line 10 only electric energy, which is directly used for the heat supply (e.g. feeding electric
heat pumps or supplying auxiliary energy), may be considered 17. Further electric energy
which is used for other purposes (on-site or in the public grid) is not considered or – in case
that the applied energy balance method includes a bonus system for that kind of external
effects – this has to be indicated in line 13 in the primary energy or emission balance 18. Such
bonus values of primary energy or emissions are listed as a negative primary energy
demand or negative emissions.
To give an example for a single building: If there is a photovoltaic system producing electric
energy the applied energy balance method might include an algorithm to calculate the
fraction of that electric energy which can be used for the heat supply of the building (e.g. if
there is an electric heat pump or for auxiliary energy use). If so, this amount should be listed
in line 10 (there: not for a single building but for the complete building stock, of course).
On the other hand it might be the case that the applied method defines a bonus system,
which means that the electricity produced by the PV system can be considered in the energy
15
16
17
18
In the example 1290 GWh of primary energy are necessary to produce 500 GWh of electric energy.
This is at least the starting point of the concept. Problems might occur, if national energy balances are mostly
related to the net calorific value. In this case a change of the concept might be discussed among the partners.
So the partners should be prepared to provide the opportunity of switching between the gross and the net
calorific values.
Concerning the column “final energy” the following has to be considered: In line 10 of that column only the
amount of electric energy may be counted which is not already included in line 2 (electric grid). So line 10 of
the column “final energy” applies typically for “on-site” and “nearby” produced electricity from renewable
sources (e.g. PV on the roofs) which is applied for heat supply. But keeping in mind that we are talking about
large (sometimes national) building stocks, it may also include “distant” generation of electricity from
renewables which is assigned to heat supply and not already included in line 2 (see the definition of “on-site”,
“nearby” and “distant” in prEn 15603, May 2013).
It is assumed here that such bonuses are only defined at the level of primary energy demand and greenhouse
gas emissions, not at the level of final energy demand. If this does not apply to all partners, please tell us.
Scenario Indicators
17
balance of heat supply by negative values of primary energy or emissions. In this case the
primary energy bonus, which is related to on-site photovoltaic systems, should be indicated
in the first column “on-site fuels and renewables” of the primary energy balance in line 13
and line 10 should be kept empty.
Of course, also a combination of both methods could be documented, if applicable (so that
numbers unequal to zero may appear in line 10 as well as in line 13). But if the applied
method does not provide any rules for considering photovoltaic systems both lines should be
kept empty.
The situation is even more complicated in case of chp systems (cogeneration, combined
heat and power systems). In those systems the input of fuel (e. g. gas) is used for the
generation of two products (heat and electric energy) at the same time. So the question is
again how the fraction of final energy demand, the primary energy demand and emissions,
which are assigned to building heat supply (and not to power generation for the public grid),
can be calculated and indicated. Different methods exist and later in the project we will have
to discuss how we can classify and indicate them to reach a satisfactory level of
transparency. For the moment in the given table the following rules apply:
-
-
If the applied method defines a split of fuel input to both products (heat and power) only
the fraction of fuel demand which is assigned to heat production (for residential buildings)
should be considered in the final energy, primary energy and emission balance (e. g. in
line 3, if natural gas is used). If however a part of the electric power is also assigned to
the heat supply of the residential buildings (e.g. directly feeding electric heat pumps or
used for auxiliary energy) the corresponding part of fuel input should also be considered
in line 3. In such a case the electric energy is only an interim product (on the way from
gas to heat) and for that reason– in contrast to electric power from PV in line 10 (which
represents the input of external solar energy to the heat supply system) - it is not
considered separately.
If on the other hand the electric energy produced by chp plants is considered by a bonus
method the corresponding (negative) bonus values can be considered in line 13 (together
with the bonus of PV/wind systems). In that case the complete fuel demand of chp
systems (used for heat and power production) has to be indicated in the respective lines
at the level of final energy, primary energy and emissions (e.g. line 3 in case of gas use).
At the right of the table the greenhouse gas emissions are indicated. As far as possible a
harmonised definition should be found so that everybody is talking about the same quantity
(for example: greenhouse gas emission of CO2 and all other greenhouse gases (counted as
CO2-equivalents) related to the consumption of energy carriers, including emissions inside
the country and emissions related to the exploitation of the energy carriers in other countries,
emissions of producing heat generation system and building/insulation materials are not
included).
In principle, a detailed approach of four columns as for primary energy would be possible but
here for simplification only two columns are introduced: The first showing the emissions
related to final energy consumption, the second showing the emissions related to fuel
consumption. The sum is the same because it is a breakdown of the same amount of total
emissions in two different ways.
Also a comparison of the final energy balance of the basic case according to the above table
with actual energy consumption values according to table M.4 will have to be given, maybe
resulting in adaptations of the calculation method to attain more realistic results. It can be
assumed that a direct comparison of both tables will often not be possible (e.g. the observed
values of M.4 might not deliver a separation of electricity consumption for heating purposes
(as in the above table) and other household appliances, or a weather/climate correction of
the M.4 values might have to be carried out). So a fixed scheme for carrying out the
comparison cannot be given here, model calculations will have to be carried out (and
documented) by the partners in an individually suitable way.
18
Building Stock Energy Performance Indicators
3.4 Summary Indicators
The indicator scheme documented in the chapters 2 and 3.1 - 3.3 aims at finding a common
approach of data presentation to make possible comparisons of monitoring data as well as
basic assumptions and results of model and scenario calculations between different projects
in different countries. Although an attempt was made to reduce the number of indicators to a
basic set (providing the information which is necessary to draw a transparent picture of the
observed building stocks) the resulting scheme is quite complex and on an “expert level”.
In addition there should be a way of presenting some basic results of the building stock
analysis in a much easier way which is meaningful also for “non-experts” or those who do not
have the opportunity for getting into details. Also the comparison of the scenario results with
target values (e. g. of example greenhouse gas reduction) has to be considered here.
In the project enough time should be taken to find a suitable way of presenting that kind of
basic information – last not least an as far as possible self-explanatory display of graphs and
diagrams should be developed for the project reports and the project website.
At the moment as a first step a basic set of summary indicators should be discovered. A
preliminary approach which has to be concretised in the course of the project is described
here:
•
The development of total greenhouse gas emissions is of central importance and
probably it will the most important “summary indicator”. In contrast to Table 12, the arearelated value “mGHG,total“ (related to the common TABULA/EPISCOPE reference area ARef)
should be documented to ensure a better comparability of different building stocks 19.
•
A clear and simple way of documenting the different contributions to greenhouse gas
reduction by energy saving measures at the buildings on one hand and measures of
efficient and renewable heat generation on the other hand is provided by the following
equation:
mGHG,total = qtotal x fGHG,gen with:
mGHG,total: Total greenhouse gas emissions of the buildings stock (related to ARef),
see above
qtotal:
Total heat demand (see Table 11), related to ARef: qtotal=Qtotal/ARef
fGHG,total: Total greenhouse gas emission factor of heat generation
So the documentation and illustration of those three quantities for the Basic Case and the
observed scenarios can provide basic information of the development of emission
reduction and at the same time of the role of both building-related measures as well as
heat generation systems. Also other approaches would in principle be possible, e.g.
taking the total demand of final energy as a reference point (instead of qtotal). But in this
case assessment problems related to CHP or other bonus systems would be included in
the “building-related” quantity. Against that background qtotal appears to be a clearer or
“more objective” choice.
•
19
Also the national and international targets of energy saving and emission reduction in the
building stock should be documented and compared for different years. Besides the
greenhouse gas emissions also other quantities may be important. On EU level the
20/20/20 targets for the year 2020 are of interest: Besides a 20 % greenhouse gas
reduction also a 20 % fraction of renewables and a 20 % reduction of energy
consumption are considered. A basis for providing the necessary data in the project is
delivered by the energy balance indicators of chapter 3.3: The fraction of renewables is
documented on the primary and final energy level, the reduction of energy demand can
be followed on the level of heat demand, final energy demand and primary energy
demand (total or only non-renewable), respectively. One of the project’s tasks will be to
In Table 12 area-related values are not considered because they cannot be clearly defined or would probably
be puzzling because of the split of different energy carriers in the building stock.
Scenario Indicators
19
select those among the different options, which are best suited for a harmonised
presentation of the results. Also the aim of a clear and equal definition of the quantities
will have to be kept in mind.
•
On the other hand, there might be limits of harmonisation: Different target quantities
might be common in the participating countries. For example in one country the reduction
of energy consumption is measured by final energy, in another country by primary
energy. Also the target values will be different: The 20/20/20 targets can give a rough
orientation for international comparison in 2020 but in fact they are average values of the
whole EU and so they can not be directly transferred to single countries (or regional
building stocks). So apart from the intrinsic indicators (energy demand, emissions) also
more general approaches to measure the extent of target-keeping. In this context the
relation of the achieved and the desired values might be the suitable point of view. For
example, it could be indicated that in pilot project A the trend scenarios result in
exceeding the target values of energy demand in 2020 by 20 %, whereas in pilot project
B an overstepping of only 10 % is expected by trend analysis.
•
Even if probably not considered by official international target systems the quality of
building insulation in a building stock is a question of special interest, which should be
considered separately. A comparison could be carried out on the basis of the heat
demand qnd,h (see Table 11, qnd,h = Qnd,h / ARef) 20 or on the basis of a mean U-value (heat
transfer coefficient) of all building elements and all buildings in the observed building
stock, for example. A common reference value for international comparison might be the
quasi ideal “passive house level” (proposed by Bill Sheldrick) 21.
•
Apart from energy balance indicators also structural indicators should be considered as
summary indicators, because they are less dependent from model assumptions and
could be more directly checked by later monitoring activities. In the case of building
insulation the achieved progress of modernising the thermal envelope of the buildings is
of special interest (also for interested persons which are less familiar with energy or
emission quantities). Based on Table 2 (M 2.1) at page 5 which defines the progress for
each of the elements (walls, roofs,…) separately, for the summary indicator an areaweighted value of all building elements can be defined to indicate the total average
progress of improving building insulation. For example, a value of 40 % would indicate
that 40 % of the total “thermal envelope” area of the building stock (= total area of all
walls, roofs, windows, cellar ceilings) will have been modernised by insulation until a
certain year according to scenario assumptions. Accordingly a modernisation rate of
2 %/a means that 2 % of the total element area are insulated every year in the observed
period.
It should be checked if also structural summary indicators for heat generation systems
can be defined. The fraction of buildings with solar systems installed might be an
example. Concerning the main heat generation systems there is the question how a
comprehensive and illustrative approach might look like will have to be discussed: For
example, defining an easy classification scheme of system quality (e. g. level 1:“old,
inefficient and/or very CO2-intensive”, level 2: “standard”, level 3 “forward-looking, very
efficient, low CO2 emissions”) might be a solution, if comparable approaches can be
identified by the participating partners 22.
20
21
22
This is not far away from observing qtotal which is carried out anyway (see above), but qtotal also includes the
heat demand for hot water and the heat losses of distribution and storage within the building, so that it is not
directly related to building insulation.
If the comparison is based on the energy demand of space heating it will have to be discussed if for that
purpose not qnd,h (which is a gross value not considering contributions of ventilation heat recovery) but better
the net value qnd,h,net = (qnd,h – heat recovery from ventilation) should be considered because heat recovery is a
part of the passive house concept.
The given example would be even more generalised and simplifying than the similar system proposed in
chapter 2.3 (Table 4, M 3.1.3) because it would not only be restricted to fuel driven but to all heat generation
systems. On the other hand generalisation will probably be necessary for a global “summary indicator”.
© Copyright 2026 Paperzz