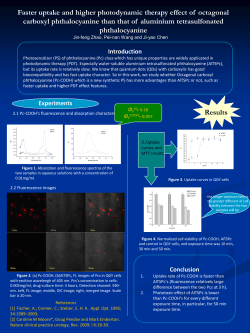
Nitrogen uptake rate with compost application and its effect on the sugar
content of sweet corn (Zea mays L.)
Masako TakebeA, Keiki OkazakiB, Norikuni OkaB, Toshihiko KarasawaA and Michio KomadaA
A
National Agricultural Research Center, Tsukuba, Ibaraki, Japan, Email [email protected]
National Agricultural Research Center for Hokkaido region, Sapporo, Hokkaido, Japan, Email [email protected]
B
Abstract
A series of field experiments was conducted to test whether nitrogen (N) similarly affected crop quality
when supplied in compost or in chemical fertilizer. N was supplied to sweet corn via either compost or
chemical fertilizer, and soil nitrate-N, N uptake and the sugar content of sweet corn were investigated. Soil
nitrate-N integrated from the date of application to harvest and the amount of N uptake by sweet corn were
positively correlated irrespective of the N source. This finding may indicate that the amount of N uptake was
determined primarily by the amount of nitrate-N supplied by the compost in addition to the chemical
fertilizer. The growth of early stage was accelerated by the application of compost, and the date of maximum
sugar content became earlier with increased compost application. The relationship between sugar content and
N uptake was the same irrespective of the N source when compared at the time of maximum sugar content
for each treatment. So we concluded that the sugar content was determined by the amount of N uptake
regardless of the N source (compost application or chemical fertilizer application).
Key Words
Compost, crop quality, nitrogen uptake, soil nitrate nitrogen, sugar content, sweet corn
Introduction
The effect of organic matter application on crop quality has been discussed from various perspectives.
However, if the amount of N applied to crops via compost or chemical fertilizer is equal, it remains unclear
whether the effect on the crop quality is the same. We conducted a series of field experiments to test whether
N supplied as compost or as chemical fertilizer similarly affected the sugar content of sweet corn. First, the
nitrate-N releasing patterns from applied compost and from chemical fertilizer in the soil (0-15 cm) were
compared, and it was discussed whether the amount of N uptake was explained by the amount of N released
during the growing season. It was then examined whether crop quality was determined by the amount of N
uptake regardless of the N source.
Methods
Experiment 1
Field experiments were conducted in the fields of the National Agricultural Research Center for Hokkaido
region in Sapporo from 2006 to 2007 (Takebe et al., 2010). The soil type in the fields is Melanaquands.
Sweet corn (variety: Ohisamacorn) was supplied with N in the form of compost or chemical fertilizer. Cow
compost (C/N=8.4-10.4, N=28-32 g kg-1 DW) was applied at rates of 0, 2, 4 kg m-2 and chemical fertilizer N
was applied as ammonium sulfate at rates of 0 and 12 g N m-2 at each compost level. The grain was sampled
once in 2006 and 3 times in 2007 at the harvest stage, and sugar content was analysed by the enzymatic
method.
Experiment 2
A field experiment was conducted at Yawara experimental station of the National Agricultural Research
Center in Ibaraki on 2008. The soil in the field is classified as an Andisol (Hydric Hapludand) according to
the USDA soil classification system. Sweet corn (variety: Petercorn) was cultivated in plots treated with
swine compost (N=44 g kg-1 dry matter) only, polyolefin-coated urea only for N, ammonium sulfate only for
N, and no fertilizer, every plots treated identically for 15 years. The chemical fertilizers were applied at rate
of 16 g N m-2 and swine compost was applied at rate of 32 g N m-2 according as the estimated mineralization
rate (50 %) (Maeda et al., 2008). After 15 years, the available P (Truog-P) became high level (524 mg kg-1
dry soil) in the plot of swine compost compared with that in the chemical fertilizers (43-47 mg kg-1 dry soil).
The grain was sampled 4 times at the harvest stage, and sugar content was analysed by the enzymatic method.
Results
In experiment 1, soil nitrate-N increased slowly from the date of compost application in the plots that
© 2010 19th World Congress of Soil Science, Soil Solutions for a Changing World
1 – 6 August 2010, Brisbane, Australia. Published on DVD.
210
received only compost, but increased rapidly after the application of chemical fertilizers. In a bare fallow
area, the average value of soil nitrate-N (in the plow layer) throughout the plant growing season was 22 mg
kg–1 dry soil in the plot treated with 4 kg m–2 compost, 40 mg kg–1 dry soil in the plot treated with 12 g N m–2
chemical fertilizer, and 51 mg kg–1 dry soil in the plot treated with 4 kg m–2 compost + 12 g N m–2 chemical
fertilizer (Figure 1). Soil nitrate-N was integrated and divided by the number of days from the date of
application to harvest and compared with the amount of N uptake by sweet corn; these quantities were
positively correlated irrespective of the N source (Figure 2). This may indicate that the amount of N uptake
was determined primarily by the amount of nitrate-N supplied by the compost in addition to chemical
fertilizer.
il 80
o
s 70
yr 60
d
-1 g 50
k 40
g
m30
N
-3 20
O10
N
0
M0
M0
M4
M4
rp
A
6
2
ya
M
4
2
ya
M
0
1
n
u
J
7
n
u
J
1
2
l
u
J
5
l
u
J
9
1
g
u
A
2
N0
N12
N0
N12
g
u
A
6
1
Figure 1. Change of nitrate-N in the soil (bare fallow area). “M0 N0” means that 0 kg m-2 of compost and 0 g N
m-2 of chemical fertilizer was applied to the plot. Bars represent the standard deviation.
2-
18
m16
g 14
ek 12
at 10
pu
ne 8
go 6
rti 4
N2
0
M0 N0
M2 N0
M4 N0
0
10
20
M0 N12
M2 N12
M4 N12
30
40
50
-1
Soil nitrate N mg kg dry soil
Figure 2. Relation between nitrate-N (integrated and divided by the number of days of compost application to
harvest) in a bare fallow area and N uptake of sweet corn. “M0 N0” means that 0 kg m-2 of compost and 0 g N m2
of chemical fertilizer were applied to the plot. The relationship between nitrate-N and N uptake is significant
(n=18, r=0.885, p<0.01).
The sugar content of sweet corn decreased with increased N uptake. Plant products of all plots were
harvested on the same day; those products that had received compost as the N source had lower sugar
content than those that received chemical fertilizer only, even though their N uptake was the same (Figure 3).
However, it would be better to compare the sugar content at the suitable harvest time, which is the time when
the grain had the highest sugar content for sweet corn. The growth of early stage was accelerated by the
application of compost, and the acceleration would be dependent on the phosphorus supply from the compost
in early spring (Figure 4). As a result, the date of maximum sugar content became earlier with increased
compost application. The relationship between sugar content and N uptake was the same irrespective of the
N source when compared at the suitable harvest time for each treatment (Figure 5). We concluded that the
sugar content was determined by the amount of N uptake regardless of the N source (compost application or
chemical fertilizer application).
© 2010 19th World Congress of Soil Science, Soil Solutions for a Changing World
1 – 6 August 2010, Brisbane, Australia. Published on DVD.
211
160
W
F140
-1
gk 120
g 100
tn
et 80
no
c 60
ra 40
gu
S 20
2006
2006
2007
2007
0
0
M0
M2,M4
M0
M2,M4
5
10
15
Nitrogen uptake g m-2
20
Figure 3. Relationship between sugar content and N uptake of sweet corn (comparison at same harvest day).
“M0” means that 0 kg m-2 of compost was applied to the plot. The difference between compost application (M2,
M4) and non-application (M0) is significant by the analysis of covariance.
50
2
-
W
m 1- D40
g gk
re 30
tta gN
m -la 20
yr to
D T10
5
0
0
4
3
1-
2
1
N0 N12
N0 N12
M0
M2
W
D
gk
g
P
dry matter
P
Total-N
N0 N12
M4
Figure 4. Dry matter, Total-N, and P contents of sweet corn in the early growing stage (June 26, 2007). “M0” and
“N0” mean that 0 kg m-2 of compost and 0 g N m-2 of chemical fertilizer were applied to the plot, respectively.
Bars represent the standard deviation.
160
W
1F
- 140
gk
g 120
tn
et
no 100
c
ra
gu 80
S
M0
M2
M4
60
0
5
10
15
Nitrogen uptake g m-2
20
Figure 5. Relationship between sugar content and nitrogen uptake of sweet corn (at the time of maximum sugar
content for each treatment, 2007). “M0” means that 0 kg m-2 of compost was applied to the plot. The difference
between compost application (M2, M4) and non-application (M0) is not significant by the analysis of
covariance.
In Experiment 2, sweet corn in the plot treated with compost arrived at the silking stage earlier than the plot
treated with chemical fertilizers, and the sugar content reached the maximum value on July 30 in the plot
with compost and on August 5 in the plots with chemical fertilizers (Figure 6). The acceleration of growth
with the compost would be dependent on the phosphorous supply, just as it was in experiment 1. The
maximum values of the sugar content were almost the same among the different plots, so it is considered that
the sugar content would not be influenced by whether the N source was compost or chemical fertilizer.
© 2010 19th World Congress of Soil Science, Soil Solutions for a Changing World
1 – 6 August 2010, Brisbane, Australia. Published on DVD.
212
The sugar content increased with increased dry matter rate until it became about 0.24 kg kg-1 (Figure 7). The
sugar content also increased with the number of days after the silking stage up to 17-18 days, then decreased
(Figure 8). The sugar content was related more clearly with the dry matter rate when in the increasing stage
and was related more clearly with the number of days after the silking stage when in the decreasing stage. It
is considered that the sugar content of sweet corn increased with the accumulation of dry matter in grain,
then decreased with the change from sugar to carbohydrate.
120
W
F 100
1
gk 80
g
tn
et 60
no
c 40
ra
gu
S 20
0
swine compost
polyorefin-coated urea
ammonium sulfate
no fertilizer
23-Jul
30-Jul
6-Aug
13-Aug
Figure 6. Change of sugar content of sweet corn (Yawara field).
120
tn 100
et W 80
no 1 F
c - g 60
arg kg
uS 40
swine compost
polyorefin-coated urea
ammonium sulfate
no fertilizer
20
0
0.10
0.15
0.20
0.25
0.30
Dry matter rate kg kg-1
Figure 7. Relation between sugar content and dry matter rate of grain.
120
tn 100
80
ten W
oc 1- F
g
ra k 60
gu g 40
S
swine compost
polyorefin-coated urea
ammonium sulfate
no fertilizer
20
0
5
10
15
20
25
30
35
days after silking stage
Figure 8. Relation between sugar content and days after silking stage.
Conclusion
The amount of N uptake was determined primarily by the amount of nitrate N supplied by the compost in
addition to chemical fertilizer. The sugar content was determined by the amount of nitrogen uptake
regardless of the N source, and would not be influenced by whether the N source was compost or chemical
fertilizer. The sugar content increased with increased dry matter rate until it became about 0.24 kg kg-1, then
decreased with the number of days after the silking stage.
References
Takebe M, Okazaki K, Oka N, Karasawa T (2010) Nitrogen uptake rate with compost application and its
effect on the quality of Japanese radish (Raphanus sativus L.) and sweet corn (Zea mays L.). Japanese
Journal of Soil Science and Plant Nutrition 81, 23-30.
Maeda M, Ihara H, Ota T (2008) Deep-soil adsorption of nitrate in a Japanese andisol in response to different
nitrogen sources. Soil & Water Management & conservation 72, 702-710.
© 2010 19th World Congress of Soil Science, Soil Solutions for a Changing World
1 – 6 August 2010, Brisbane, Australia. Published on DVD.
213
© Copyright 2026 Paperzz