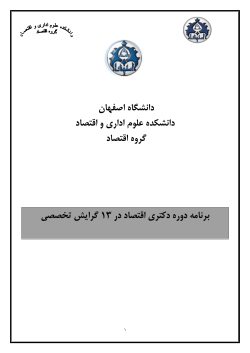
The monetary policy landscape in a financial crisis Governor Stefan Ingves Images from the speech at Swedish Economic Association, 31 March 2009 Image 2: Current account deficit as percentage of GDP 12 12 Kina 10 10 Sverige 8 8 USA 6 6 4 4 2 2 0 0 -2 -2 -4 -4 -6 -6 -8 -8 -10 -10 95 98 01 04 07 Källa: IMF Image 3: Credit spreads* for corporate bonds in the USA Basis points 2200 2000 1800 Aaa Baa High-yield 1600 1400 1200 1000 800 600 400 200 0 2000 2001 2002 2003 2004 2005 2006 2007 2008 2009 *The difference between the yield on corporate bonds and the yield on treasury bonds. Source: Reuters Ecowin Image 4: Monetary policy and financial stability are interlinked i lending t it mct ,... Image 5: Unconventional monetary policy A stylised balance sheet for a central bank Assets Liabilities Foreign assets Banknotes and coins Domestic assets Bank deposits Lending Equity Image 6: Central banks’ balance sheets Percentage of GDP 25 25 ECB BOE 20 20 Federal Reserve Riksbanken 15 15 10 10 5 5 0 jan-07 0 apr-07 jul-07 okt-07 jan-08 apr-08 jul-08 okt-08 jan-09 Sources: Bureau of Economic Analysis, Eurostat, Office for National Statistics, SCB and the respective central banks Image 7a: The Riksbank’s balance sheet 30 June 2008 (before Lehman Brothers) Assets Gold Currency reserve Liabilities 26 Banknotes & coins 108 158 Fine tuning 0 0 Riksbank certificates 0 Lending SEK 4 Debt to Fed 0 Other 4 Equity 59 Other 25 Lending USD TOTAL 192 TOTAL 192 Image 7b: The Riksbank’s balance sheet 31 December 2008 (after Lehman Brothers) Assets Gold Liabilities 30 Banknotes & coins 112 Currency reserve 200 Fine tuning 207 Lending USD 196 Riksbank certifikates 49 262 Debt to Fed 189 Lending SEK Other TOTAL 7 Equity 59 Other 84 700 TOTAL 700 Image 8: Quantity equation M V P Y Image 9: Taylor rule for monetary policy it t r t Y Yt Y * t * Image 10: A ”Taylor rule” for capital adequacy ct c L Lt L Y Yt Y * Image 11 i lending t it mct ,...
© Copyright 2026 Paperzz