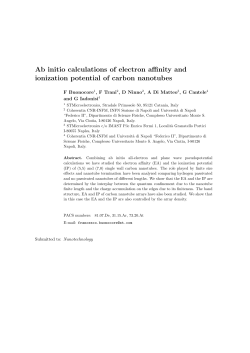
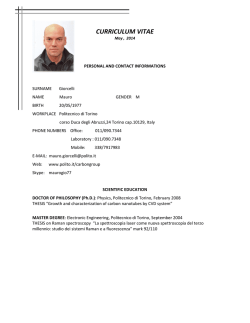
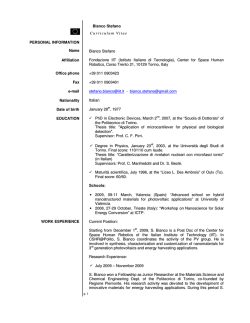
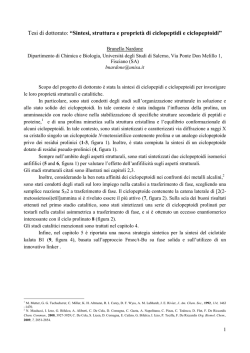
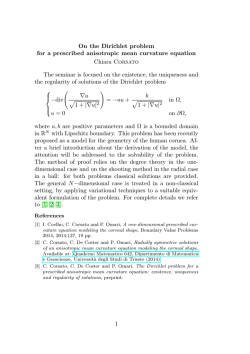
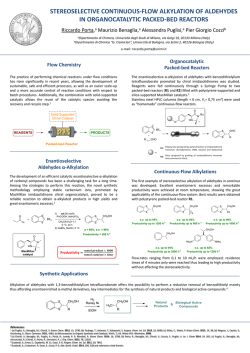
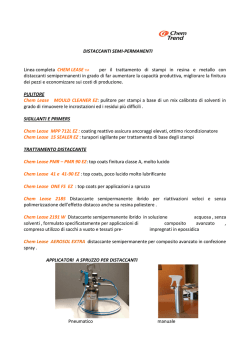
CHEMPHYSCHEM
ARTICLES
DOI: 10.1002/cphc.201300292
Stable Aqueous Solutions of Naked Titanate Nanotubes
Lucio Zennaro,[b] Massimiliano Magro,[c] Fabio Vianello,[c] Adelio Rigo,[b] Gino Mariotto,[d]
Marco Giarola,[d] Elena Froner,[a] and Marina Scarpa*[a]
Aqueous solutions of naked nanotubes with Ti concentration
up to 10 mm are obtained by hydrothermal synthesis followed
by extensive ultrasound treatment. The morphology, surface
characteristics, and solution behavior of the solubilized nanotubes are investigated. The time course of the solubilization
process driven by ultrasound follows a first-order kinetic law
and is mediated by the competition between Na + and H + for
surface sites. The dynamics of interaction with small cations
(i.e. the sodium ion) is studied by nuclear magnetic resonance
spectroscopy and is demonstrated to be a multifaced process,
since Na + is in part free to exchange between the binding
sites on nanotubes and the bulk and in part is confined to
slowly exchanging nanotube sites. The aqueous titanate nanotube solutions are stable for months, thus opening new perspectives for the use of this material in drug delivery and in
homogeneous photocatalysis.
1. Introduction
Nanotubes derived from TiO2 are attracting increasing interest
because of their characteristic properties, such as a high
aspect ratio, the mildly reactive nature of their surface, and the
semiconductor bandgap that can be tuned from the UV to the
visible range.[1] Accordingly, after the pioneering work of
Hoyer,[2] the rate of publication of papers and patents dealing
with titanate nanotubes has been continuously increasing.[3, 4]
The current research activities are mainly aimed at understanding the physical and chemical features of titanate nanotubes.
However, titanate nanotubes can also find versatile applications and the exploitation of this outstanding material in the
biomedical, photochemical, electrical, and environmental fields
appears promising.[5] Recently, two topics have emerged: titanate nanotubes as an efficient system for environmental depollution[6] and titanate nanotubes as a biomedical tool.[7, 8] Titanium oxide is in fact an excellent photocatalyst. In particular,
it oxidizes toxic organic compounds on addition to contaminated water and illumination by mild UV light. This is a clean
[a] Dr. E. Froner, Prof. M. Scarpa
Dipartimento di Fisica
Universit di Trento and Istituto Nazionale di Biostrutture e Biosistemi
via Sommarive 14, 38123 Povo Trento (Italy)
Fax: (+ 39) 0461282967
E-mail: [email protected]
[b] Prof. L. Zennaro, Prof. A. Rigo
Dipartimento di Medicina Molecolare
Universit di Padova and Istituto Nazionale di Biostrutture e Biosistemi
via G. Colombo 3, 35100 Padova (Italy)
[c] Dr. M. Magro, Prof. F. Vianello
Dipartimento di Biomedicina Comparata ed Alimentazione
Universit di Padova
via G. Colombo 3, 35100 Padova (Italy)
[d] Prof. G. Mariotto, Dr. M. Giarola
Dipartimento di Informatica
Universit di Verona
Strada le Grazie 15, 37134 Verona (Italy)
Supporting information for this article is available on the WWW under
http://dx.doi.org/10.1002/cphc.201300292.
2013 Wiley-VCH Verlag GmbH & Co. KGaA, Weinheim
process for contaminant removal since, besides atmospheric
oxygen, no other reagent is needed for the reaction to proceed.[9] Nanostructuration of titanium oxides enhances the
photocatalytic efficiency and titanate nanotubes suitably
doped can also be excited in the visible range.[10–14] Biomedical
applications of titanates are encouraged by the low toxicity of
titanium and titanium alloys, which are traditionally used for
bone implants and prosthesis coatings. Titanate nanotube surfaces offer advantages compared with flat TiO2 surfaces, since
cell adhesion is favored and processes such as bone growth
are stimulated.[15] Finally, the capsule-shaped geometry of
nanotubes suggests their use as drug-delivery vehicles and
imaging enhancers.[16, 17]
Up to now the majority of the experimental proofs of the titanate nanotube performances have been obtained by using
titanate nanotube assemblies, or layers or powders dispersed
in solvents. Titanate nanotubes are usually synthesized by electrochemical anodization,[18] template-assisted electrochemical
deposition,[2] atomic layer deposition,[19] the sol–gel technique,[20] or hydro/solvothermal synthesis.[3, 21] Ordered layers or
powders obtained by means of these synthesis methods are
practically insoluble in water (a solubility of 0.2 mg L1 has
been reported).[22] These titanate nanotube phases, in particular the ordered solid titanate nanotube structures, show exceptional features for some applications (such as for solar cells,
heterogeneous catalysis, filtration devices). However, in some
cases a great advantage will be obtained by the homogeneous
dispersion of the titanate nanotubes in the aqueous environment, for example, if titanate nanotubes are used for drug delivery into the systemic circulation or for homogeneous catalysis. High water solubility is essential for the successful exploitation of titanate nanotubes in water depollution, in which optimum photocatalytic performances, such as absence of light
scattering effects, are necessary. Conversely, these effects are
reported to be quite high in titanate aqueous suspensions.
Functionalization processes have been proposed to overcome
ChemPhysChem 2013, 14, 2786 – 2792
2786
CHEMPHYSCHEM
ARTICLES
www.chemphyschem.org
this drawback.[23, 24] However, the organic coating can introduce
unwanted changes of the titanate nanotube dimensions and
properties. Moreover, the organic coating itself can be degraded during titanate photocatalysis whereas biomedical applications necessitate that the surface reactive groups of titanate
nanotubes (namely hydroxyl groups) are preserved to bind
bioactive agents, such as targeting molecules or growth factors. Finally, in view of large-scale utilization of the titanate
nanotubes, expensive coating procedures performed only to
solubilize the starting nanomaterial should be avoided. Therefore, preparation and utilization of concentrated, highly active,
and clear titanate nanotube aqueous solutions might be helpFigure 1. Absorbance of titanate nanotube solutions at various times of ulful in solving some of the above-mentioned problems.
trasound treatment. The titanate nanotubes, suspended in distilled water,
Herein, we report a simple procedure of hydrothermal synunderwent ultrasound treatment at 400 W and 65 8C. Solid line: first-order
fitting (k = (1.7 0.3) 103 min1).
thesis of titanate nanotubes followed by ultrasound treatment,
which permits stable and concentrated titanate nanotube
aqueous solutions to be obtained. As far as we know it is
the first time that stable solutions of naked titanate nanotubes have been prepared. Morphological characterization of
these soluble titanate nanotubes
has been performed. The relationships between solubility,
structure, and the solvent-exFigure 2. TEM images of titanate nanotubes. Nanotubes before (A) and after (B) ultrasound treatment. C) Typical
posed interface, that is, the pres- open-ended nanotube after sonication. A small drop of a dilute solution of nanotubes was deposited on the Cu
ence of surface sites at which grid.
Na + ions are confined, have
been investigated by means of
optical and vibrational spectroscopies and by solution nuclear
croscopy (TEM) images clearly show nanotubular-shaped strucmagnetic resonance spectroscopy.
tures (see Figure 2), so we designate them as titanate nanotubes. Sonication may fracture some of the titanate nanotubes
along their length. However, according to the TEM images the
nanotubes deposited from the clear solutions were on average
2. Results and Discussion
200 nm long, as shown by the length distribution reported in
2.1. Dynamics of the Solubilization Process
Figure 3.
More than 80 % of the washed and dried titanate nanostrucThe ultrasound treatment was also carried out in the prestures was brought into solution by extensive ultrasound treatence of 1 mm NaCl, or 1 mm NaCl plus 1 mm NaOH, or 1 mm
ment in distilled water. The final solutions so obtained were
NaCl plus 1 mm HCl. Although NaCl alone did not induce efcharacterized by a pH value close to neutrality and an electrical
fects on the rate of solubilization (k = 1.52 103 min1), the adconductivity of less than 20 mS.
The trend over time of the solubilization process of the titanate powder assisted by ultrasound was monitored by the absorbance increase at 245 nm and is shown in Figure 1. At this
wavelength the absorbance reaches a maximum. The absorbance increase was fitted satisfactorily to a first-order kinetic law
and a kinetic rate constant of (1.7 0.3) 103 min1 was calculated. The titanium content in the final solutions was measured
according to the procedure reported in the Experimental Section and was found to be as high as 100 mm TiO2. In some
cases the clear solutions were lyophilized and all the dry material was brought again into solution by sonication in distilled
water. This second solubilization process followed a first-order
kinetic law, but in this case the process was faster (the rate
Figure 3. Length distribution of titanate nanotubes present in solution after
constant was (5.5 0.7) 103 min1). Transmission electron mi2400 min of ultrasound treatment.
2013 Wiley-VCH Verlag GmbH & Co. KGaA, Weinheim
ChemPhysChem 2013, 14, 2786 – 2792
2787
CHEMPHYSCHEM
ARTICLES
dition of NaCl plus NaOH increased the rate by about five
times (k = 10.4 103 min1). Conversely, the addition of HCl
decreased the initial rate of solubilization by about one order
of magnitude. This behavior suggests that Na + binding sites
on the nanotube surface are present, and the interaction of
the nanotubes with the aqueous solution is mediated by the
competition of Na + with H + for the occupancy of these sites.
The nanotube solutions obtained by the exhaustive ultrasound
process were stable for more than 12 months.
2.2. Optical Characterization of the Solubilized Titanate
Nanotubes
The solid trace in Figure 4 shows the absorption spectrum of
solutions of nanotubes obtained by ultrasound dispersion in
www.chemphyschem.org
from the aqueous solution after ultrasound treatment and
drying on a TEM grid. The images show the presence of isolated titanate nanotubes of nearly uniform diameter. All the titanate nanotubes are open ended (see Figure 2 C). The outer diameter ranges from 8 to 10 nm and the inner diameter is
about 4 nm, with an interlayer spacing of 0.8 nm. The nanotubes are some hundred nanometers in length. Similar results
were obtained when a drop of 1:1000 diluted titanate nanotube solution was deposited on a mica surface and observed
by atomic force microscopy (AFM). Tapping mode AFM allows
the acquisition of images under mild conditions; in particular,
the hydration layer of the deposited nanomaterial is preserved.
Also in this case, only single titanate nanotubes were observed
and an average nanotube diameter of (8 1) nm was measured (see Figure 5).
Figure 4. UV/Vis spectra of aqueous solutions of titanate nanotubes. (c):
spectrum of aqueous solution of sodium titanate nanotubes after centrifugation at 10 000 g (pH 6.91). (a): spectrum of a solution of TiO2 nanoparticles (pH 2.1).
distilled water after 20 min of centrifugation (at 104 g), whereas
the dashed-line trace is the spectrum of a solution of TiO2
nanoparticles reported for comparison. The titanate nanotube
spectrum is notably different from that of the nanoparticles
supporting a different nanostructure of TiO2. Notably, after 2 h
of centrifugation of titanate nanotubes at 4 104 g, no significant spectral change was observed with respect to the spectrum shown in Figure 4. Titanate nanotubes have a characteristic maximum absorbance at 245 nm, which undergoes a redshift of about 3 nm above pH 8 (data not shown). On the basis
of the titanium content of the solutions, determined as
peroxy-titanate complex,[25] a molar extinction coefficient of
(9.5 0.1) 103 mol1 L cm1 at 245 nm was calculated for titanate nanotubes, whereas the nanoparticle molar extinction coefficient was (6 0.1) 103 mol1 L cm1 at 230 nm.
2.3. Morphological Characterization of Soluble Titanate
Nanotubes
The TEM images of the as-prepared titanate nanotubes (i.e. the
material obtained by the hydrothermal process before the ultrasound treatment) show the presence of large aggregates, as
visible in Figure 2 A. Figure 2 B shows a representative TEM
high-magnification image of the titanate nanotubes deposited
2013 Wiley-VCH Verlag GmbH & Co. KGaA, Weinheim
Figure 5. AFM image and height profile of nanotubes. The titanate nanotube solution was deposited on a mica surface and left to dry. The instrumental settings were: intermittent contact head, 20 20 mm scan size,
512 512 points per line, 1 Hz scan rate, tapping mode technique.
2.4.
23
Na NMR Spectroscopy of Titanate Nanotube Solutions
The magnetic resonance of 23Na was investigated to obtain insights into the Na + confined in the nanotubes or present in
the surrounding environment. A representative spectrum of
23
Na in titanate nanotube neutral solutions is reported in
Figure 6. The single peak of Figure 6 is characterized by a halfheight line width (Dn = ) of 390 Hz. This value is an order of
magnitude higher than the line width of 1 mm aqueous NaCl,
which is about 16 Hz. A calibration curve of the NMR peak
area versus the concentration of Na + was obtained by using
standardized solutions of NaCl (data not shown). This curve
was used to determine the concentration of Na + in the titanate nanotube solution and in the same sample after destruction of nanotubes by H2SO4 (as reported in the Experimental
Section). From the measured Na + and Ti concentrations we
calculated an atomic ratio Na/Ti of 0.046 and 0.083 before and
after H2SO4 treatment, respectively. These data indicate that
about 50 % of the Na + in titanate nanotube solutions is NMR
1
2
ChemPhysChem 2013, 14, 2786 – 2792
2788
CHEMPHYSCHEM
ARTICLES
www.chemphyschem.org
to 10.5. Further NaOH additions (from 3.85 to about 14 mm) increased the detectable Na + up to 41–49 % of the added Na + .
At about 14 mm NaOH the solution became slightly cloudy.
This solution was incubated at room temperature for 24 h.
After this time a precipitate was present and the detectable
Na + increased to 74 % of the added Na + . This increase was accompanied by a strong narrowing of the NMR peak (from
Dn = = 180 to 117 Hz). The strong increase of the 23Na peak
area and the decrease of its line width during the incubation
period supports the release in solution of free Na + ions from
nanotube agglomerates formed under these alkaline conditions. A similar behavior was observed in another experiment
on back titration with HCl (see Figure S1 and Table 2). In this
1
2
Figure 6. 23Na NMR spectrum of a titanate nanotube aqueous solution. The
titanate nanotube concentration was 32 mm TiO2 equivalents. The instrumental carrier frequency was used as reference and arbitrarily set to 0.
silent, probably because it is strongly immobilized (Dn = >
2000 Hz). The resonance of the remaining Na + is still large
(Dn = = 390 Hz), as shown in Figure 6, which suggests that the
NMR-detectable Na + is exchange broadened.
The addition of NaOH to a clear and neutral solution of titanate nanotubes up to the achievement of the atomic ratio Na/
Ti = 0.67, which is the stoichiometric ratio of sodium titanate
(Na2Ti3O7), determines the abrupt and total precipitation of the
nanotubes present in solution. The Na/Ti ratio measured in this
precipitate (after dissolving it by H2SO4 treatment) was < 0.01.
This low value indicates that the precipitation of titanate nanotubes is accompanied by the release into solution of most of
the Na + ions. In a different experiment, we increased the Na +
concentration by successive additions of NaOH to the neutral
(pH 7.2) titanate nanotube solution obtained after ultrasound
treatment and containing 32 mm TiO2. The 23Na NMR spectrum
was recorded after each Na + addition. In Figure S1 in the Supporting Information the resonance frequency and the halfheight line width are plotted against the added Na + . A summary of the significant spectral changes is reported in Table 1.
In particular, small changes of the 23Na peak area were observed after addition of NaOH to a concentration of about
4 mm, although the peak line width became narrower (Dn =
from 390 to 336 Hz) and meanwhile the pH increased from 7.2
1
Table 2. Back titration of an alkaline solution of titanate nanotubes with
HCl.
2
HCladded [mm]
pH
Na + detected [mm]
Dn = [Hz]
0
2.6
5.2
8.8
9.8
10.9
11.9
2.9
13.9
14.9[a]
26.0[b]
11.6
11.3
10.3
7.6
7.2
6.7
5.3
4.3
3.3
3.0
2.5
3.75
3.60
3.62
3.93
4.53
4.62
5.12
5.36
5.43
11.0
12.1
260
262
237
198
176
158
137
124
112
28
30
1
2
1
2
1
2
Table 1. Titration of a solution of titanate nanotubes with NaOH.
Na + added [mm]
pH
Na + detected [mm]
Na + added/Na + detected
Dn = [Hz]
0
3.85
5.70
7.60
9.50
12.5
14.4[a]
14.4[b]
7.2
10.5
11.1
11.4
11.6
–
–
–
1.47
1.59
2.62
3.31
3.93
5.22
7.03
10.6
–
0.41
0.46
0.43
0.41
0.42
0.49
0.74
390
336
300
267
245
210
180
117
1
2
Small amounts of a concentrated NaOH solution were added to a titanate
nanotube solution (32 mm TiO2). Na + was added as NaOH and detected
by NMR spectroscopy. The measurements were carried out about 1 h
after NaOH addition. [a] The titanate nanotube solution was milky.
[b] After 24 h of incubation. A precipitate was present.
2013 Wiley-VCH Verlag GmbH & Co. KGaA, Weinheim
Small amounts of a concentrated HCl solution were added to a titanate
nanotube solution (32 mm TiO2) previously made alkaline by addition of
10 mm NaOH. The measurements were carried out about 1 h after HCl
addition. [a] A gel phase was present. [b] A precipitate was present.
case the starting sample was a clear and stable solution of
nanotubes containing 32 mm TiO2, to which NaOH was added
up to 10 mm final concentration. Successive additions of
0.5 mm HCl were made to this sample. After a total addition of
10 mm HCl the pH was around neutrality, the half-peak height
decreased from 270 to 176 Hz, and a small change of the 23Na
detectable by NMR spectroscopy was observed (the peak area
is almost constant, as shown in Figure S1). Successive additions
of HCl from neutrality to acidic conditions determined a slight
increase of the amount of detectable 23Na, which abruptly increased around pH 3.0 at which the nanotubes underwent aggregation and precipitation.
The observed behavior can be explained satisfactorily by assuming a three-site exchange dynamics for Na + . The first site
(site 1) is the aqueous bulk solution. The second site category
(site 2) are the sites for which Na + is bound to titanate nanotubes but undergoes fast exchange with free Na + . The Na +
detectable by NMR spectroscopy is the sum of the population
in these two sites (i.e. the detected signal is the weighted average of the individual signals of Na + in sites 1 and 2). Na + in
the third site (site 3) is NMR silent because it is strongly immobilized and the exchange frequency with Na + in sites 1 and 2
is low with respect to the NMR frequency timescale. The
added Na + at first saturates the high-affinity sites 3 so that the
ChemPhysChem 2013, 14, 2786 – 2792
2789
CHEMPHYSCHEM
ARTICLES
peak area does not increase. Upon adding more Na + , this ion
is shared between sites 1 and 2 according to the average affinity of each site and a fast exchange regime holds for these two
sites. Titanate nanotube precipitation is accompanied by
a sudden free Na + increase.
H + added as HCl to the Na + -loaded titanate nanotubes first
displaces Na + in site 2 (so that the signal gets narrower but is
constant in its area). More concentrated H + competes with
Na + in site 3 and the area of the detected signal increases as
well. These results are in accord with the report by Suetake
et al.,[26] who suggested that in solid titanate nanotubes two
states of Na + should exist (Na + strongly and weakly bound).
However, for the first time the experiments were performed in
clear and homogeneous solutions, so we had to take into account the fast ion exchange with the aqueous phase. In the
soluble titanate nanotubes the strongly bound Na + (not NMR
detectable) does not exchange with the aqueous phase, thus
suggesting that the layered inner tubular structure is scarcely
accessible. Confinement of Na + in titanate nanotubes is confirmed by conductivity measurements. In fact, according to the
above-reported data, the titanate nanotubes washed exhaustively with high-purity water and then sonicated contained
0.1 m titanium and were characterized by a Na + /Ti ratio as
high as 0.083. The conductivity values of these solutions were
below 2–3 mS. Conversely, assuming all the Na + ions to be
free, the expected conductivity should be at least one order of
magnitude higher.
2.5. Titanate Nanotube Absorption Edge
UV/Vis spectra of nanotube aqueous solutions were used to
calculate the energy bandgap. We used titanate nanotube
aqueous solutions because the light scattered by these solutions is negligible, as also indicated in Figure 4. The Eg value
calculated according to Tauc et al.[27] was 3.94 eV (the details of
the procedure are reported in the Supporting Information and
the Tauc plot is shown in Figure S2). The Eg value is slightly
higher than the published one.[28] However, all the reported
data obtained up to now concern solid nanotubes, which
should present interfacial differences with respect to the solubilized ones, as suggested by the different hydrophilicity. In
particular, the surface order state was suggested to play a role
in the bandgap value.[29] NMR data indicate a high surface density of Na + binding sites in solubilized titanate nanotubes and
suggest that a structural change, accompanied by Na + release,
induces precipitation.
2.6. Raman Spectra of Titanate Nanotube Solutions
Raman spectra of titanate nanotubes in aqueous solution were
obtained from the air-exposed surface of a specimen in
a quartz cuvette (Figure 7, trace B). Dried titanate nanotube
samples (Figure 7, trace A) were obtained by deposition of
drops of the same solution on a quartz slab and drying under
mild vacuum conditions. The Raman spectrum of dried titanate
nanotubes shows a set of bands peaking at about 276, 290,
388, 448, 639, 668, 706, 824, and 924 cm1. The relative intensi 2013 Wiley-VCH Verlag GmbH & Co. KGaA, Weinheim
www.chemphyschem.org
Figure 7. Raman spectra of dried titanate nanotubes (trace A) and titanate
nanotube aqueous solution (trace B).
ties and the widths of these bands are consistent with published literature data.[30–35] In particular, the strong and broad
band consisting of at least two components, the main one
peaking near 276 cm1 and a shoulder with peak at about
288 cm1 (see Figure 7, trace A), can be assumed to be a key
indicator of the formation of the nanotube phase, as pointed
out by Morgan et al.[36] The Raman spectrum of the aqueous
solution of titanate nanotubes acquired under the same conditions (Figure 7, trace B) is similar to that of dried titanate nanotubes. However, it is less structured and the relative intensity
of some peaks appears to be changed. In particular, the
Raman bands occurring in the region between 200 and
400 cm1 are overlapped to a broad spectral bump, which can
be attributed to a density of vibrational states. The presence of
this feature reflects the disordered nature of the nanostructures. Notwithstanding the broadening in the low-wavenumber region, sharp peaks at 276, 290, 388, and 448 cm1 can be
clearly identified. The spectral region at higher wavenumber is
essentially similar to that of dried titanate nanotubes (peaks at
639, 668, 704, 820, and 926 cm1).
A comparison of the relative intensity of the spectra of the
dried titanate nanotubes and the aqueous titanate nanotube
solution was performed by using the band at about 282 cm1
as reference. This band is assigned to the TiOTi stretching,
which is expected to be scarcely affected by the aqueous
phase. In this way we can observe that the band at about
704 cm1 (706 cm1 in the dried sample) decreases in intensity
and probably shifts to a lower wavenumber (however, this
shift is close to the instrument spectral resolution). This band
is assigned to surface TiO–Na vibration[34] and its decrease
confirms the presence of exchangeable Na + .
3. Conclusions
Titanate nanotubes that are highly soluble in water have been
obtained. Positive outcomes for all the applications of titanate
nanotubes in the homogeneous phase are expected. We obtained some insights into the distinctive properties of titanate
nanotubes in aqueous solution. In particular, reversible exchange of Na + was observed. Both fast and slow exchange reChemPhysChem 2013, 14, 2786 – 2792
2790
CHEMPHYSCHEM
ARTICLES
www.chemphyschem.org
gimes are present, thus indicating different families of Na +
binding sites. Raman data confirm the presence of exchangeable Na + . Although the morphological characterization of
water-soluble titanate nanotubes shows that they have
a shape comparable to the solid titanate nanotubes obtained
by other authors, the bandgap energy is higher. As the bandgap value is related to the order state of the surface layer,[29] the
higher bandgap value we found suggests a highly ordered
state in the surface layer, which is in accord with the strong
Na + immobilization evidenced by NMR data and with the
strong interaction with water molecules that results in the unusual hydrophilicity.
Raman Experiments
For Raman measurements a microsampling apparatus (Horiba
Jobin–Yvon model Labram HR) was used. The system, equipped
with an Olympus microscope mounting objectives of different
magnification (e.g. 10, 50, 80, and 100 ), consisted of a He–Ne
laser and a narrow-band notch filter. A spectrograph of 80 cm focal
length was used. Raman spectra were excited at room temperature
by means of the 632.8 nm emission line (about 3 mW power, measured at the exit of the objective) and were detected by a chargecoupled device (1024 256 pixels), cryogenically cooled by liquid
nitrogen. The detection limit on the side of low wavenumber, due
to the notch filter, was about 200 cm1. The best Raman spectra
were collected by the long-working-distance 80 objective. The focused laser spot had an apparent diameter of about 1–2 mm, and
the spectral resolution was about 2 cm1.
Experimental Section
Synthesis of Nanotubes and Preparation of Their Aqueous
Solutions
Structure Characterization of Titanate Nanotubes
Absolute sizes and shapes of the solubilized material were determined by using both TEM and AFM. A drop of clear solution obtained after sonication (4 mm TiO2) was diluted 1:1000 in distilled
water and then deposited on a polyacetate film supported by
a copper grid for TEM observations, carried out with a Tecnai G2
TEM instrument (FEI, The Netherlands) working at 100 kV. AFM
measurements were performed with a ThermoMicroscopes-Veeco
CP instrument (Sunnyvale, CA), equipped with an intermittent contact head and 5 and 100 mm scanners, on diluted titanate nanotube solutions deposited on mica sheets. The images were acquired using the tapping mode technique.
Optical Characterization and Bandgap Calculation
The absorbance of TiO2 nanoparticles and titanate nanotube solutions was obtained by a Varian Cary 50 spectrophotometer. The absorption coefficient a (cm1) was calculated from the absorbance A
as: a = (A 2.3)/d, in which d is the optical path length. The Eg
value of the titanate nanotubes was obtained from the intercept
of the Tauc plot[27] according to the relationship [Eq. (1)]:
a ¼ CðhnE g Þg
ð1Þ
in which C is a constant and g is 0.5 for a permitted direct transition.
Titanate nanotubes were prepared according to the alkaline hydrothermal method of Kasuga et al.[21] but slightly modified. In a typical
synthesis procedure, anatase powder (200 mg) in 10 m NaOH
(10 mL) was heated (110 8C, 48 h) in a PTFE vial under gentle
mixing. The white powder obtained at the end of this step contained agglomerates as large as 4–5 mm. The flocky sediment (initial volume about 3 mL) was washed exhaustively as follows: addition of distilled water (50 mL), gentle shaking (5 min), and separation by sedimentation (5 min). This washing step was repeated
many times to achieve a final pH value between 6 and 7 and a specific conductivity below 20 mS. As the washing step was repeated,
the sediment decreased in volume and at the end of the process it
looked like a heavy sandy material. According to the UV/Vis spectra
(see below) the supernatants did not contain measurable amounts
of TiO2. The residual material recovered at the end of the washing
step was dried at 65 8C and P < 1 102 Torr for 24 h. The washed
and dried sandy material was dispersed in water (50 mL). The
turbid powder dispersion was sonicated at 65 8C, 400 W power (ULTRAsonic 28x cleaner, Neytech, Yucaip, CA). A small amount of the
suspension was sampled at various times for the absorbance measurements and after 5 min of centrifugation was diluted with distilled water. The absorbance of the diluted solutions was recorded
at 245 nm. The sonication time lasted at least 40 h.
Stability tests based on the spectral characteristics were performed
on the titanate nanotube solutions. No significant change was observed even after 1 year of storage in the dark at room temperature.
NMR Experiments
23
Na NMR spectra of titanate nanotubes (79.39 MHz, H2O/D2O 9:1,
25 8C) were recorded with an MSL Bruker instrument by using standard acquisition routines. The instrumental carrier frequency was
arbitrarily set to 0 and used as reference for chemical shift. The stability of this frequency during the experimental time was controlled by taking 1 mm Na + buffered at pH 7.0 as chemical-shift
reference. The carrier frequency drift was negligible during the experimental time. Aqueous solutions of the as-prepared titanate
nanotubes were placed in 5 mm NMR tubes and titrations were
performed by adding NaOH or HCl as described in Section 2. 1/T2
values were obtained from the half-height line width of the
23
Na resonance if the contribution of 1/T2* was negligible, otherwise the Carr–Purcell–Meiboom–Gill pulse sequence was utilized.
Free induction decay processing and line-shape analysis were performed with Topspin software (Bruker, Karlsruhe, Germany).
2013 Wiley-VCH Verlag GmbH & Co. KGaA, Weinheim
Synthesis of TiO2 Nanoparticles
TiO2 nanoparticles were prepared by the method of Pottier et al.[37]
but slightly modified. In particular, TiCl4 was perfused very slowly
in distilled water under vigorous stirring, keeping the temperature
of the reaction mixture as low as possible by an ice bath. The solution containing TiO2 nanoparticles was dialyzed against 1 mm HCl
to avoid nanoparticle precipitation.
Determination of Titanium Content
The amount of titanium present in solution was determined after
destruction of TiO2 structures (105 8C, 96 % H2SO4, 48 h). The titanyl
ions so obtained were converted into peroxy-titanates by oxidation
with hydrogen peroxide (0.5 m). The titanium concentration was
ChemPhysChem 2013, 14, 2786 – 2792
2791
CHEMPHYSCHEM
ARTICLES
calculated from the optical absorbance of peroxy-titanates:
lmax(e) = 420 nm (690 mol1 L cm 1).[25]
Acknowledgements
The authors thank Giuseppe Tognon for the TEM images.
Keywords: cation confinement · interfaces · nanotubes · NMR
spectroscopy · Raman spectroscopy
[1] D. V. Bavykin, J. M. Friedrich, F. C. Walsh, Adv. Mater. 2006, 18, 2807 –
2824.
[2] P. Hoyer, Langmuir 1996, 12, 1411 – 1413.
[3] H.-H. Ou, S.-L. Lo, Sep. Purif. Technol. 2007, 58, 179 – 191.
[4] P. V. Kamat, J. Phys. Chem. C 2012, 116, 11849 – 11851.
[5] P. Roy, S. Berger, P. Schmuki, Angew. Chem. 2011, 123, 2956 – 2995;
Angew. Chem. Int. Ed. 2011, 50, 2904 – 2939.
[6] Y. Tang, D. Dong, Y. Lai, Y. Shen, Y. Zhang, Y. Huang, J. Tao, C. Lin, Z.
Dong, Z. Chen, J. Mater. Chem. 2010, 20, 10169 – 10178.
[7] K.-S. Mun, S. D. Alvarez, W.-Y. Choi, M. J. Sailor, ACS Nano 2010, 4, 2070 –
2076.
[8] N. K. Shrestha, J. M. Macak, F. Schmidt-Stein, R. Hahn, C. T. Mierke, B.
Fabry, P. Schmuki, Angew. Chem. 2009, 121, 987 – 990; Angew. Chem. Int.
Ed. 2009, 48, 969 – 972.
[9] C. McCullagh, N. Skillen, M. Adams, P. K. J. Robertson, J. Chem. Technol.
Biotechnol. 2011, 86, 1002 – 1017.
[10] Y. Ide, M. Matsuoka, M. Ogawa, J. Am. Chem. Soc. 2010, 132, 16762 –
16764.
[11] W. Hou, Z. Liu, P. Pavaskar, W. H. Hung, S. B. Cronin, J. Catal. 2011, 277,
149 – 153.
[12] M. Anpo, Pure Appl. Chem. 2000, 72, 1787 – 1792.
[13] S. T. Hussain, A. Siddiqa, Int. J. Sci. Techn. 2011, 8, 351 – 362.
[14] B. C. Viana, O. P. Ferreira, A. G. Souza Filho, C. M. Rodrigues, S. G.
Moraes, J. Mendes Filho, O. L. Alves, J. Phys. Chem. C 2009, 113, 20234 –
20239.
[15] C. Von Wilmowsky, S. Bauer, R. Lutz, M. Meisel, F. W. Neukam, T. Toyshima, P. Schmuki, E. Nkenke, K. A. Schlegel, J. Biomater. Mater. Res. Part B
2009, 89, 165 – 171.
[16] A.-L. Papa, L. Maurizi, D. Vandroux, P. Walker, N. Millot, J. Phys. Chem. C
2011, 115, 19012 – 19017.
2013 Wiley-VCH Verlag GmbH & Co. KGaA, Weinheim
www.chemphyschem.org
[17] A. Kodama, S. Bauer, A. Komatsu, H. Asoh, S. Ono, P. Schmuki, Acta Biomater. 2009, 5, 2322 – 2330.
[18] G. K. Mor, O. K. Varghese, M. Paulose, C. A. Grimes, Adv. Funct. Mater.
2005, 15, 1291 – 1296.
[19] H. Shin, D. K. Jeong, J. Lee, M. M. Sung, J. Kim, Adv. Mater. 2004, 16,
1197 – 1200.
[20] T. Kasuga, M. Hiramatsu, A. Hoson, T. Sekino, K. Niihara, Langmuir 1998,
14, 3160 – 3163.
[21] T. Kasuga, M. Hiramatsu, A. Hoson, T. Sekino, K. Niihara, Adv. Mater.
1999, 11, 1307 – 1311.
[22] D. V. Bavykin, J. M. Friedrich, A. A. Lapkin, F. C. Walsh, Chem. Mater.
2006, 18, 1124 – 1129.
[23] C. Ratanatawanate, J. Yu, C. Zhou, J. Zheng, K. J. Balkus, Nanotechnology
2011, 22, 065601 – 06565.
[24] K. Vasilev, Z. Poh, K. Kant, J. W. Chan, A. Michelmore, D. Losic, Biomaterials 2010, 31, 532 – 540.
[25] D. Snell, C. T. Snell, in Colorimetric Methods of Analysis, 3rd Ed., Vol. 2,
Van Nostrand, New York, 1949, pp. 438 – 439.
[26] J. Suetake, A. Y. Nosaka, K. Hodouchi, H. Matsubara, Y. Nosaka, J. Phys.
Chem. C 2008, 112, 18474 – 18482.
[27] J. Tauc, A. Grigorovici, A. Vancu, Phys. Status Solidi 1966, 15, 627 – 637.
[28] H. Tokudome, M. Miyauchi, Chem. Lett. 2004, 33, 1108 – 1109.
[29] X. Chen, L. Liu, P. Y. Yu, S. S. Mao, Science 2011, 331, 746 – 750.
[30] T. Gao, H. Fjelivag, P. Norby, Inorg. Chem. 2009, 48, 1423 – 1432.
[31] B. C. Viana, O. P. Ferreira, A. G. Souza Filho, A. A. Hidalgo, J. Mendes Filho, O. L. Alves, Vib. Spectrosc. 2011, 55, 183 – 187.
[32] T. Beuvier, M. Richard-Plouet, L. Brohan, J. Phys. Chem. C 2010, 114,
7660 – 7665.
[33] P. Haro-Gonzlez, M. Pedroni, F. Piccinelli, L. L. Martın, S. Polizzi, M. Giarola, G. Mariotto, A. Speghini, M. Bettinelli, I. R. Martin, J. Lumin. 2011,
131, 2473 – 2477.
[34] S.-J. Kim, Y.-U. Yun, Y.-J. Oh, S. H. Hong, C. A. Roberts, K. Routray, I. E.
Wachs, J. Phys. Chem. Lett. 2010, 1, 130 – 135.
[35] D. V. Bavykin, M. Carravetta, A. N. Kulak, F. C. Walsh, Chem. Mater. 2010,
22, 2458 – 2465.
[36] D. L. Morgan, H.-W. Liu, R. L. Frost, E. R. Waclawik, J. Phys. Chem. C 2010,
114, 101 – 110.
[37] A. Pottier, S. Cassaignon, C. Chaneac, F. Villain, E. Tronc, J. P. Joliver, J.
Mater. Chem. 2003, 13, 877 – 882.
Received: March 25, 2013
Published online on June 28, 2013
ChemPhysChem 2013, 14, 2786 – 2792
2792
© Copyright 2026 Paperzz