Acta mater. 48 (2000) 3169±3175
www.elsevier.com/locate/actamat
EFFECTS OF LINE AND PASSIVATION GEOMETRY ON
CURVATURE EVOLUTION DURING PROCESSING AND
THERMAL CYCLING IN COPPER INTERCONNECT LINES
T.-S. PARK and S. SURESH{
Department of Materials Science and Engineering, Massachusetts Institute of Technology, Cambridge,
MA 02139, USA
(Received 30 December 1999; accepted 17 April 2000)
AbstractÐA simple theoretical analysis for curvature evolution in unpassivated and passivated copper
interconnect lines on a silicon substrate is proposed. A layer consisting of copper and oxide lines is modeled as a homogenized composite that has dierent elastic moduli and thermal expansion coecients in
two dierent directions, i.e. along and across the lines, due to the anisotropic line geometry. These eective
thermoelastic properties of the composite layer are approximated in terms of volume fractions and thermoelastic properties of each line using standard composite theory. This analogy facilitates the calculation of
curvature changes in Damascene-processed copper lines subjected to chemical±mechanical polishing and/or
thermal cycling. The eects of line height, width and spacing on curvature evolution along and across the
lines are readily extracted from the analysis. In addition, this theory is easily extended to passivated copper
lines irrespective of passivation materials by superimposing the curvature change resulting from an additional layer. Finite element analysis has been used to assess the validity of the theoretical predictions;
such comparisons show that the simple theory provides a reasonable match with numerical simulations of
curvature evolution during the Damascene process in copper interconnects for a wide range of line and
passivation geometry of practical interest. 7 2000 Acta Metallurgica Inc. Published by Elsevier Science Ltd.
All rights reserved.
Keywords: Coating; Composite; Copper; Theory and simulation; Thermal cycling
1. INTRODUCTION
The reliability of metal interconnect lines in integrated circuits is known to be in¯uenced by failure
mechanisms such as electromigration [1±3] and
stress-induced voiding [4±6]. In ultra large scale integration (ULSI) devices, multilevel metallization is
needed. Oxide passivation layer deposition usually
involves heating up to 4008C so that the interconnect lines undergo several thermal cycles. Thermal
stresses are generated by the large dierence in
expansion/contraction which develops between the
metal interconnect lines and surrounding materials
during thermal cycling. Tensile thermal stresses
formed during cooling from the oxide deposition
temperature can cause voiding near the interface
between an interconnect line and the surrounding
passivation layer.
Due to the diculty of etching copper, a new
fabrication technique called the Damascene process
has been introduced in the semiconductor industry
{ To whom all correspondence should be addressed.
[7]. In this method, trenches whose dimensions conform to the geometry of the copper interconnect
lines in the circuit are dry-etched in an oxide layer
which is grown on the silicon substrate. These
trenches are then plugged with copper by recourse
to chemical vapor deposition (CVD) or electroplating. The extra copper above the trenches is then
removed by chemical±mechanical polishing (CMP),
and then a passivation or capping layer is deposited
on top of the interconnect structure. As this process
involves polishing, the control of curvature of the
silicon wafer becomes critical for uniform polishing
over the entire wafer. The changes in curvature
induced during polishing and subsequent passivation also provide valuable information about the
evolution of internal stresses in the interconnect
lines. The objective of this work was to develop a
simple theoretical analysis of the evolution of curvature along and across copper interconnect lines
on silicon substrates during various fabrication
steps, as functions of the line and passivation geometry. The analytical results are veri®ed with numerical simulation using the ®nite element method
1359-6454/00/$20.00 7 2000 Acta Metallurgica Inc. Published by Elsevier Science Ltd. All rights reserved.
PII: S 1 3 5 9 - 6 4 5 4 ( 0 0 ) 0 0 1 1 4 - 2
3170
PARK and SURESH: CURVATURE EVOLUTION IN INTERCONNECT LINES
(FEM) for a range of line geometry of practical
interest.
2. ANALYTICAL MODEL
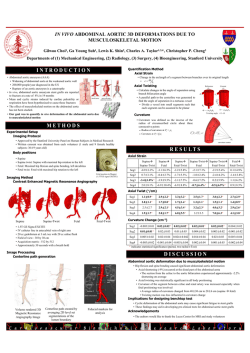
Figure 1(a) is a schematic of Cu interconnect
lines on a Si substrate following the Damascene
process. Assuming that the aspect ratio (h/w ) of the
Cu and SiO2 lines is high (typically equal to or
greater than unity), the structure can be homogenized into a composite layer as shown in Fig. 1(b).
Due to the anisotropic line geometry, this composite layer has dierent values of eective elastic
modulus and thermal expansion coecient along
the lines, Ex and ax, respectively, than those across
the lines, Ey and ay, respectively, even if Cu itself is
modeled as elastically and thermally isotropic.
Using composite theory, these eective properties
can be calculated in terms of the volume fraction,
elastic modulus and thermal expansion coecient
of Cu lines, fl
w=p), El and al, and those of SiO2
lines, fo
1 ÿ w=p), Eo and ao.
Considering a plate of an elastic material which
is subjected to bending moments, Mx and My,
along the x- and y-directions, respectively, where x±
y is the plane of the plate, the resulting non-equibiaxial stresses are generally expressed as [8]
Es h3
kx ns ky
12
1 ÿ ns2
1
hs
Es h3
My hsyy ih
ÿ
ky ns kx
2
12
1 ÿ ns2
2
Mx hsxx ih
hs
2
ÿ
where hsxx i and hsyy i are the normal stresses in the
plate along the x- and y-directions, respectively, kx
and ky are the curvatures along the x- and y-directions, respectively, and Es and ns are the elastic
modulus and Poisson ratio, respectively, of the Si
substrate. Equations (1) and (2) can be rewritten as
6 h
hsxx i ÿ ns hsyy i
Es hs2
3
6 h
hsyy i ÿ ns hsxx i:
Es hs2
4
kx ÿ
ky ÿ
From equations (3) and (4), it is evident that the
curvature in one direction is expected to have some
contribution from the thermal stress resulting from
thermal mismatch in the other direction. This coupling term, however, includes the Poisson ratio,
which makes this contribution relatively small. In
addition coupling can be taken into account by
considering the eective thermal expansion coecients of the homogenized composite layer, which
somewhat compensates for the limitations of a onedimensional approach. It could, therefore, be postulated that a simple uniaxial, anisotropic composite
model for patterned elastic lines might provide suciently accurate predictions of curvature evolution
in response to changes in geometry (such as that
arising from chemical±mechanical polishing) or to
changes in internal stresses arising from thermal
cycling. A simple analytical model for curvature
evolution, in unpassivated and passivated interconnect lines, is developed on the basis of this premise.
The conditions of validity of such a simple model
are then assessed using detailed ®nite element simulations.
The stresses are from thermal mismatch in the
uniaxial state is approximated as
hsxx i ÿEx
ax ÿ as DT,
hsyy i ÿEy
ay ÿ as DT:
5
Combining equation (5) with equation (3) or (4),
the curvature components are calculated to be
kx
Fig. 1. Schematic of unpassivated Cu interconnect lines on
a Si substrate following the Damascene process: (a) individual Cu lines and SiO2 lines; (b) homogenized composite
layer.
6 h
Ex
ax ÿ as DT,
Es hs2
6 h
ky
Ey
ay ÿ as DT:
Es hs2
6
Equation (6), which is valid only for uniaxial loading, is used for calculating curvature evolution of
PARK and SURESH: CURVATURE EVOLUTION IN INTERCONNECT LINES
the homogenized composite layer consisting of Cu
and SiO2 lines which is subjected to biaxial loading.
The volume-averaged stresses from thermal mismatch in the equibiaxial state are expressed as
hsxx i hsyy i ÿEf
af ÿ as DT
7
where Ef and af are the biaxial modulus
Ef =1 ÿ
nf and thermal expansion coecient, respectively,
of a uniform ®lm. Combining equation (7) with
equations (3) and (4), the curvatures can be found
as
6 h
Ef
af ÿ as DT
Es hs2
kx ky
8
where Es and as are the biaxial modulus
Es =1 ÿ
ns and thermal expansion coecient, respectively,
of the Si substrate. Equation (8) is used for curvature evolution of the uniform passivation layer,
which is a continuous SiO2 layer in this work.
The total strains during thermal excursions are
the same along the Cu and SiO2 lines, and they are
related to the eective thermal expansion coecient
along the lines as
hsl i
hso i
al DT
ao DT
El
Eo
9
where hsl i and hso i are the volume-averaged stresses
in the Cu and SiO2 lines, respectively. A force balance equation for this geometry, Fig. 1(a), gives
fl hsl i fo hso i 0:
10
From equations (9) and (10), the eective thermal
expansion coecient along the line direction is
ax
fl El al fo Eo ao
:
fl El fo Eo
11
The eective elastic modulus along the line direction is written, using the composite theory, as
Ex fl El fo Eo :
12
Substituting Ex and ax from equations (11) and (12)
for the corresponding properties in equation (6), the
curvature change along the lines, kx, is found to be
kx
6 h
Ex
ax ÿ as DT:
Es hs2
13
Across the lines, consideration of thermal expansion in the line and of the Poisson eect gives
3171
hsl i
hso i
al DT fo ÿ no
El
Eo
ao DT :
ay DT fl ÿ nl
14
Substituting hsl i and hso i from equations (9) and
(10) into equation (14), the eective thermal expansion coecient across the line direction is calculated
as
ay fl al fo ao
fl fo
nl Eo ÿ no El
al ÿ ao
:
fl El fo Eo
15
The eective elastic modulus across the line direction is written, with standard composite theory, as
Ey
El Eo
:
fl Eo fo El
16
Substituting Ey and ay from equations (15) and (16)
into equation (6), the curvature change across the
lines, ky, becomes
ky
2.1. Unpassivated lines
ax DT
6 h
Ey
ay ÿ as DT:
Es hs2
17
WikstroÈm et al. [9] derived expressions for the
normal components of volume-averaged stresses in
interconnect lines for two limiting cases: very low
and high line aspect ratios, h/w. At a very low line
aspect ratio, h=w 4 0, the interconnect structure can
be considered as comprising individual Cu and SiO2
®lms. Therefore, the curvature changes in both
directions, i.e. along and across the lines, are the
same and are obtained by adding the appropriate
contribution from each ®lm
low
klow
x ky ÿ6
h 1 ÿ ns
fl hsl ilow
hs2 Es
fo hso ilow
18
where hsl ilow and hso ilow are the volume-averaged
biaxial stresses in the lines and the oxide, respectively, for the case of the low line aspect ratio.
Similarly, klow
and klow
are the curvatures in the Cu
l
o
and SiO2 ®lms, respectively.
As integration of the devices increases with
decreasing line width, the aspect ratio of interconnect lines currently used in the semiconductor
industry is also increased. At high line aspect ratios,
h=wr1, the curvature changes in each direction are
obtained as follows:
"
#
h 1 1
khigh
ÿns
x
ÿ6
khigh
hs2 Es ÿns 1
y
"
f hsl ihigh fo hsoxx ihigh
l xx
fl hslyy ihigh fo hsoyy ihigh
#
19
where the superscript ``high'' denotes the high line
3172
PARK and SURESH: CURVATURE EVOLUTION IN INTERCONNECT LINES
Cu interconnect lines can also be assessed using the
above simple model by invoking the concept of
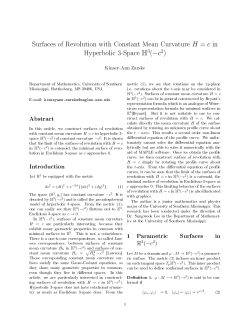
superposition. Figure 2 shows a schematic of passivated Cu lines, which can be regarded as superimposition of the composite layer and the passivation
layer. For a given passivation material, the curvature change resulting from the passivation layer, kp,
is obtained in terms of the biaxial modulus of the
passivation layer, Ep
Ep =1 ÿ np ), its thermal
expansion coecient, ap, and its thickness, hp, using
equation (8) as
kp
Fig. 2. Schematic of passivated Cu interconnect lines on a
Si substrate following passivation: (a) actual interconnect
structure; (b) superimposition of the composite layer and
passivation layer.
20
By adding kp from equation (20) to kx and ky from
equations (13) and (17), respectively, curvature
changes of passivated lines, kx0 and ky0 , are obtained:
kx0 kx kp
aspect ratio for the components of volume-averaged
stresses and curvatures in the Cu and SiO2 lines in
this regime. At fl fo 0:5, equations (13) and (17)
give approximate values with less than 5% error
compared with the values from equation (19).
Therefore, the present model shows a reasonably
good match in the range of practical line geometry,
h=wr1, in spite of its simplifying assumption that
the curvatures along and across the line direction
do not in¯uence one another.
6 hp
Ep
ap ÿ as DT:
Es hs2
6 h
6 hp
Ex
ax ÿ as DT
Ep
ap
Es hs2
Es hs2
ÿ as DT
21
2.2. Passivated lines
The evolution of curvatures in passivated elastic
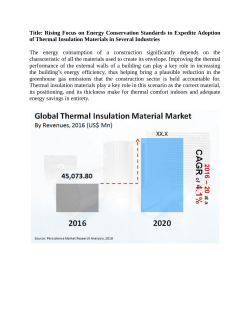
Fig. 3. A representative unit cell (top portion) and ®nite
element discretization for Cu lines in the Damascene process.
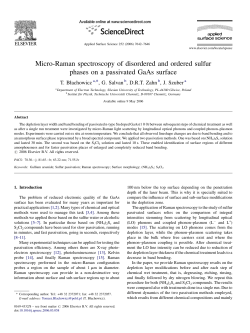
Fig. 4. Curvature changes of unpassivated Cu lines in the
Damascene process at ®xed line geometry
h 1 mm,
hs 525 mm, h=w 1, p=w 2). The Cu layer is deposited
at 2008C: (a) along lines; (b) across lines.
PARK and SURESH: CURVATURE EVOLUTION IN INTERCONNECT LINES
ky0 ky kp
Table 1. Material properties used in the simulations
6 h
6 hp
Ey
ay ÿ as DT
Ep
ap
Es hs2
Es hs2
ÿ as DT:
3173
22
The accuracy of this result will be assessed in
Section 4.
3. FINITE ELEMENT ANALYSIS
The ®nite element method (FEM) was used to
verify the present analytical model. For this purpose, the general purpose ®nite element program
ABAQUS [10] was employed. The mesh used in the
present numerical simulation is shown in Fig. 3.
Due to the periodicity and symmetry of the
arrangement, only a unit segment ranging from a
symmetric axis and the neighboring periodic boundary is needed. Here h, w, and p represent the height,
width, and spacing of Cu lines, respectively. A generalized plane strain formulation, which is an extension of the plane strain framework (with the y±z
plane being the plane of deformation), was used in
the calculations. This was accomplished by superimposing a longitudinal strain, exx, on the plane strain
state. The detailed procedure for obtaining the curvatures using such numerical simulation can be
found in earlier papers [11, 12].
Table 1 shows the material properties used in the
simulations [12, 13]. Isotropic material properties
were used, and residual stresses which may result
from Cu deposition and/or polishing were not
taken into account. This analysis deals with only
elasticity, which is expected to be valid over a wide
range of practical interest since the material surrounding the Cu lines, especially in the case of passivated lines, leads to elevated levels of hydrostatic
stress in the lines thereby inducing constrained deformation [6]{.
Si
Cu
SiO2
E (GPa)
n
a (10ÿ6/8C)
130
110
71.4
0.28
0.30
0.16
2.60
17.0
0.524
oxidation at 10008C, cooled down to 2008C, and
then patterned into trenches (at A). The residual
stress formed during oxidation is not considered in
this simulation. At 2008C, a Cu layer is deposited
on patterned SiO2 lines, and then cooled down to
room temperature
A 4 B). A very large curvature
change occurs during cooling in this direction.
When an excess Cu layer (1 mm thick) is removed
by polishing
B 4 C), the curvature drops drastically. Then as the temperature is raised from room
temperature
C 4 D), the curvature changes in the
opposite direction. Across the lines, Fig. 4(b), the
curvature change shows dierent slopes from those
along lines during cooling and heating. Analytical
predictions (Equations (13) and (17) for unpassivated lines and equations (21) and (22) for the case
4. RESULTS AND DISCUSSION
4.1. Changes in curvature during the Damascene
process
Figure 4(a) shows curvature changes along the
unpassivated Cu lines from the Damascene process
for a ®xed line geometry
h=w 1, p=w 2). First
we assume that the SiO2 layer is grown by thermal
{ In the unpolished Cu layer (before CMP), however,
plastic deformation can occur because the yield strength of
unpassivated Cu ®lms can be very low at moderate temperature (well below 4008C) [14]. Unpassivated Cu lines
(after CMP) which are in the trench with its top face
being free may also plastically deform due to high deviatoric components unless the aspect ratio is very high. These
inelastic deformations should be considered when experimental data are compared with the present model.
Fig. 5. Curvature changes of unpassivated Cu
h 1 mm, hs 525 mm during heating from room
perature to 2008C as a function of: (a) aspect ratio at
pitch ratio
p=w 2); (b) reciprocal of pitch ratio at
aspect ratio
h=w 1).
lines
tem®xed
®xed
3174
PARK and SURESH: CURVATURE EVOLUTION IN INTERCONNECT LINES
in the layer which consists of Cu and SiO2 lines.
When a pure Cu ®lm is considered
w=p 4 1), the
present one-dimensional model gives
kx ky
6 h
El
al ÿ as DT:
Es hs2
23
However, the biaxial modulus of the Cu ®lm and
the Si substrate should be used to obtain exact curvature changes for this two-dimensional structure:
6 h
El
al ÿ as DT
Es hs2
1 ÿ ns 6 h
El
al ÿ as DT:
1 ÿ nl Es hs2
kexact
kexact
x
y
Fig. 6. Curvature changes of passivated Cu lines with SiO2
passivation layer
h 1 mm, hp 1 mm, hs 525 mm
during heating from room temperature to 2008C as a function of: (a) aspect ratio at ®xed pitch ratio
p=w 2); (b)
reciprocal of pitch ratio at ®xed aspect ratio
h=w 1).
with excess Cu.) are exactly matched with calculated values by FEM in both directions during the
above fabrication and thermomechanical processes.
4.2. Eects of line and passivation geometry
Figure 5(a) shows curvature changes during heating from room temperature to 2008C as a function
of aspect ratio at a ®xed pitch ratio
p=w 2).
When the pitch ratio is ®xed, the fraction of Cu in
this composite layer is unchanged. Therefore,
equations (13) and (17) give constant curvature
values, which reasonably ®t the results of numerical
simulation over a wide range.
Figure 5(b) shows curvature changes during heating from room temperature to 2008C as a function
of the reciprocal of pitch ratio (w/p ), which corresponds to the volume fraction of Cu, at ®xed aspect
ratio
h=w 1). As the spacing between the Cu
lines increases, the fraction of Cu in this layer
decreases. Considering the volume fraction in
equations (13) and (17), analytical values agree closely with FEM results over all Cu volume fraction
24
Therefore, the factor of
1 ÿ ns =
1 ÿ nl can be
regarded as an error of the present model in this
limiting case, and it gives only 3% error for the
pure Cu ®lm. In the same way, the corresponding
factor for a pure SiO2 ®lm,
w=p 4 0), can be
expressed as
1 ÿ ns =
1 ÿ no , which shows a 17%
error. But since this SiO2 rich region shows very
small curvature changes compared with that with
high Cu volume fraction, this error is not large in
an absolute value. Therefore, it shows a very good
agreement with numerical simulation in a fairly
wide range, where practical interconnect line geometries lie.
Analytical predictions and FEM results for passivated lines with SiO2 passivation layer are shown in
Fig. 6. They represent almost the same trends as
unpassivated lines with smaller absolute values
because the thermal expansion coecient of oxide
is lower than Si substrate. Due to the high diusivity of Cu through SiO2 and Si, a diusion barrier
such as TaN is commonly employed [7]. Although
it makes more complicated interconnect structures,
the eect of this additional layer can be easily incorporated in the present model by superimposition
for linear elasticity condition and may be negligible
if this layer is very thin, i.e. of the order of a few
hundred AÊngstroÈms.
5. CONCLUSIONS
In this paper, a simple analytical model based on
a composite analogy has been used to predict curvature in unpassivated and passivated Cu lines in
the Damascene process. A layer consisting of copper and oxide lines is modeled as a homogenized
composite layer consisting of Cu and SiO2 lines.
The eective thermoelastic properties of the composite layer are computed in terms of volume fractions
and thermoelastic properties of each line using standard composite theory, which enables us to calculate curvature changes during the Damascene
process employing thermal cycling and polishing.
Finite element analyses have been used to assess the
accuracy of the simple analytical model. These
PARK and SURESH: CURVATURE EVOLUTION IN INTERCONNECT LINES
values are exactly matched with each other during
Cu deposition, polishing, passivation, and thermal
cycling under the assumption of isotropic material
properties and linear elasticity conditions. Although
residual stresses are not incorporated into the analyses, they can be appropriately superimposed to
modify the predicted curvatures if the magnitudes
of residual stresses are known. The eects of line
geometry such as aspect ratio, h/w, and pitch ratio,
p/w, can also be rationalized with the present
model. In addition, the model can also be easily
extended to include passivated copper lines, for any
passivation material, by superimposing the curvature change resulting from an additional layer.
AcknowledgementsÐThis work was supported by the
Oce of Naval Research under Grant N-0014-94-1-0139
to MIT. The authors acknowledge helpful discussions with
A. WikstroÈm and Y.-L. Shen.
REFERENCES
1. Korhonen, M. A., Bùrgesen, P., Tu, K. N. and Li,
C.-Y., J. appl. Phys., 1993, 73, 3790.
3175
2. Clement, J. J. and Thompson, C. V., J. appl. Phys.,
1995, 78, 900.
3. Gleixner, R. J., Clemens, B. M. and Nix, W. D., J.
Mater. Res., 1997, 12, 2081.
4. Greenbaum, B., Sauter, A. I., Flinn, P. A. and Nix,
W. D., Appl. Phys. Lett., 1991, 58, 1845.
5. Bùrgesen, P., Lee, J. K., Gleixner, R. and Li, C.-Y.,
Appl. Phys. Lett., 1992, 60, 1706.
6. Moske, M. A., Ho, P. S., Mikalsen, D. J., Cuomo, J.
J. and Rosenberg, R., J. appl. Phys., 1993, 74, 1716.
7. Hu, C.-K., Luther, B., Kaufman, F. B., Hummel, J.,
Uzoh, C. and Pearson, D. J., Thin Solid Films, 1995,
262, 84.
8. Timoshenko, S., in Strength of Materials, 3rd edn.
Krieger, Huntington, NY, 1976, p. 88.
9. WikstroÈm, A., Gudmundson, P. and Suresh, S., J.
appl. Phys., 1999, 86, 6088.
10. ABAQUS Version 5. 8, general purpose ®nite element
program, Hibbit, Karlson and Sorensen Inc.,
Pawtucket, RI, 1999.
11. Shen, Y.-L., Suresh, S. and Blech, I. A., J. appl.
Phys., 1996, 80, 1388.
12. Gouldstone, A., Shen, Y.-L., Suresh, S. and
Thompson, C. V., J. Mater. Res., 1998, 13, 1956.
13. WikstroÈm, A., Gudmundson, P. and Suresh, S., J.
Mech. Phys. Solids, 1999, 47, 1113.
14. Shen, Y.-L., Suresh, S., He, M. Y., Bagchi, A.,
Kienzle, O., RuÈhle, M. and Evans, A. G., J. Mater.
Res., 1998, 13, 1928.
© Copyright 2026 Paperzz