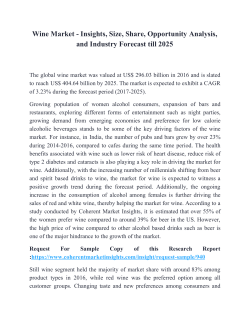
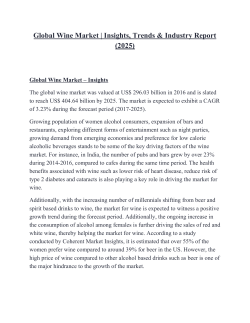
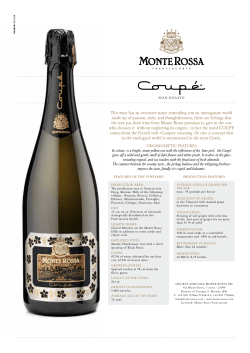
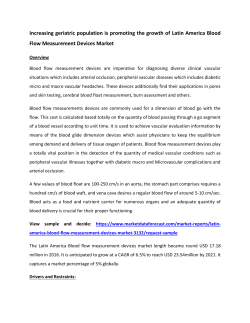
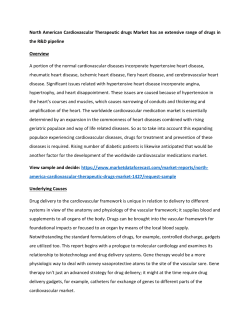
Eur J Epidemiol (2011) 26:833–850
DOI 10.1007/s10654-011-9631-0
REVIEW
Wine, beer or spirit drinking in relation to fatal and non-fatal
cardiovascular events: a meta-analysis
Simona Costanzo • Augusto Di Castelnuovo
Maria Benedetta Donati • Licia Iacoviello •
Giovanni de Gaetano
•
Received: 15 July 2011 / Accepted: 31 October 2011 / Published online: 11 November 2011
Ó Springer Science+Business Media B.V. 2011
Abstract In previous studies evaluating whether different
alcoholic beverages would protect against cardiovascular
disease, a J-shaped relationship for increasing wine consumption and vascular risk was found; however a similar
association for beer or spirits could not be established. An
updated meta-analysis on the relationship between wine,
beer or spirit consumption and vascular events was performed. Articles were retrieved through March 2011 by
PubMed and EMBASE search and a weighed least-squares
regression analysis pooled data derived from studies that
gave quantitative estimation of the vascular risk associated
with the alcoholic beverages. From 16 studies, evidence
confirms a J-shaped relationship between wine intake and
vascular risk. A significant maximal protection—average
31% (95% confidence interval (CI): 19–42%) was observed
at 21 g/day of alcohol. Similarly, from 13 studies a
J-shaped relationship was apparent for beer (maximal
protection: 42% (95% CI: 19–58%) at 43 g/day of alcohol).
From 12 studies reporting separate data on wine or beer
consumption, two closely overlapping dose–response
curves were obtained (maximal protection of 33% at 25
g/day of alcohol). This meta-analysis confirms the J-shaped
association between wine consumption and vascular risk
and provides, for the first time, evidence for a similar
relationship between beer and vascular risk. In the metaanalysis of 10 studies on spirit consumption and vascular
risk, no J-shaped relationship could be found.
S. Costanzo A. Di Castelnuovo M. B. Donati L. Iacoviello (&) G. de Gaetano
Laboratory of Genetic and Environmental Epidemiology,
Research Laboratories, Fondazione di Ricerca e Cura ‘‘Giovanni
Paolo II’’, Largo Gemelli 1, 86100 Campobasso, Italy
e-mail: [email protected]
Keywords Meta-analysis Alcohol Cardiovascular
disease Mortality
Introduction
The relationship between alcohol consumption and cardiovascular events or all-cause mortality in apparently
healthy people or cardiovascular patients has been depicted as a J-shaped curve attributed to a dose-related combination of beneficial and harmful effects [1–7]. Numerous
mechanisms have been proposed that mediate the protective effect of alcohol (ethanol) in cardiovascular disease
(e.g., increased levels of high-density lipoprotein cholesterol, decreased levels of low-density cholesterol, reduction in platelet aggregation, beneficial effects on
inflammation) [8, 9]. On the other hand, anti-atherogenic
and anti-thrombotic effects and regulation of endothelial
function were mainly ascribed to polyphenolic and phenolic constituents of (red) wine [10] and beer [11, 12],
respectively.
The influence of separate wine or beer consumption on
health outcomes has been examined in various conditions:
while experimental studies suggest an alcohol-independent
protective role of wine-derived polyphenols on cardiovascular risk [10], epidemiological evidence of a greater effect
of wine versus beer or spirits is lacking. In 2002, some of
us performed a meta-analysis focused on this issue [2] and
observed a J-shaped relationship for increasing wine consumption and vascular risk; however a similar association
for beer could not be established. In the following years,
additional studies have been published (especially on beer
consumption) and a new statistical method tailored for
meta-analytic investigation of non-linear dose–response
effects became available [13].
123
834
S. Costanzo et al.
Therefore, the aim of this study was to update (increased
number of studies), to improve (more refined methodology
of analysis), and to extend (including spirits as a third type
of alcoholic beverage) our previous meta-analysis on the
relationship between alcoholic beverages consumption and
vascular risk and to include (when possible) the clinical
endpoints of cardiovascular and total mortality.
Materials and methods
Search strategy and data extraction
Our meta-analysis was performed in accordance with the
‘‘meta-analysis of Observational Studies in epidemiology’’
reporting guidelines [14]. Articles were retrieved until
March 2011, by search in PUBMED and EMBASE using
at least one of the following terms alcohol, wine, beer,
liquor, spirits in combination with, cardiovascular disease
mortality, morbidity, survival, and death, supplemented by
references of the retrieved articles and reviews. Studies
were excluded if they were not in English, or only considered one category of risk (i.e., drinkers versus notdrinkers), or mortality for specific causes (except vascular
mortality) or when the reference category was not the one
with the lowest intake or when relative risks or numbers of
Fig. 1 Flow chart of the
selected studies
cases and person-years were not available. In case of
multiple reports, data from the longer follow-up were
considered.
A check of abstracts identified by electronic searches
using the aforementioned keywords and consequently a full
text revision of selected articles considering the inclusion
and exclusion criteria was performed. Ninety-seven publications were identified (Fig. 1); two of us independently
reviewed articles and agreed to select 18 studies [15–32].
Events for vascular mortality included cardiovascular disease (CVD), coronary heart disease (CHD) and ischemic
heart disease (IHD), whereas non-fatal vascular events
comprised acute myocardial infarction (AMI), stroke and
CHD. Four studies reported results separately for all-cause
and vascular mortality [19, 22, 31, 32], two for fatal and
non-fatal vascular disease [15, 16], 10 for non-fatal vascular disease (AMI, stroke, CHD, CVD) [17, 18, 20, 23–25,
27, 29, 30], one for all-cause [26] and two for CHD mortality as unique endpoint [21, 28] (Tables 1 and 2). In
relation to beverage type, 11 studies investigated the
effects of wine, beer and spirits, 2 studies investigated the
effects of wine and beer, four studies wine and one study
beer only (Table 2).
In seven studies, former drinkers had been excluded
from reference group, whereas in other 7 studies, either the
inclusion or the exclusion of former drinkers from
97 publications identified by electronic searches using key-words
46 excluded, as considered only alcohol intake
17 excluded, as considered only one category of risk (drinkers vs not-drinkers)
2 excluded, as considered as outcomes not relevant
2 excluded, as no observational studies
9 excluded, as the reference category was not the one with lowest intake
or the relative risks or number of cases and person years were not available
3 excluded, as multiple reports
18 publications included in the analysis
123
Type of
study
Prospective
Prospective
Case–control
Case–control
Prospective
Case–control
Prospective
Prospective
Case–control
Case–control
Prospective
First author,
year (Ref. #)
Yano et al.
1977 [15]
Stampfer et al.
1988 [16]
Bianchi et al.
1993 [17]
Tavani et al.
1996 [18]
Renaud et al.
1999 [19]
Bobak et al.
2000 [20]
Gronbaek et al.
2000 [21]
Theobald et al.
2000 [22]
Malarcher et al.
2001 [23]
Tavani et al.
2001 [24]
Mukamal et al.
2003 [25]
USA
Italy
USA
Sweden
Denmark
Czech
France
Italy
Italy
USA
USA
Country
12
22
25
15
4
6
Follow-up,
years
40–75 years
25–79 years
15–44 years
18–65 years
20–98 years
25–64 years
40–60 years
24–74 years
18–74 years
34–59 years
46–68 years
Age
Male
Both
Female
Both
Both
Male
Male
Male
Female
Female
Male
Sex
AMI
AMI
Stroke
Total mortality
CVD mortality
CHD mortality
AMI
Total mortality
CHD mortality
AMI
AMI
Fatal non-fatal
CHD
Fatal non-fatal
CHD
Endpoint
Table 1 Summary of the characteristics of 18 studies included in the present meta-analyses
Wine, beer,
spirits
Wine, beer
Wine, beer,
spirits
Wine
Wine, beer,
spirits
Beer
Wine
Wine, beer,
spirits
Wine
Wine, beer
Wine, beer,
spirits
Type of
alcoholic
beverage
1,418
507
224
283
117
1,075
202
2,080
260
787
298
320
294
No.
of
cases
38,077
478
392
1,828
24,523
735
36,250
959
685
87,526
7,705
Total
sample
size/No. of
controls
No
Not stated
No
No
Not stated
No
No
Not stated
Not stated
Not stated
Yes
Former
drinkers in
reference
group
Age, smoking, BMI; diabetes,
hypertension, hypercholesterolemia,
a parental history of AMI; use or nonuse of aspirin; physical activity;
intake of energy; and energy-adjusted
intake of folate, vitamin E, saturated
fat, trans fat, and dietary fiber and for
all other types of beverage
Age, sex, education, BMI, cholesterol,
smoking, coffee, physical activity,
hyperlipidaemia, diabetes,
hypertension and family history of
AMI in first degree relatives
Age, race, education, smoking, BMI,
total cholesterol, HDL cholesterol,
history of hypertension, coronary
heart disease, diabetes and average
past alcohol intake in the past year
Sex, age, expected level of need, total
alcohol consumption
Types of alcohol, age, sex, smoking,
educational level, physical activity,
BMI
Age, district, smoking, education,
WHR, personal history of diabetes,
high cholesterol concentration
Age, smoking, education, BMI
Age, education, smoking, coffee intake,
BMI, serum cholesterol, history of
obesity, diabetes, hypertension,
hyperlipidaemia, family history of
AMI
Age, education, residence, smoking,
BMI, coffee intake, history of angina,
diabetes, hypertension,
hyperlipidaemia, history of heart
disease
Age
Age
Adjustment
Alcoholic beverages consumption and vascular risk
835
123
123
Prospective
Prospective
Prospective
Case–control
Prospective
Prospective
Prospective
Nielsen et al.
2004 [26]
Mukamal et al.
2006 [27]
Harriss et al.
2007 [28]
Schroder et al.
2007 [29]
Lu et al. 2008
[30]
Suadicani et al.
2008 [31]
Streppel et al.
2009 [32]
The
Netherlands
Danemark
Sweden
Spain
Australia
USA
Denmark
Country
40
16
11
11.4
9.2
24
Follow-up,
years
40–60 years
40–59 years
30–50 years
25–74 years
40–69 years
Male
Male
Female
Male
Both
separately
Both
Both
separately
[20 years
C65 years
Sex
Age
Total mortality
CVD mortality
Total mortality
IHD mortality
AMI
AMI
CVD mortality
CHD
Total mortality
Endpoint
Wine, beer,
spirits
Wine
Wine, beer,
spirits
Wine, beer,
spirits
Wine, beer,
spirits
Wine, beer,
spirits
Wine, beer,
spirits
Type of
alcoholic
beverage
1,130
628
1,204
197
170
244
400
675
7,208
No.
of
cases
1,373
3,022
45,449
1,270
38,200
4,410
14,223
Total
sample
size/No. of
controls
Not stated
Not stated
Yes
Yes
No
No
Yes
Former
drinkers in
reference
group
Former drinking, energy intake without
alcohol, number of cigarettes
smoked, cigarette smoking duration,
cigar or pipe smoking, intake of
vegetables, fruit, fish, saturated and
trans fatty acids, body mass index,
prevalence of AMI, stroke, diabetes
mellitus and cancer, baseline
socioeconomic status and total
alcohol intake
Age
Age, BMI, education, smoking, parity
and age at first birth, used OCs
Age and other alcoholic beverages
Male: age, country of birth, smoking,
total daily energy and fruit intake.
Female: age, country of birth,
smoking, total daily energy and
saturated fat intake. All beverages
were analysed simultaneously
Age, sex, race, education, marital
status, smoking, exercise intensity,
depression score, frequent aspirin
use, BMI, diabetes and intake of
other two beverage types
Consumption of other beverage types,
smoking, BMI, physical activity,
cohabitation, income and education
Adjustment
AMI acute myocardial infarction, BMI body mass index, CHD coronary heart disease, CVD cardiovascular disease, IHD ischemic heart disease, OC oral contraceptive, WHR waist to hip ratio
Type of
study
First author,
year (Ref. #)
Table 1 continued
836
S. Costanzo et al.
Alcoholic beverages consumption and vascular risk
reference group was mentioned (Table 1); in 3 studies the
reference group included occasional but not former drinkers [19, 20, 22].
The amount of alcohol (grams) in a ‘‘drink’’ was taken
as quantified by each article. Adjusted relative risks (RR)
for each categories of alcohol consumption were extracted
(four studies reported RR adjusted for age only [15, 16, 29,
31] (Table 2)).
837
determined the asymmetry of the funnel plot. We assessed
the quality of each study using both the Newcastle-Ottawa
Scale [38] and a quality scale that also considered the
assessment of alcohol drinking [39]. Estimations of the
metrics ‘‘maximal protection’’ and ‘‘reversion point’’ from
the pooled dose–response curves were used to help data
interpretation. Imprecision in the evaluation of these metrics from fitting of data is unavoidable; thus, point estimates
of these parameters should not be emphasized.
Data analysis
Data collected were: (a) the value x of alcohol intake
(g/day) assigned as the midpoint of the reported ranges;
x was defined as 1.2 times the lower boundary for the openended upper categories [33]; (b) frequency counts, adjusted
RR, and 95% CI for each x level; (c) covariates describing
the characteristics of the study. Inverse-variance-weighed
methods, taking into account the correlation between estimates within each study, were used [33]. The models to be
fitted were selected among fractional polynomial curves of
the second order [33]. Fractional polynomials are a family
of models considering power transformations of a continuous exposure variable, restricted to a predefined set of
integer and non integer exponents [34]. The regression
models were log(RR|x) = b1xp ? b2xq and the exponents p
and q were selected among the set: (-2, -1, -0.5, 0, 0.5, 1,
2). When p = 0, xp is replaced by log(x), and when p = q
the model becomes log(RR|x) = b1xp ? b2xqlog(x) [13].
The best fit was defined as that with the highest likelihood.
To consider differences among studies as a further source of
random variability, an additional component of the variance
was added in weighing each observation (random-effects
model). In sensitivity analysis, comparison of two hierarchical models was tested by the likelihood ratio test
including or not in the models the interaction terms between
the covariates (design of study, country setting, duration of
follow-up) and alcohol intake (amount) [35]. To make some
allowance for multiple comparisons, 95% CIs were used in
subgroup analyses, and pairwise contrasts were adjusted
following the Sidak method, as outlined by Ludbrook [36].
All analyses were carried out using a SAS macro [13] (SAS,
9.1.3 for Windows, Cary, NC: SAS Institute Inc. 1989). The
hypothesis that publication bias might affect the validity of
the estimates was tested by a funnel-plot-based approach. A
simple test of asymmetry of the funnel plot was used
according to the method proposed by Egger et al. [37]. The
symmetry of funnel plots was measured applying the following linear model: RRj/se(RRj) = a ? c*1/se(RRj),
where RRj/se(RRj) is the standard normal deviate (RR
divided by its standard error); 1/se(RRj) the precision of the
estimate; and a and c are the unknown parameters of the
model. The correction for publication bias was performed
pooling studies after the exclusion of the ones that
Results
From ninety-seven identified publications 79 studies were
excluded with the criteria shown in Fig. 1. More than half
were excluded since they did not distinguish wine, beer or
spirits intake (n. 46) or only compared abstention with a
unique category of alcohol intake (n. 17).
The main characteristics of the 18 studies included in
this analysis are reported in Tables 1 and 2.
Wine consumption and fatal or non-fatal vascular
events
From 16 studies [15–19, 21–25, 27–32] (11 prospective
studies involving 288,363 individuals with 5,554 combined
fatal or non-fatal cardiovascular events and 5 case–control
studies involving 2,060 cases and 3,784 controls), 17 dose–
response independent relationships were obtained for wine
consumption and vascular risk, since one study reported
results separately for men and women [28]. Symmetric
funnel plots (a = 0) were obtained for 12.5–25 and
25–60 g/day categories of alcohol intake (Fig. 2a); for the
1–12.5 category a slightly deviation from symmetry was
observed (a = 0, P = 0.009). The best-fitting model was
obtained when p = q = 0.5, corresponding to the model:
Log(RR) = b1Hx ? b2Hx*log(x), for both the fixed and
random models. The deviances of fixed and random effects
models fell from 131.89 to 30.39 (P \ 0.001 for difference), suggesting heterogeneity among studies. In subsequent analyses, using a random effects model with
p = q = 0.5, we explored the possible role of study characteristics in explaining the inter-study heterogeneity. Fitted parameters for the random model were b1 = -0.20
(SE = 0.059; P \ 0.001) and b2 = 0.04 (SE = 0.015;
P = 0.004) (Table 3). The relationship observed has to be
interpreted as a J-shaped curve; the association with a
lower vascular risk was apparent up to 72 g/day and the
lowest risk was seen at 21 g/day, (RR = 0.69; 95% CI:
0.58–0.82) (Fig. 3). After the exclusion of studies determining the asymmetry in the funnel plot [16, 28, 29] and
then studies only adjusted for age [15, 16, 29, 31], the
J-shape curve was confirmed (Table 3).
123
123
Fatal non-fatal CHD
AMI
AMI
CHD mortality,
Stampferet al. 1988 [16]
Bianchi et al. 1993 [17]
Tavani et al. 1996 [18]
Renaud et al. 1999 [19]
Bobak et al. 2000 [20]
Fatal non-fatal CHD
Yano et al. 1977 [15]
AMI
Total mortality
Endpoint
First author, year (Ref. #)
0.9
0.7
0.6
4–6 drinks/day
6–7 drinks/day
[7 drinks/day
0.69
0.85
1.08
33–54 g/day
55–98 g/day
99–131 g/day
C131 g/day
0.80
0.67
0.71
1.01
1.41
1.81
1–21 g/day
22–32 g/day
33–54 g/day
55–98 g/day
99–131 g/day
C131 g/day
1
0.52
22–32 g/day
0
0.99
0.55
1–21 g/day
1
0.9
2–4 drinks/day
0
1
B 2 drinks/day
1.7
2.4
2–3 drinks/day
[3 drinks/day
1
1
1–2 drinks/day
0
1
0.8
0
0.4
C53 mL/day
B1 drink/day
1
0.9
0
0.71
C2 mL/day
1–53 mL/day
1
0.67
0
1 mL/day
1.5–2.18
1.02–1.96
0.89–1.16
0.63–0.82
0.58–0.77
0.67–0.95
0.61–1.91
0.31–2.34
0.48–0.98
0.36–0.74
0.37–0.81
0.67–1.48
0.4–1
0.3–1.5
0.6–1.4
0.7–1.3
0.7–1.4
1–5.7
0.8–3.5
0.6–1.5
0.5–1.2
0.2–0.8
0.7–1.2
0.44–1.16
0.4–1.1
0.65
0.34
0.54
0.5–3.9 L/week
4–8.9 L/week
C9 L/week
1
0.9
[1 drink/day
\0.5 L/week
1
1
1 drink/day
0
0.3
1
[106 mL/day
1
0.57
0.74
1
RR
1–106 mL/day
0
C300 mL/day
1–299 mL/day
0
Intake
95% CI
Intake
RR
Beer
Wine
0.25–1.14
0.19–0.61
0.42–1
0.6–1.4
0.7–1.3
0.6–1.6
0.2–0.8
0.42–0.77
0.57–0.97
95% CI
[1 drink/day
1 drink/day
0
C3 mL/day
1–2 mL/day
0
Intake
Spirits
1.0
1.0
1
0.71
0.93
1
RR
Table 2 Relative risks (RR) and 95% confidence interval (CI) for several clinical outcomes at different levels of alcoholic beverages intake as reported by authors (18 studies)
0.6–1.8
0.8–1.3
0.51–0.99
0.69–1.25
95% CI
838
S. Costanzo et al.
CHD mortality
CVD mortality
Gronbaek et al. 2000 [21]
Theobald et al. 2000 [22]
AMI
AMI
Total mortality
Tavani et al. 2001 [24]
Mukamal et al. 2003 [25]
Nielsen et al. 2004 [26]
Male
Female
Stroke
Malarcher et al. 2001 [23]
Total mortality
Endpoint
First author, year (Ref. #)
Table 2 continued
1
0.9
0.8
0.93
0.9
Weekly
1–2 drinks/day
[2 drinks/day
0.75
0.78
1–2 drinks/day
[2 drinks/day
Montly
0.79
Weekly
Never/rarely
1
0.87
0.64
C15 g/day
Never/rarely
1.48
10–14.9 g/day
Montly
1.06
0.1–9.9 g/day
0.5
[3 drinks/day
1
0.5
1–3 drinks/day
0
1
0.7
1.85
C12 g/day
0
0.57
12 g/week–12 g/day
B1 drink/day
1
1.51
C140 g/week
0.56
0.59
0
0.54
50–139 g/week
\12 g/week
1
1.49
C140 g/week
0
0.41
1–49 g/week
0.57
50–139 g/week
0.75
[21 drinks/week
1
0.64
8–21 drinks/week
0
0.74
1–49 g/week
1
0
1–7 drinks/week
0.64–1.25
0.77–1.12
0.71–0.9
0.83–0.98
0.52–1.15
0.61–0.92
0.69–0.91
0.79–0.96
0.32–1.29
1.05–2.09
0.85–1.19
0.3–0.8
0.3–0.8
0.4–1
0.31–10.94
0.25–1.29
0.3–1.04
0.46–4.97
0.35–0.98
0.32–0.88
0.19–11.74
0.16–1.06
0.27–1.2
0.39–1.45
0.48–0.84
0.63–0.86
[2 drinks/day
1–2 drinks/day
Weekly
Montly
Never/rarely
[2 drinks
1–2 drinks
Weekly
Montly
1.14
0.91
0.95
0.86
1
1.31
1.07
1.01
0.98
1
0.34
[50 g/day
Never/rarely
0.57
0.78
0.93
15–49.9 g/day
10–14.9 g/day
0.1–9.9 g/day
1
0.4
[1 drink/day
0
0.6
1
0.73
1.67
0.75
1
0.78
0.63
0.78
1
RR
B1 drink/day
0
C12 g/day
12 g/week–12 g/day
\12 g/week
0
[21 drinks/week
8–21 drinks/week
1–7 drinks/week
0
Intake
95% CI
Intake
RR
Beer
Wine
1.02–1.27
0.81–1.02
0.85–1.06
0.77–0.97
0.92–1.88
0.91–1.25
0.9–1.14
0.88–1.08
0.12–0.92
0.37–0.89
0.61–1.01
0.83–1.04
0.3–0.7
0.4–0.9
0.29–1.84
0.86–3.24
0.39–1.44
0.58–1.05
0.52–0.77
0.67–0.91
95% CI
[2 drinks
1–2 drinks
Weekly
Montly
Never/rarely
[2 drinks
1–2 drinks
Weekly
Montly
Never/rarely
[50 g/day
15–49.9 g/day
10–14.9 g/day
0.1–9.9 g/day
0
C12 g/day
12 g/week–12 g/day
\12 g/week
0
[21 drinks/week
8–21 drinks/week
1–7 drinks/week
0
Intake
Spirits
1.12
0.93
1.02
0.91
1
1.13
1.14
1.03
0.92
1
0.54
0.67
0.79
1.03
1
2.18
2.53
1.04
1
1.12
0.78
0.97
1
RR
0.92–1.37
0.81–1.07
0.91–1.13
0.83–0.99
0.74–1.74
0.96–1.36
0.89–1.18
0.83–1.02
0.31–0.92
0.53–0.84
0.66–0.95
0.91–1.16
0.68–7.04
1.15–5.57
0.55–1.98
0.55–2.28
0.59–1.03
0.83–1.12
95% CI
Alcoholic beverages consumption and vascular risk
839
123
123
CHD
CVD mortality
Mukamal et al. 2006 [27]
Harriss et al. 2007 [28]
IHD mortality
Suadicani et al. 2008 [31]
Total mortality
CVD mortality
1
0.73
1.21
0
C20 g/day
2.2
C20 g/day
\20 g/day
1
0.68
0
0.9
0.9
[8 drinks/week
\20 g/day
1
0
1–8 drinks/week
0.6
0.7
1–8 drinks/week
[8 drinks/week
0.7
1
0.8
B 100 mL/week
[ 100 mL/week
0
1
0.3
C20 g/day
0
1
0.94
[40 g/day
0.21
0.72
20–40 g/day
0
0.88
\20 g/day
1
0–20 g/day
0.43
[10 g/day
None
1
0.59
0.70
C7 drinks/week
None
0.95
1–6 drinks/week
0–10 g/day
1
0.71
0
\1 drink/week
0.17–8.82
0.62–0.87
0.3–16.4
0.53–0.86
0.7–1.09
0.7–1.06
0.5–1.2
0.4–0.96
0.5–1
0.5–1.1
0.16–0.56
0.12–0.35
0.55–1.60
0.45–1.16
0.65–1.21
0.23–0.78
0.36–0.95
0.44–1.11
0.69–1.30
0.54–0.93
C20 g/day
\20 g/day
0
C20 g/day
\20 g/day
0
[ 200 mL/week
B 200 mL/week
0
C20 g/day
\20 g/day
0
[40 g/day
20–40 g/day
0–20 g/day
None
C7 drinks/week
1–6 drinks/week
\1 drink/week
0
Intake
95% CI
Intake
RR
Beer
Wine
1.37
0.98
1
1.26
0.91
1
0.7
0.7
1
0.22
0.17
1
0.74
1.25
1.24
1
0.71
0.89
1.07
1
RR
0.74–2.53
0.83–1.17
0.55–2.88
0.72–1.14
0.5,1
0.5–1
0.09–0.52
0.09–0.31
0.37–1.48
0.78–2.02
0.9–1.71
0.43–1.19
0.60–1.31
0.80–1.43
95% CI
AMI acute myocardial infarction, CHD coronary heart disease, CI confidence interval, CVD cardiovascular disease, IHD ischemic heart disease, RR relative risk
Streppel et al. 2009 [32]
AMI
Lu et al. 2008 [30]
Total mortality
AMI
Schroder et al. 2007 [29]
Male
Female
Endpoint
First author, year (Ref. #)
Table 2 continued
C20 g/day
\20 g/day
0
C20 g/day
\20 g/day
0
[ 16 mL/week
B 16 mL/week
0
C20 g/day
\20 g/day
0
[20 g/day
10–20 g/day
0–10 g/day
None
C7 drinks/week
1–6 drinks/week
\1 drink/week
0
Intake
Spirits
1.09
0.97
1
0.88
0.93
1
0.7
0.8
1
0.81
0.23
1
2.57
0.89
1
1
0.89
1
1.10
1
RR
0.69–1.73
0.8–1.18
0.47–1.64
0.7–1.24
0.4–1
0.5–1.1
0.3–2.2
0.12–0.44
1.19–5.56
0.36–2.18
0.74–1.35
0.61–1.30
0.71–1.40
0.82–1.48
95% CI
840
S. Costanzo et al.
Alcoholic beverages consumption and vascular risk
841
Fig. 2 Funnel plot for different intake categories (1–12.5 g/day, 12.5–25 g/day, 25–60 g/day) for meta-analyses on wine (a), beer (b) and spirit
(c) consumption and vascular risk
In quality analyses, using both scales (The NewcastleOttawa Scale [38] and the score used by Tramacere et al.
[39]), no heterogeneity of results was found according to
the stratification of studies in low and high quality (data
not shown).
When subgroup analyses were performed separately
considering cohort or case–control studies, the maximal
protection of about 30% in the range of 20–25 g/day of
alcohol was confirmed in both pooled data (Table 3,
P = 0.7). Pooled analyses of 6 studies [19, 22, 23, 25, 27,
28] that formally excluded former drinkers from the reference category, confirmed the maximal protection (28%;
95% CI: 9–44%) at moderate wine consumption against
vascular risk (Table 3). In sensitivity analyses separately
investigating the relationship between wine consumption
and vascular events in 5 Mediterranean [17–19, 24, 29], 5
Northern European [21, 22, 30–32] and 6 Western (USA
and Australia) [15, 16, 23, 25, 27, 28] countries, the
J-shape curves were confirmed and appeared to be very
similar among them (Sidak-adjusted P values for pairwise
comparisons among countries were not statistically significant (Table 3)). Among cohort studies, the curves for
short and long duration of follow-up were different
(P \ 0.001); in particular, b1 was greater in shorter followup studies analysis, whereas b2 was equal (Table 3). As a
consequence, the pooled curves for the duration of followup were different for the range at which alcohol remained
protective but comparable regarding the maximum protection at ligher doses.
Wine consumption and cardiovascular mortality
Six cohort studies [19, 21, 22, 28, 31, 32], involving
105,196 individuals (2,677 cardiovascular deaths), provided seven dose–response independent relationships for
alcohol intake and cardiovascular mortality. The best-fitting model was obtained when p = q = 0.5 for both the
fixed and random models. Deviances of fixed and random
effects models fell from 18.0 to 6.2 (P \ 0.001 for difference), indicating heterogeneity among studies. An
overall J-shaped curve was obtained from the seven
adjusted dose–response curves; the maximal protection was
34% at 24 g/day in the random-effects model (Table 3 and
Fig. 4).
Wine consumption and mortality for any cause
Five cohort studies [19, 22, 26, 31, 32] (56,696 individuals
and 11,905 deaths for any-cause) gathered information on
wine consumption and total mortality and provided six
123
123
USA and Australia
105,196
6
Total mortality
11,905
56,696
25
34
35
25
14–34
18–47
14–51
6–38
4–44
9–53
11–49
9–44
11–37
11–36
2–52
16–42
19–42
10
24
24
8
7
10
25
24
27
28
21
24
21
41
66
66
18
15
20
70
54
72
72
56
72
–0.20
–0.23
–0.23
–0.20
–0.23
–0.30
–0.20
–0.18
–0.14
–0.14
–0.20
–0.19
–0.20
b1
P for difference = 0.7
0.05
0.05
\0.001
0.05
0.05
0.06
0.07
0.04
0.03
0.03
0.03
0.04
0.001
0.007
0.02
0.03
0.034
0.017
0.01
0.008
0.009
0.08
0.04
0.04
\0.001
\0.001
b2
P
0.01
0.02
0.02
0.03
0.04
0.05
0.02
0.02
0.01
0.01
0.03
0.01
0.01
SE
0.007
0.021
0.07
0.08
0.09
0.04
0.04
0.03
0.04
0.1
0.006
0.004
\0.001
P
\0.001
\0.001
\0.001
\0.001
\0.001
0.12
\0.001
\0.001
\0.001
\0.001
\0.001
\0.001
\0.001
P for
heterogeneity
c
P for difference \ 0.001
Sidak-adjusted P value for pairwise comparisons among countries Mediterranean countries versus Nordic countries P = 0.97; Mediterranean countries versus USA and Australia P = 0.88;
Nordic countries versus USA and P = 0 0.98
b
a
0.04
0.08
0.09
0.1
0.12
0.16
0.10
0.08
0.06
0.06
0.14
0.06
0.06
SE
Parameters of the best fitted model
Log(RR) = b1Hx ? b2Hx*log(x)
CHD coronary heart disease, CI confidence interval, CVD cardiovascular disease, IHD ischaemic heart disease, RR relative risk
7
5
CVD, CHD, IHD mortality
7
Long ([12 years)
24
32
28
25
25
31
30
31
g/day
g/day
%
95% CI
Reversion
point
Maximal protection
7
2,677
3,784
288,363
Total sample
size/no of
controls
35
Short (B12 years)
Duration of follow-upc
2,060
5,554
No of
cases
5
5
Nordic countries
7
Without former drinkers
13
14
5
Countryb
Mediterranean countries
Reference group
Excluding studies adjusted only for age
Adjustment
Excluding studies which provided
the asymmetry in the funnel plot
Publication bias
Case control studies
Cohort studies
12
17
Fatal and non-fatal CVD
Study designa
No of
curves
Endpoint
Table 3 Characteristics and results of the best fitting models: meta-analysis of wine consumption
842
S. Costanzo et al.
Alcoholic beverages consumption and vascular risk
843
Fig. 3 Pooled curves of relative
risk (95% CI: dotted lines) of
fatal and non-fatal vascular
events and wine intake,
extracted from 17 independent
relationships using random
models
dose–response independent relationship, since one study
reported results separately for men and women [26]. Random effect model was performed, using the model:
Log(RR) = b1Hx ? b2Hx*log(x) (P \ 0.001 for difference random vs. fixed models). In these studies, a J-shape
curve was confirmed, with 25% maximal risk reduction at
approximately 10 g/day and significant protection up to
41 g/day (Table 3 and Fig. 5).
Beer consumption and fatal or non-fatal vascular events
Thirteen studies [15, 16, 18, 20, 21, 23–25, 27–30, 32] (8
prospective studies involving 224,219 individuals (4,823
events) and five case–control studies involving 1,964 cases
and 3,834 controls) provided 13 dose–response independent relationships for beer consumption and fatal or non
fatal vascular events. Symmetric funnel plots (a = 0) were
obtained for all the categories of beer intake, showing the
absence of publication bias (Fig. 2b). The best-fitting
model was obtained when p = q = 1, corresponding to the
model: Log(RR) = b1x ? b2x*log(x), for both the fixed
and random models. The deviances of fixed and random
effects models fell from 104.6 to 32.8 (P \ 0.001 for difference), suggesting heterogeneity among studies. Using a
random effects model with p = q = 1, the possible role of
study characteristics was explored to explain the interstudy heterogeneity. Fitted parameters for the random
model were b1 = -0.06 (SE = 0.02; P = 0.009) and
b2 = 0.01 (SE = 0.007; P = 0.04) (Table 4). The relationship observed was interpreted as a J-shaped curve; the
association with a lower vascular risk was apparent up to
55 g/day and the lowest risk was seen at 43 g/day
(RR = 0.58; 95% CI: 0.42–0.81; Table 4 and Fig. 6).
In quality analyses, using both scales mentioned above,
no heterogeneity of results was found according to the
stratification of studies in low and high quality (data not
shown). A J-shape relationship between beer consumption
and vascular risk was also confirmed by pooling data from
case–control studies, with a maximal protection of about
60% at 36 g/day of alcohol (Table 4). However, performing a sensitivity analysis excluding the three studies only
adjusted for age [15, 16, 29] or a sub-group analysis of 5
studies [20, 23, 25, 27, 28] that formally excluded former
drinkers from the reference category, or by country categorization (Mediterranean [18, 24, 29], Northern European
[20, 21, 30, 32] and Western [15, 16, 23, 25, 27, 28]
countries), the characteristic J-shape relationship for beer
consumption and vascular risk was no more apparent
(Table 4).
As a small number of studies only investigated the
relationship between beer consumption and cardiovascular
[21, 28, 32] and/or total mortality [26, 32], it was not
possible to perform any meta-analysis related to these
clinical end-points.
Comparison of wine and beer consumption in relation
to vascular risk
From 12 studies [15, 16, 18, 21, 23–25, 27–30, 32] (8
prospective studies involving 224,219 individuals (4,823
events) and four case–control studies involving 1,762 cases
and 3,099 controls) that reported separate data both on
123
844
S. Costanzo et al.
Fig. 4 Pooled curves of relative
risk (95% CI: dotted lines) of
fatal and cardiovascular
mortality and wine intake,
extracted from seven
independent relationships using
random models
Fig. 5 Pooled curves of relative
risk (95% CI: dotted lines) of
fatal and all-cause mortality and
wine intake, extracted from six
independent relationships using
random models
wine and beer consumption in relationship with vascular
risk, two similar dose–response curves were obtained
(P = 0.4, Table 5 and Fig. 7). The two curves were closely
overlapping, especially at light-moderate alcohol consumption and the maximal protection by either beverage
was 33% at 25 g/day (Table 5 and Fig. 7). This similarity
between wine and beer’s protection persisted even when
the studies that did not simultaneously adjust for different
types of alcoholic beverages or total amount of alcohol,
were excluded (Table 5, P = 0.2).
123
Spirit consumption and fatal and non-fatal vascular
events
In a meta-analysis of 10 studies [15, 18, 21, 23, 25, 27–30,
32] on spirit consumption and vascular risk (seven prospective studies involving 136,693 individuals (4,523
events) and three case–control studies involving 1,255 cases
and 2,621 controls), no J-shaped relationship could be found
(Fig. 8). Symmetric funnel plots (a = 0) were obtained for
all the categories of spirit intake, showing the absence of
36
34–64
60
6
USA and Australia
CI confidence interval, CVD cardiovascular disease, RR relative risk
3
4
Mediterranean countries
Nordic countries
Without former drinkers
Countrya
5
10
Excluding studies adjusted only for age
Reference group
Adjustment
224,219
3,834
1,964
5
4,823
8
Cohort studies
a
Sidak-adjusted P value for pairwise comparisons among countries Mediterranean countries versus Nordic countries P = 0.14; Mediterranean countries versus USA and Australia P = 0.4; Nordic countries versus USA and
P = 0.16
\0.001
0.01
-0.02
0.03
0.3
0.002
0.4
\0.001
\0.001
0.3
0.2
0.05
0.01
0.03
-0.14
0.1
0.2
0.15
0.03
-0.008
0.04
0.4
0.009
0.4
0.008
-0.001
0.2
0.006
0.005
0.09
0.02
-0.03
-0.05
\0.001
\0.001
\0.001
\0.001
0.04
0.03
-0.03
845
50
-0.11
0.2
0.008
0.01
0.006
0.02
0.2
0.004
0.02
\0.001
0.04
0.007
0.01
0.009
0.02
-0.06
55
43
13
Study design
Fatal and non-fatal CVD
Case control studies
95% CI
19–58
42
b2
P
SE
b1
g/day
%
g/day
Reversion point
Maximal protection
Total sample size/
No of controls
No of
cases
No of
curves
Endpoint
Table 4 Characteristics and results of the best fitting models: meta-analysis of beer consumption
Parameters of the best fitted model
Log(RR) = b1x ? b2x*log(x)
SE
P
P for
heterogeneity
Alcoholic beverages consumption and vascular risk
publication bias (Fig. 2c). Neither the first nor the second
order terms of the model Log(RR) = b1Hx ?
b2Hx*log(x) were statistically significant, the fitted parameters for the random model being b1 = -0.01 (SE = 0.10;
P = 0.4) and b2 = -0.005 (SE = 0.03; P = 0.4).
As a small number of studies only investigated the
relationship between spirits consumption and cardiovascular [21, 28, 32] and/or total mortality [26, 32], it was not
possible to perform any meta-analysis related to these
clinical end-points.
Discussion
A previous meta-analysis had shown a clear inverse dose–
effect curve against vascular events for wine but not for
beer intake [2]. Evidence from the current updated and
extended meta-analysis confirms the significant reduction
of overall vascular risk associated with wine consumption
and shows, apparently for the first time, a similar J-shaped
relationship between beer intake and cardiovascular risk.
Moreover, the comparison of studies which included a
parallel, separate evaluation of wine and beer consumption,
indicates a similar protecting effect of either beverage
against cardiovascular risk (Fig. 7).
Thus, in relation to health, drinking in moderation is
more important than the content of the bottle, at least when
wine and beer are taken into consideration.
On the contrary, no statistically significant association
with vascular events was apparent for the intake of spirits
up to 60 g/day, which is the maximum dose investigated in
the 10 studies included in this meta-analysis. In several
studies spirit consumption mostly occurred as binge
drinking (defined as the consumption of three or more
drinks within 1–2 h) and was restricted to only few days
per week. This may explain the absence of association
between moderate spirit consumption and cardiovascular
disease observed, in contrast, for the other two alcoholic
beverages both in the present meta-analysis and in a previous study [40]. It is known that drinking out of mealtimes
and binge drinking are associated with increased CHD risk
[41–44], both behaviours being preferentially linked to the
type of alcoholic beverage consumed [45–47].
Moderate alcohol drinking reportedly induces healthy
changes in lipid profile, vascular, haemostatic and endothelial cell function, platelet aggregation and inflammation
[8, 9]. On the other hand, beer and wine contains different
substances that might provide additional cardiovascular
benefit to that obtained by alcohol. If liquor -the drink with
the purest concentration of alcohol - does not clearly
decrease vascular events (the negative association between
spirit intake and vascular events was non-significant in the
present meta-analysis), it should not lead us to the
123
846
S. Costanzo et al.
Fig. 6 Pooled curves of relative
risk (95% CI: dotted lines) of
fatal and non-fatal vascular
events and beer intake,
extracted from 13 independent
relationships using random
models
Table 5 Results of best fitting models of meta-analysis of studies reported data both on wine and beer consumption in relationship with vascular
risk
No of
curves
Maximal protection
%
95% CI
g/day
Reversion
point
g/day
Parameters of the best fitted model Log(RR) = b1Hx ? b2Hx*log(x)
b1
SE
P
b2
SE
P
P for heterogeneity
Wine consumption
12
32
18–44
25
70
-0.19
0.07
0.003
0.04
0.02
0.03
\0.001
Beer consumption
12
33
13–48
25
43
-0.17
0.10
0.04
0.03
0.03
0.2
\0.001
Adjusted studies for different types of alcohol beverages or total amount of alcohol intake
Wine consumption
7
-0.22
0.15
0.06
0.05
0.05
0.2
\0.001
Beer consumption
7
-0.16
0.16
0.16
0.02
0.05
0.3
\0.001
CI confidence interval, RR relative risk
conclusion that polyphenolic constituents found in wine or
beer are (mainly) responsible for the beneficial effect on
vascular events [9–12, 48, 49]. In fact the proportion of
subjects consuming liquors is much lower than that consuming wine or beer and patterns of liquor consumption are
very different. We cannot therefore exclude that the negative association of wine and beer drinking with cardiovascular events could be (mainly) due to ethanol itself.
Effects of different alcoholic beverages on different
clinical outcomes
We tried to dissect the potential benefit of wine or beer
consumption on different clinical end-points. Both wine
and beer consumption were comparable as far as the
reduction of the risk of combined fatal and non fatal cardiovascular events was concerned. Wine drinking was also
effective in reducing both cardiovascular and total
123
mortality. The maximum intake of wine at which protection was still apparent decreased from 72 to 66 to 41 g/day
when either combined fatal and non fatal vascular events,
or cardiovascular mortality or total mortality were considered as endpoint, respectively. At variance, the minimal
doses of wine at which its maximal protection could be
obtained were 21, 24 and 10 g/day, respectively. Thus,
while low-moderate doses are similarly protective against
any clinical endpoint considered, the hardest the endpoint,
the lowest the amount of wine that starts to be associated
with harm. The maximum protection obtained at lightmoderate wine intake gradually vanishes at higher doses
that differ according to different clinical endpoints, possibly because of increase in harmful collateral effects.
Unfortunately, the very limited data available about
either beer or spirit consumption in relation to cardiovascular or total mortality, did not allow us to perform a fully
meta-analytic investigation on the latter two beverages.
Alcoholic beverages consumption and vascular risk
847
Fig. 7 Curves for wine intake
(solid lines) and beer intake
(dotted lines) were extracted
from the same studies
Fig. 8 Pooled curves of relative
risk (95% CI: dotted lines) of
fatal and non-fatal vascular
events and spirit intake,
extracted from 10 independent
relationships using random
models
Limitations
All the studies included in our meta-analyses were observational, and could be themselves associated with a number
of limitations: the alcohol patterns assessed only once at
inclusion into the study, the absence of detailed history of
alcohol consumption behavior and the possible changes in
alcohol habits could have had an effect on the relation of
alcohol consumption with cardiovascular events. Randomized controlled trials would offer a more solid answer
than observational studies to many questions in medicine;
the latter are mainly restricted, however, to the efficacy of
drugs and are difficult and ethically questionable to perform to evaluate alcohol effects [4, 9]. On the other hand,
the results of well-designed observational studies (with
either a cohort or a case–control design) do not systematically overestimate the magnitude of the effects as compared with those in randomized, controlled trials on the
same topic [50]. In particular it is believed that selfreported wine or beer consumption is inaccurate. Underreporting on wine or beer drinkers would however result in
a tendency for relative risks to be biased toward the null
123
848
hypothesis, while our meta-analysis showed significant
associations. The potential confounding effect of combined
drinking of different types of alcoholic beverages in the
same population was excluded by pooling data from
studies that had taken this issue into consideration
(Table 5).
Wine drinkers, at least in some Countries, tend to have a
healthier lifestyle profile than beer drinkers. This uncontrolled confounding can be reasonably excluded, as the
great majority of studies were adjusted for these variables
(Table 1). Furthermore, a sensitivity analysis investigated
the relationship between wine or beer consumption and
vascular events in Mediterranean and not-Mediterranean
Countries, but did find comparable results among them
(Tables 3 and 4).
A weakness of all pooling studies on alcohol consumption is the heterogeneity among the reference groups,
which sometimes have included lifelong teetotallers, former drinkers and/or occasional drinkers [51]. In few articles of this meta-analysis, the Authors did not clearly state
if former or occasional drinkers were excluded from the
reference group; however, analysis of five studies on wine
consumption that formally excluded former drinkers confirmed the significant relation between drinking in moderation and vascular risk.
The results of any meta-analysis, especially in nonexperimental epidemiology, may be invalid due to publication bias [52]. The funnel plot analysis revealed symmetry for all categories of beer, spirit and wine intake,
except for the lowest category of wine intake, suggesting
the presence of a slight publication bias, if any. However,
after the exclusion of the studies which determined the
asymmetry in the funnel plot, the J-shape relationship
between wine consumption and vascular risk was
confirmed.
Alcohol may have different health effects in men and
women [3]. Unfortunately, the paucity of data separately
reported for either sexes, made it impossible to include
men or women in two distinct meta-analyses [2, 4].
Standing from previous data on total alcohol intake [3, 4]
optimal consumption of alcohol should be reduced in
women- 1 unit a day instead of 2 units in men. However, if
this difference holds separately for wine or beer remains to
be investigated.
Significant protection could be extrapolated from the
curves obtained up to doses of alcoholic beverages of 72 g/
day that must be no doubt considered as a heavy intake.
Besides the fact that the doses of alcohol associated with
maximum protection should be chosen rather than that at
which harm may start, the majority of the studies included
in our meta-analyses did not in fact investigate such a large
range of alcohol intake; the inferences from pooled curves
at larger amounts of alcohol were a mathematical trick
123
S. Costanzo et al.
rather than a finding derived from experimental data. On
the contrary, the conclusions obtained on the protection at
light-moderate alcohol intake are quite solid as they are
based on a very large amount of experimental data.
In conclusion, this meta-analysis provides further evidence for a J-shaped significant inverse association
between wine consumption and vascular risk and shows a
similar relationship for beer consumption. Dose–response
curves from comparable studies appeared substantially
similar for either alcoholic beverage. No protection was
apparent instead, in association with the consumption of
any spirit amount.
The hazards of excess or binge alcohol drinking should
be always highlighted and heavy or binge drinkers pushed
to cut their consumption to a regular, low-moderate level.
Acknowledgments Supported in part by Cervisia Consulenze and
Istituto Nazionale per la Comunicazione.
Conflict of interest This was an investigator-initiated study. The
partial sponsor of the study had no role in the selection of articles or
conduct of the analyses or drafting of the manuscript. We disclaim
any other relationships with industry that might pose a conflict of
interest in connection with the submitted article.
References
1. Corrao G, Rubbiati L, Bagnardi V, Zambon A, Poikolainen K.
Alcohol and coronary heart disease: a meta-analysis. Addiction.
2000;95(10):1505–23.
2. Di Castelnuovo A, Rotondo S, Iacoviello L, Donati MB, de
Gaetano G. Meta-analysis of wine and beer consumption in
relation to vascular risk. Circulation. 2002;105(24):2836–44.
3. Corrao G, Bagnardi V, Zambon A, La Vecchia C. A meta-analysis of alcohol consumption and the risk of 15 diseases. Prev
Med. 2004;38(5):613–9.
4. Di Castelnuovo A, Costanzo S, Bagnardi V, Donati MB, Iacoviello L, de Gaetano G. Alcohol dosing and total mortality in men
and women: an updated meta-analysis of 34 prospective studies.
Arch Intern Med. 2006;166(22):2437–45.
5. Costanzo S, Di Castelnuovo A, Donati MB, Iacoviello L, de
Gaetano G. Alcohol consumption and mortality in patients with
cardiovascular disease: a meta-analysis. J Am Coll Cardiol.
2010;55(13):1339–47.
6. Reynolds K, Lewis B, Nolen JD, Kinney GL, Sathya B, HeJ.
Alcohol consumption and risk of stroke: a meta-analysis. JAMA.
2003;289(5):579–88.
7. Ronksley PE, Brien SE, Turner BJ, Mukamal KJ, Ghali WA.
Association of alcohol consumption with selected cardiovascular
disease outcomes: a systematic review and meta-analysis. BMJ.
2011;342:d671.
8. Rimm EB, Williams P, Fosher K, Criqui M, Stampfer MJ.
Moderate alcohol intake and lower risk of coronary heart disease:
meta-analysis of effects on lipids and haemostatic factors. BMJ.
1999;319(7224):1523–8.
9. Di Castelnuovo A, Costanzo S, di Giuseppe R, de Gaetano G,
Iacoviello L. Alcohol consumption and cardiovascular risk:
mechanisms of action and epidemiologic perspectives. Future
Cardiol. 2009;5(5):467–77.
Alcoholic beverages consumption and vascular risk
10. Gresele P, Cerletti C, Guglielmini G, Pignatelli P, de Gaetano G,
Violi F. Effects of resveratrol and other wine polyphenols on
vascular function: an update. J Nutr Biochem. 2011;22(3):201–11.
11. Piazzon A, Forte M, Nardini M. Characterization of phenolics
content and antioxidant activity of different beer types. J Agric
Food Chem. 2010;58(19):10677–83.
12. Martinez N, Urpi-Sarda M, Martinez-Gonzalez MA, AndresLacueva C, Mitjavila MT. Dealcoholised beers reduce atherosclerosis and expression of adhesion molecules in apoE-deficient
mice. Br J Nutr. 2011;105(5):721–30.
13. Bagnardi V, Zambon A, Quatto P, Corrao G. Flexible metaregression functions for modeling aggregate dose-response data,
with an application to alcohol and mortality. Am J Epidemiol.
2004;159(11):1077–86.
14. Stroup DF, Berlin JA, Morton SC, et al. Meta-analysis of
observational studies in epidemiology: a proposal for reporting.
Meta-analysis of observational studies in epidemiology
(MOOSE) group. JAMA. 2000;283(15):2008–12.
15. Yano K, Rhoads GG, Kagan A. Coffee, alcohol and risk of
coronary heart disease among Japanese men living in Hawaii.
N Engl J Med. 1977;297(8):405–9.
16. Stampfer MJ, Colditz GA, Willett WC, Speizer FE, Hennekens
CH. A prospective study of moderate alcohol consumption and
the risk of coronary disease and stroke in women. N Engl J Med.
1988;319(5):267–73.
17. Bianchi C, Negri E, LaVecchia C, Franceschi S. Alcohol consumption and the risk of acute myocardial infarction in women.
J Epidemiol Community Health. 1993;47(4):308–11.
18. Tavani A, La Vecchia C, Negri A, D’Avanzo B, Franzoni M,
Tognoni G. Alcohol intake and risk of myocardial infarction in
Italian men. J Epidemiol Biostat. 1996;1(1):31–9.
19. Renaud SC, Guéguen R, SiestG, Salamon R. Wine, beer, and
mortality in middle-aged men from eastern France. Arch Intern
Med. 1999;159(16):1865–70.
20. Bobak M, Skodova Z, Marmot M. Effect of beer drinking on risk
of myocardial infarction: population based case-control study.
BMJ. 2000;320(7246):1378–9.
21. Grønbaek M, Becker U, Johansen D, et al. Type of alcohol
consumed and mortality from all causes, coronary heart disease,
and cancer. Ann Intern Med. 2000;133(6):411–9.
22. Theobald H, Bygren LO, Carstensen J, Engfeldt P. A moderate
intake of wine is associated with reduced total mortality and
reduced mortality from cardiovascular disease. J Stud Alcohol.
2000;61(5):652–6.
23. Malarcher AM, Giles WH, Croft JB, et al. Alcohol intake, type of
beverage, and the risk of cerebral infarction in young women.
Stroke. 2001;32(1):77–83.
24. Tavani A, Bertuzzi M, Negri E, Sorbara L, La Vecchia C.
Alcohol, smoking, coffee and risk of non-fatal acute myocardial
infarction in Italy. Eur J Epidemiol. 2001;17(12):1131–7.
25. Mukamal KJ, Conigrave KM, Mittleman MA, et al. Roles of
drinking pattern and type of alcohol consumed in coronary heart
disease in men. N Engl J Med. 2003;348(2):109–18.
26. Nielsen NR, Schnohr P, Jensen G, Grønbaek M. Is the relationship between type of alcohol and mortality influenced by socioeconomic status? J Intern Med. 2004;255(2):280–8.
27. Mukamal KJ, Chung H, Jenny NS, et al. Alcohol consumption
and risk of coronary heart disease in older adults: the Cardiovascular Health Study. J Am Geriatr Soc. 2006;54(1):30–7.
28. Harriss LR, English DR, Hopper JL, et al. Alcohol consumption
and cardiovascular mortality accounting for possible misclassification of intake: 11-year follow-up of the Melbourne Collaborative Cohort Study. Addiction. 2007;102(10):1574–85.
29. Schröder H, Masabeu A, Marti MJ, et al. Myocardial infarction
and alcohol consumption: a population-based case-control study.
Nutr Metab Cardiovasc Dis. 2007;17(8):609–15.
849
30. Lu M, Ye W, Adami HO, Weiderpass E. Stroke incidence in
women under 60 years of age related to alcohol intake and
smoking habit. Cerebrovasc Dis. 2008;25(6):517–25.
31. Suadicani P, Hein HO, Gyntelberg F. Wine intake, ABO phenotype, and risk of ischemic heart disease and all-cause mortality:
the Copenhagen Male Study—a 16-year follow-up. Alcohol.
2008;42(7):575–82.
32. Streppel MT, Ocké MC, Boshuizen HC, Kok FJ, Kromhout D.
Long-term wine consumption is related to cardiovascular mortality and life expectancy independently of moderate alcohol
intake: the Zutphen study. J Epidemiol Community Health.
2009;63(7):534–40.
33. Greenland S. Dose-response and trend analysis in epidemiology:
alternative to categorical analysis. Epidemiology. 1995;6(4):
356–65.
34. Royston P, Altman DG. Regression using fractional polynomials
of continuous covariates: parsimonious parametric modelling.
Appl Stat. 1994;43:429–67.
35. Greenland S, Longnecker MP. Methods for trend estimation from
summarized dose-response data, with application to meta-analysis. Am J Epidemiol. 1992;135(11):1301–9.
36. Ludbrook J. Multiple comparison procedures updated. Clin Exp
Pharmacol Physiol. 1998;25(12):1032–7.
37. Egger M, Davey Smith G, Schneider M, Minder C. Bias in metaanalysis detected by a simple, graphical test. BMJ. 1997;
315(7109):629–34.
38. Wells G, Shea B, O’Connell D. The Newcastle-Ottawa Scale
(NOS) for assessing the quality of nonrandomized studies in
meta-analyses. Ottawa Health Research Institute. http://www.
ohri.ca/programs/clinical_epidemiology/oxford.asp.
39. Tramacere I, Scotti L, Jenab M, Bagnardi V, Bellocco R, Rota M,
Corrao G, Bravi F, Boffetta P, La Vecchia C. Alcohol drinking
and pancreatic cancer risk: a meta-analysis of the dose-risk
relation. Int J Cancer. 2010;126(6):1474–86.
40. Rimm EB, Klatsky A, Grobbee D, Stampfer MJ. Review of
moderate alcohol consumption and reduced risk of coronary heart
disease: is the effect due to beer, wine, or spirits. BMJ. 1996;
312(7033):731–6.
41. Costanzo S, Di Castelnuovo A, Donati MB, Iacoviello L, de
Gaetano G. Cardiovascular and overall mortality risk in relation
to alcohol consumption in patients with cardiovascular disease.
Circulation. 2010;121(17):1951–9.
42. Rehm J, Sempos CT, Trevisan M. Alcohol and cardiovascular
disease -more than one paradox to consider. Average volume of
alcohol consumption, patterns of drinking and risk of coronary
heart disease- a review. J Cardiovasc Risk. 2003;10(1):15–20.
43. Trevisan M, Schisterman E, Mennotti A, Farchi G, Conti S, Risk
Factor and Life Expectancy Research Group. Drinking pattern
and mortality: the Italian risk factor and life expectancy pooling
project. Ann Epidemiol. 2001;11(5):312–9.
44. Bagnardi V, Zatonski W, Scotti L, La Vecchia C, Corrao G. Does
drinking pattern modify the effect of alcohol on the risk of coronary heart disease? Evidence from a meta-analysis. J Epidemiol
Community Health. 2008;62(7):615–9.
45. Della Valle E, Stranges S, Trevisan M, et al. Drinking habits and
health in Northern Italian and American men. Nutr Metab Cardiovasc Dis. 2009;19(2):115–22.
46. Bloomfield K, Stockwell T, Gmel G, Rehn N. International
comparison of alcohol consumption. Alcohol Res Health.
2003;27(1):95–109.
47. Rimm EB, Stampfer MJ. Wine, beer, and spirits: are they really
horses of a different color? Circulation. 2002;105(24):2806–7.
48. Di Castelnuovo A, Costanzo S, Donati MB, Iacoviello L, de
Gaetano G. Prevention of cardiovascular risk by moderate alcohol consumption: epidemiologic evidence and plausible mechanisms. Intern Emerg Med. 2010;5(4):291–7.
123
850
49. Estruch R, Sacanella E, Badia E, et al. Different effects of red
wine and gin consumption on inflammatory biomarkers of atherosclerosis: a prospective randomized crossover trial. Effects of
wine on inflammatory markers. Atherosclerosis. 2004;175(1):
117–23.
50. Concato J, Shah N, Horwitz RI. Randomized, controlled trials,
observational studies, and the hierarchy of research designs.
N Engl J Med. 2000;342(25):1887–92.
123
S. Costanzo et al.
51. Fillmore KM, Stockwell T, Chikritzhs T, Bostrom A, Kerr W.
Moderate alcohol use and reduced mortality risk: systematic error
in prospective studies and new hypotheses. Ann Epidemiol.
2007;17(5 Suppl):S16–23.
52. Maclure M. Demonstration of deductive meta-analysis: ethanol
intake and risk of myocardial infarction. Epidemiol Rev. 1993;
15(2):328–51.
© Copyright 2026 Paperzz