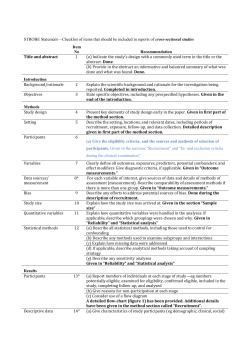
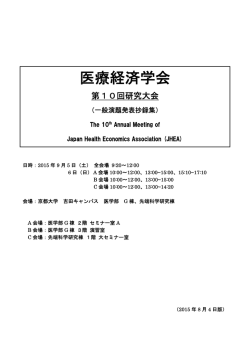
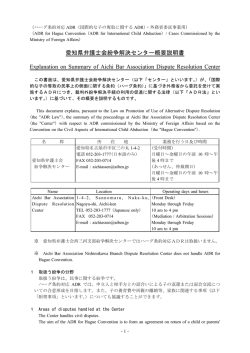
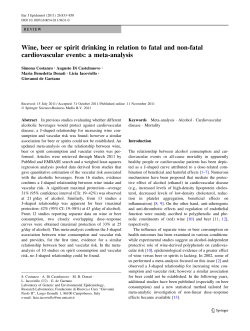
Vol. 60: 141-146. 1990
MARINE ECOLOGY PROGRESS SERIES
Mar. Ecol. Prog. Ser.
Published February 8
Effects of density-dependent mortality
on the relationship between recruitment and
larval settlement
Eric R. Holm
Zoology Department. Duke University Marine Laboratory, Duke University, Beaufort, North Carolina 28516, USA
ABSTRACT: Cr~teriafor recruitment limitation or regulation of open populations suggest that such
regulation can only occur when population a g e structure (or recruitment) directly reflects previous
settlement events, i e , when mortality of settlers is density-independent. A simple mathematical model
is used to relate recruitment density to settlement density when mortality is density-dependent T h e
results indicate that recruitment may still reflect settlement despite density-dependent mortality of
settlers, especially when settlement densities are low. The conditions under which recruitment reflects
settlement, or populahons are recruitment limited, are much broader than originally assumed, a n d can
b e calculated from field data
INTRODUCTION
Marine ecologists are currently in the process of
constructing a new paradigm synthesizing the roles of
larval settlement and post-settlement processes in structuring communities of organisms with open populations.
A growing body of theory (Roughgarden et al. 1985,
Roughgarden & Iwasa 1986, Warner & Hughes 1989)and
data (e.g.sessile invertebrates: Gaines et al. 1985, Gaines
& Roughgarden 1985, Davis 1987, Raimondi 1988,
Hughes 1989, Sutherland 1989; others: reviewed in
Connell 1985; reef fish: reviewed in Doherty & Williams
1988) indicates that larval settlement can generate significant spatial and temporal variation in the size of open
populations, their dynamics, a n d community structure.
A number of criteria have been proposed for distinguishing populations regulated by larval settlement,
[i.e., recruitment-limited (Doherty 1983) or recruitment-regulated (Hughes 1989) populations] from those
regulated by post-settlement interactions such as interor intraspecific competition. One criterion for recruitment regulation is that mortality of newly settled larvae
be density-independent, or, equivalently, population
age structure be a direct reflection of previous settlement events (Victor 1986, Jones 1987. Doherty & Williams 1988, Mapstone & Fowler 1988). It is suggested
that any density-dependent mortality will destroy the
direct relationship between larval settlement and
O Inter-Research/Printed in F. R. Germany
recruitment (Connell 1985, Victor 1986). However,
most field studies of larval settlement and pre-recruitment mortality have so far failed to detect densitydependent effects (Davis 1988, Sutherland 1989, others
reviewed in Connell 1985, Doherty & Williams 1988),
and thus provide no information on the relationship
between settlement and recruitment, and therefore
recruitment limitation, when pre-recruitment mortality
is density-dependent. In this paper I use a simple
mathematical model to examine the effects of varying
density-dependent mortality on the relationship
between settlement a n d recruitment.
FORMULATION OF THE MODEL
The mathematical model stems from the definitions
of settlement and recruitment for sessile invertebrates.
A larva is considered to have settled at the moment it
irreversibly attaches to the substrate; a settler is considered to be a recruit once it has survived some arbitrary
length of time after settlement (Keough & Downes
1982). Thus, the number of recruits is a function of the
number of settlers a n d some probability of survival:
# Recruits = ( # Settlers) X (Survival probability).
(1)
The survival probability is defined as a function of the
number or density of settlers in a cohort; mortality due
0171-8630/90/0060/0141/$ 03.00
Mar. Ecol. Prog. Ser. 60: 141-146, 1990
142
to interactions between age classes is ignored. I assume
[as, apparently, does Connell (1985)l a simple linear
model relating density of settlers and their mortality:
Percent mortality
=
B (x/A)
+ D1
where X is the number of settlers, A is the area over
which they settled, B is the slope of the percent mortality vs settler density regression (equivalent to the
strength of density-dependent mortality), and D1 is
density-independent mortality in form of percent (the
Y-intercept of the percent mortality vs settler density
regression). Note that this model holds only for B 2 0 ;
inverse density-dependence (B < 0) will be considered
later. Note also that this regression holds only within a
cohort or a g e class, a n d is unrelated to the crossgeneration regression methods for detecting densitydependent mortality examined by Maelzer (1970) and
St. Amant (1970). Fig. 1 illustrates the changing shape
of the mortality curve as density-dependence varies.
When density-dependent mortality is absent, B = 0 and
percent mortality is constant and equal to D1 (Fig. 1,
Line a). As the slope B increases, the effect of settler
density on percent mortality also increases (Fig. 1,
Lines b a n d c).
PERCENT MORTALlM VS
DENSITY OF S m L E R S
densities by dividing both sides of this equation by the
constant A. Simplifying,
# Recruits = - ( ~ x ~ / 1 0 0 ~ ) +
- [(DI/lOO)]x.
1
(4b)
This equation describes a parabola (Fig. 2, Line b)
when B > 0 (some density-dependent mortality) and a
straight line (Fig. 2, Line a ) when density-dependent
mortality is absent (B = 0). When mortality is densityindependent, the density of recruits is directly proportional to the density of settlers (Fig. 2, Line a).
RECRUIT DENSITY VS
DENSITY OF S m L E R S
U N E * R D E W S l P l ~
DENSITY OF SETTLERS
Fig. 2. Recruit density as a function of settlement density with
and without dens~ty-dependentmortality. (a)B = 0; (b) B > C
Effects of density-dependent mortality
DENSITY OF SETTLERS
Fig. 1. Mortality a s a function of settlement density for various
strengthsof density-dependent mortality. (a) B = 0 ;( b , c) B > 0.
DI: Percent mortal~tydue to dens~ty-independentfactors
Substitution of Eqn ( 2 ) into Eqn (1) yields a function
relating the number of settlers to the number of recruits
under the assumption of linear density-dependent
mortality:
Survival probability = 1 - (O/~Mortality/lOO)
#
Recruits
=
[ l - (Bx/100A) - (DI/lOO)]x
(3a)
(4a)
where X again represents the number of settlers. Numbers of recruits and settlers can be converted into
When mortality of settlers exhibits some densitydependence, the density of recruits will only reflect the
density of settlers over the range of settler densities for
which the slope of the parabola is positive. This interval
includes all densities less than the maximum of Eqn
(4b). Maxima are found by solving the first derivative of
the equation for dy/dx = 0, then showing that this point
corresponds to a negative second derivative. Taking
the derivative of Eqn (4b) yields
The second derivative of Eqn (4b) is
which is always negative when B > 0 (density-dependent mortality occurs). Solving Eqn (5) for dy/dx = 0
thus yields the maximum point for the parabola,
rearranging terms and simplifying produces the final
equation
143
Holm: Density-dependent mortality and recruitment
The number and density of recruits is a maximum
when
Density of settlers
=
(100 - DI)/2B,
In [ B + ? ] AS A FUNCTION OF S E n L E M E N T
DENSITY AND DENSITY-NDEPENDENT MORTALITY
(8b)
and the density of recruits will accurately reflect the
density of settlers over the interval
0 5 Density of settlers < (100 - DI)/2B.
(9)
This result indicates that for any value of B > 0, over
some range of settlement density, recruitment will
increase with settlement. Given an observed level of
density-dependent and independent mortality, Eqn (8b)
can be used to calculate the range of settlement
densities for which recruitment reflects settlement. Conversely, using the same equation, the level of densitydependent mortality at which the direct relationship
between recruitment and settlement breaks down can
be calculated for a given value of settlement density.
Table 1 gives maximum values for strength of densitydependent mortality (B), calculated from Eqn (8b), for
various combinations of settlement density and densityindependent mortality. These B values represent the
strongest density-dependent mortality for which
recruitment will directly reflect settlement. At low settlement densities the direct relationship between settlement and recruitment begins to break down only at very
high values of B, i.e., when strong density-dependent
mortality occurs. B values decrease precipitously with
increasing settlement, increases in D1 yield decreases of
much smaller magnitude (Table 1, Fig. 3 ) .
Density-dependent mortality with thresholds
The above model assumes B and D1 are constant over
the full range of settlement densities. The occurrence of
Table 1 Values of B, calculated from Eqn (8b), for various
levels of settlement density and density-independent mortality (DI). B represents the strongest density-dependent mortality for which recruitment directly reflects settlement (rounded
to 4 decimal places)
D1
5
10
0
10
20
30
40
50
60
70
80
90
100
10.0
9.0
8.0
7.0
6.0
5.0
4.0
3.0
2.0
1.0
0.0
5.0
4.5
4.0
3.5
3.0
2.5
2.0
1.5
1.0
0.5
0.0
Settlement density
20
40
2.5
2.25
2.0
1.75
1.5
1.25
1.0
0.75
0.5
0.25
0.0
1.25
1.125
1.0
0.875
0.75
0.625
0.5
0.375
0.25
0.125
0.0
Fig 3. Plot of ln(B + 1) as a function of settlement density and
density-independent mortality. B represents the strongest
density-dependent mortality for which recruitment will
directly reflect settlement, and is calculated from Eqn (8b)
density-dependent mortality is likely to vary with
settlement density, e.g. mortality may be purely
density-independent until a n upper threshold in settlement density is reached, at which point mortality is
both density-dependent and independent (Connell
1985, Gaines & Roughgarden 1985). Threshold models
of density-dependent mortality can be represented by
Percent mortality
=
B(x/A)
+C
(10)
where X is the number of settlers, A is the area over
which they settled, B is the slope of the percent mortality vs settler density regression, and C is the Y-intercept of the regression. Eqn ( 2 ) , for which C = DI, is a
special case of this general model. When C < DI, the
general model has 2 thresholds (Table 2); when Eqn
(10) < DI, mortality is purely density-independent,
when Eqn (10) > 100 % , mortality equals 100 % . These
2 thresholds occur at settlement densities < (D1 - C)/B
(Case l , Table 2) and > (100 - C)/B (Case 3, Table 2),
respectively. Between the thresholds, mortality is
density-dependent and given by Eqn (10). For the
general model the density of recruits will accurately
reflect the density of settlers over the interval
0 5 Density of Settlers < (100 - C)/2B.
(11)
Mar Ecol. Prog. Ser 60: 141-146, 1990
144
Table 2. Thresholds for the general linear density-dependence
model (Eqn 10). B: slope of percent mortality vs settler density
regression; X: no, settlers; A: area over which larvae settle; C: Y intercept of percent mortality vs settler density regression, DI:
percent mortality d u e to density-independent factors
Case
"10
Mortality
1
2
3
When?
Settlement
density
D1
B(x/A)+C < D1
< (DI-C)/B
B(x/A)+C DI5B(x/A)+C510OQ/~
100
B(x/A)+ C > 100 %
> (100-C)/B
Effects of increased time after settlement on mortality
parameters
Eqn 4b relates settlement density to density of individuals at a n y time after settlement. As time after
settlement increases, however, there may be a decrease
in the correlation between settlement and recruitment
(e.g. Sutherland 1989), or, a decrease in the settlement
density at which the direct relationship between settlement and recruitment begins to break down. This results
from increases in DI, a n d possibly B, with time. The
probability of density-independent mortality of a n individual over a given time span is equal to the sum of the
instantaneous probabilities of density-independent
mortality for that span. These instantaneous probabilities are not constant; however, they are never less
than zero. Therefore, their sum, and thus DI, can only
increase with increasing time after settlement. It is not
clear if a similar argument can be made for instantaneous
probabilities of density-dependent mortality and B. Any
increase in DI (if not offsetby a decrease in B) and/or B
over time will decrease the range of settlement densities
over which settlement a n d recruitment are directly
related.
of the percent mortality vs settler density regression is
negahve [for examples, see Connell (1985)], and
Percent mortality
=
-]B1 (x/A) + C
(12)
where X is the number of settlers, A is the area over
which they settle, and C is the Y-intercept of the
percent mortality vs settler density regression. This
mortality model has 2 thresholds (Fig. 4 , Table 3);
when Eqn (12) > 100 %, mortality equals 100 '10, when
Eqn (12) < DI, mortality equals DI. These 2 thresholds
occur at settlement densities < (C - 100)/IB1 (Case 1,
Table 3) and > (C - DI)/IBI (Case 3, Table 3 ) , respectively. Between these 2 points, percent mortality varies
with density by Eqn (12) (Case 2, Table 3). The relationship between recruitment a n d settlement is
PERCENT MORTAUN VS
DENSITY OF S m L E R S
D f N O n WCNMNtE
U N V d -I
\
"
W
"
a
--
\
c
A
- CASE 1
DENSITY OF SETTLERS
Fig. 4 . Mortality as a function of settlement density for inverse
density-dependent mortality. CA, CB = Y-intercepts for Lines
A, B, respectively. DI: percent mortality due to density-independent factors. (A) Inverse density-dependent mortality with
thresholds, occurs whenever C , 100o,o.Dashed line reDresents region for which Eqn (12) > 100 %. (B) Inverse densltydependent mortality with 1 threshold, occurs whenever C E.
100 'Case' refers to cases listed in Table 3
%I.
Inverse density-dependent mortality
Mortality of settlers will exhibit inverse densitydependence when group interactions (including, but
not necessarily limited to, social interactions) increase
survival (e.g. Buss 1981, Keough 1984, Bertness 1989).
When inverse density-dependence occurs, the slope B
straightforward for Cases 1 and 3. For Case l , there is
no recruitment, and for Case 3, mortality IS purely
density-independent, so recruitment is directly proportional to settlement. To find the form of the recruitment-settlement relationship for Case 2, the steps set
out previously are used,
Table 3. Thresholds for the linear inverse density-dependence model (Eqn 12). B: slope of percent mortality vs settler density
regression; X: no settlers, A: area over \vh.ich larvae settle; C : Y-intercept of percent mortality vs settler d e n s ~ t yregression, DI:
percent mortality d u e to density-independent factors
I
Case
' X , Mortal; ty
When?
Settlement d e n s ~ t y
I
Holm: Density-dependent mortality a n d recruitment
Surv~valprobability
=
1
-
(- I B \ x / 1 0 0 ~) C(/100)
(13)
yields,
#
Recruits = I ~ I x ~ / 1 0+ 0[ ~l - (C/lOO)]x. (14)
This equatlon describes a parabola whenever B < 0.
Unlike the density-dependence model, however, this
parabola is concave up;
dy/dx
=
21B1x/100A
+ [ l - (C/100)]
(15)
and,
dZy/dx2= 21B1/100A
(16)
which is always positive. Thus, dy/dx = 0 is the
minimum of Eqn (14). Whenever settlement density is
greater than the density at which dy/dx = 0, recruitment will directly reflect settlement. Solving Eqn (15)
for zero,
dy/dx
=
0
=
21B1x/100A
+ [ l - (C/100)],
(l?)
rearranging terms and simplifying,
Density of settlers = (C - 100)/21BI.
(18)
Note that, when C > 100, this density is less than the
threshold density for 100 O/O illortality (Case 1, Table 3).
Therefore, recruitment accurately reflects settlement
whenever
Density of settlers > ( C - 100)/IBI.
(19)
When C < 100, Eqns (18) and (19) produce negative
densities; when this occurs recruitment will always be
an accurate reflection of settlement.
DISCUSSION
Simple linear models of density-dependent mortality
produce a parabolic curve relating density of settlers
and density of recruits (Flg. 2, Line b). Over the ascending portion of the parabola recruitment and settlement
are directly related, and recruit density will mirror
density of settlers. As the density of settlers increases
out of the ascending portion of the curve, densitydependent mortality leads to the breakdown of the
settlement-recruitment correlation. Increasingly dense
settlement results in decreasing recruitment; and a
given level of recruitment can represent 2 levels of
settlement.
These conclusions hold only for the mortality model
given in Eqn (2). Other models will produce different
functions relating settlement and recruitment. Under
weak inverse density-dependent mortality, for example, recruitment will almost always reflect previous
settlement. As the strength of this type of mortality
145
increases, however, low levels of recruitment arise from
a wide range of low settlement densities.
These results indicate that density-dependent mortality does not necessarily preclude recruitment limltation of open populations. Because recruitment can
reflect previous settlement events over a range of
settlement densities and strengths of density-dependent and independent mortality, variations In settlement density can be maintained in the population's a g e
structure despite density-dependent mortality. This
will be especially true when settlement density is consistently low, or density-dependent mortality weak.
In a n extension of the above, recruit density can often
serve as a n accurate estimator of previous settlement.
Eqn (4b) and the mortality equations given in Tables 2
a n d 3 can be used to calculate settlement estimates
from recruitment data. This result may be of utility in
studies of populations and communities of sessile
marine invertebrates, where larval settlement is frequently difficult to measure directly. The appropriateness of recruitment estimates for larval settlement will
depend on the observed settlement density, densitydependent and independent mortality. The methods
used here can be applied by benthic ecologists to
calculate the boundary conditions for which observed
recruitment estimates settlement. For the linear model
of density-dependent mortality examined (Eqn 2),
recruitment estimates will b e most accurate for organisms exhibiting chronically low settlement densities. In
these cases estimates are robust to exceptionally high
levels of density-dependent mortality. When settlement density is high, recruitment estimates become
inaccurate at much lower levels of density-dependent
mortality. For these cases, recruitment estimates of
settlement can be improved by decreasing the interval
between settlement and sampling of recruits, thus
reducing the opportunity for density-dependent and
independent mortality to act. When mortality exhiblts
inverse density-dependence (Eqn 12), recruitment
estimates will be unreliable at low settlement densities,
but very accurate at high densities.
Extreme care should be taken in the use and interpretation of such estimates. Back-calculation of settlement
density from recruitment data requires knowledge of the
strength of density-dependent and independent mortality (B and DI) and, more importantly, their variability in
space a n d time. If B a n d D1 exhibit spatial and temporal
variability, variation in recruitment may not reflect vanation in settlement, but instead variation in pre-recruitment mortality. When such variation exists, studies of
spatial and temporal variation in settlement based on
recruitment measures may be misleading. A thorough
knowledge of the range of settlement densities possible
is also required to ensure that some settlement estimates
do not in fact represent unusually dense or light settle-
Mar Ecol. Prog. Ser. 60: 141-146, 1990
146
ment and subsequent strong density-dependent or
inverse density-dependent mortality (that is, to ensure
one-to-one correspondence between a given level of
recruitment and previous settlement).
Connell (1985) suggests that recruitment can be used
as a n estimator of larval settlement, but only when
mortality of settlers is density-independent. A number
of authors (Victor 1986, Jones 1987, Doherty & Williams
1988, Mapstone & Fowler 1988) contend that a n open
population can not be recruitment-limited when mortality of newly settled larvae is density-dependent,
presumably because density-dependence would destroy the correspondence between population a g e structure a n d past settlement events. The results presented
here demonstrate that these requirements are too strict;
recruit density can serve as a n accurate indicator of
settlement density, a n d population a g e structure may
directly reflect past settlement, despite density-dependent mortality of settlers, especially when settlement
density is low.
Bertness, M D. (1989).Intraspecific competition and facilitation in a northern acorn barnacle population. Ecology 70:
257-268
Buss, L. W (1981). Group living, competition, and the evolution of cooperation in sessile invertebrates. Science 213:
1012-1014
Connell, J. H. (1985). The consequences of variation in initial
settlement vs post-settlement mortality in rocky intertidal
communities. J. exp. mar Biol. Ecol. 93: 11-45
Davis, A. R. (1987). Variation in recruitment of the subtidal
colonial ascidian Podoclavella cylindrica (Quoy &
Gaimard): the role of substratum choice and early survival.
J . exp. mar. Biol. Ecol. 106: 57-71
Davis, A. R. (1988). Effects of variation in initial settlement on
distribution and abundance of Podoclavella moluccensis
Sluiter. J. exp. mar Biol. Ecol. 117: 157-167
Doherty, P. J. (1983). Tropical territorial damselfishes: is
density limited by aggression or recruitment? Ecology 64:
176-190
Doherty, P. J., Williams, D. McB. (1988).The replenishment of
coral reef fish populations. Oceanogr. mar. biol. A. Rev. 26:
487-551
Gaines, S., Brown, S., Roughgarden, J. (1985). Spatial variation in larval concentrations as a cause of spatial variation
in settlement for the barnacle, Balanus glandula.
Oecologia (Berl.) 67: 267-272
Gaines, S., Roughgarden, J. (1985). Larval settlement rate: A
leading determinant of structure in an ecological community of the marine intertidal zone. Proc. natn. Acad. Sci.
U.S.A. 82: 3707-371 1
Hughes. T P. (1989). Recruitment limitation. mortality and
population regulation in open systems: a case study. Ecology (in press)
Jones, G. P. (1987). Competitive interactions among adults
and juveniles in a coral reef fish. Ecology 68: 1534-1547
Keough, M. J . (1984).fin-recognition and the spatial distribution of larvae of the bryozoan Bugula neritina. Evolution
38: 142-147
Keough, M . .J., Downes, B. J. (1982). Recruitment of marine
invertebrates: The role of active larval choices and early
mortality. Oecologia (Berl.) 54: 348-352
Maelzer, D.-A.(1970). The regression of log N,,, on log N, as
a test of density dependence: An exercise with computerconstructed density-independent populations. Ecology 51
810-822
Mapstone, B. D., Fowler, A. J . (1988). Recruitment and the
structure of assemblages of fish on coral reefs. Trends Ecol.
Evol. 3: 72-77
Raimondi, P. T. (1988). Rock type affects settlement, recruitment, and zonation of the barnacle Chthamalus anisopoma
Pilsbury. J. exp. mar Biol. Ecol. 123: 253-267
Roughgarden, J., Iwasa, Y (1986). Dynamics of a metapopulation with space-limited subpopulations. Theor. Popul. Biol.
29. 235-261
Roughgarden, J., Iwasa. Y., Baxter, C. (1985). Demographic
theory for a n open marine population with space limited
recruitment. Ecology 66: 54-67
St. Amant, J. L. S. (1970). The detection of regulation in animal populations. Ecology 51: 823-828
Sutherland, J. P. (1989) Recruitment regulates demographic
variation in a tropical intertidal barnacle. Ecology (in
press)
Victor, B. C. (1986). Larval settlement and juvenile mortality
in a recruitment-limited coral reef fish population. Ecol.
Monogr 56: 145-160
Warner, R. R., Hughes, T P. (1989). The population dynamics
of reef fishes Proc. 6th int. Coral Reef Symp., Townsville,
Australia (in press)
This article was presented by Professor C. H. Peterson,
Morehead City, North Carohna, USA
Manuscript first received: March 21, 1989
Revised version accepted October 3, 1989
Acknowledgements. The manuscript benefited from the comments of J. Sutherland, A. Shanks, C. Peterson, T. Hughes. A.
Underwood, and a n anonymous reviewer Thanks to T. Hughes
for suggesting the recruitment limitation angle. Discussions
urlth J. Sutherland, A. Shanks, and the UNC-IMS/DUML
Ecolunchgroup helped clarify my thinking on many of the points
made here.
LITERATURE CITED
© Copyright 2026 Paperzz