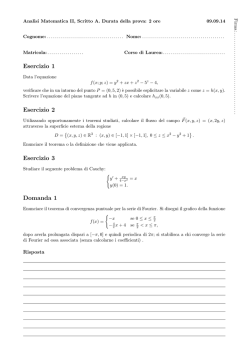
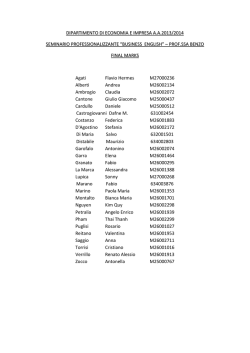
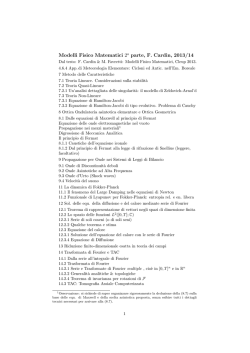
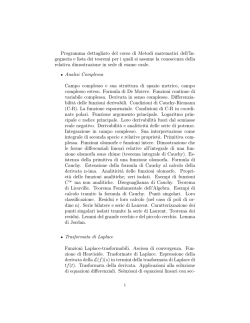
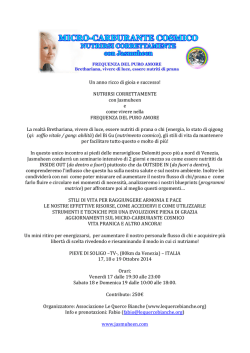
Corso di Laurea in Fisica - UNITS
ISTITUZIONI DI FISICA
PER IL SISTEMA TERRA
Sound and
Fourier analysis
FABIO ROMANELLI
Department of Mathematics & Geosciences
University of Trieste
[email protected]
http://moodle2.units.it/course/view.php?id=887
Complex waves
Sound waves are not simple
sinusoidal waves, but are complex.
We can see this visually with a
waveform:
Fabio Romanelli
Fourier
Complex waves
Complex waves can be broken down
mathematically (by Fourier analysis)
into a series of simple waves:
Fourier analysis (simplified): at a given
point in time, add the increases in
air pressure and subtract the
decreases in air pressure
Fabio Romanelli
Fourier
Complex waves
The frequency of the complex wave is the fundamental period and
is the same as the frequency of the first component of a complex
wave. This is the fundamental frequency or f1, that corresponds to
the “pitch” of the sound
Each of the higher-frequency simple waves is called a harmonic.
In naturally occurring vibrations, there is a harmonic at each
multiple of the fundamental frequency, so if f1 = 100Hz,
2nd harmonic = 200Hz,
3rd harmonic = 300Hz , etc…
Different patterns of harmonics are part of what contributes to
the distinction between the sound of different musical instruments
playing the same note
Fabio Romanelli
Fourier
Spectrum
Because each complex wave has many components or harmonics,
it is difficult to see in a waveform in which the X-axis is time.
We can also plot amplitude with respect to frequency in a
spectrum, a useful way of interpreting complex waves:
Each line in a spectrum represents a simple wave
and indicates its amplitude and frequency
Fabio Romanelli
Fourier
Spectrum
Consider the complex wave again.
It has three components with
different frequencies and
amplitudes
Fabio Romanelli
Frequency
Amplitude
1
100Hz
30dB
2
200Hz
10dB
3
300Hz
20dB
Fourier
Spectrum
The three component waves have the following properties:
dB
30
Frequency
Amplitude
1
100Hz
30dB
2
200Hz
10dB
3
300Hz
20dB
20
10
The spectrum looks like:
100
Fabio Romanelli
200
300
Hz
Fourier
Spectrogram
Another way of examining sound
Spectrogram plots intensity and frequency with respect to time.
X-axis is time; Y-axis is frequency; darkness is intensity:
Fabio Romanelli
Fourier
Fourier Series
Fourier theorem states that a periodic function f(t)
which is reasonably continuous may be expressed as
the sum of a series of sine or cosine terms (called the
Fourier series), each of which has specific amplitude
and phase coefficients known as Fourier coefficients.
Linear Superimposition of Sinusoids to build complex
waveforms
Jean Baptiste Joseph Fourier
1768-1830
∞
f(t) = a 0 + ∑ A n cos(ω nt + φn )
1
ω n = nω 1 = n
2π
T1
http://www.falstad.com/fourier/
Fabio Romanelli
Fourier
Fourier Series
Decompose our complex periodic waveform
into a series of simple sinusoids
Where
Fabio Romanelli
Fourier
Square Wave Example
Consider
Clearly the period is T=2 hence ω=π
When we integrate we need to do so over sections
t= 0 to 1 and t=1 to 2
Fabio Romanelli
Fourier
• So to find the series, we have to
calculate coefficients a0, an and bn
When evaluating an note
that the sin function is 0
when angle is every
multiple of π
Fabio Romanelli
Fourier
Fabio Romanelli
Fourier
Knowing
We need to consider the cos function to determine
values of bn for n=1,2,3,…. etc
Fabio Romanelli
Fourier
We found coefficients to be
Hence Fourier Series for a square wave is
Fabio Romanelli
Fourier
Let’s try implementing series in Matlab
f=100;
w=2*pi*f;
t=linspace(0,1/f*5,100);
y1=4/pi*(sin(w*t)+1/3*sin(3*w*t)
+1/5*sin(5*w*t));
plot(t,y1)
We can see it’s not quite a square wave (Gibbs
phenomenon) given series should be infinite.
However with a for loop we can add more to the
series
To n=10
Fabio Romanelli
To n=1000
Fourier
Saw tooth example
Evaluating Fourier series for saw tooth produces
Fabio Romanelli
Fourier
Triangle Example
Evaluating Fourier series for triangle wave
Fabio Romanelli
Fourier
Plucked string
Can one predict the amplitude of each mode
(overtone/harmonic?) following plucking?
Using the procedure to measure the Fourier
coefficients it is possible to predict the
amplitude of each harmonic tone.
Fabio Romanelli
Fourier
Plucked string
•You know the shape just before it is plucked.
•You know that each mode moves at its own
frequency
•The shape when released
•We rewrite this as
Fabio Romanelli
Fourier
Plucked string
Each harmonic has its own frequency
of oscillation, the m-th harmonic
moves at a frequency fm=mf0 or m
times that of the fundamental mode.
http://www.falstad.com/loadedstring/
Fabio Romanelli
Fourier
Do we hear phase?
Helmholtz and Ohm argued that our ear and brain
are only sensitive to the frequencies of sounds.
Timbre is a result of frequency mix.
These two are sums with the same amplitude sine waves components,
however the phases of the sine waves differ.
This sound file has varying phases of its frequencies. Do we hear any difference in time?
Fabio Romanelli
Fourier
Clarinet spectrum
Spectral view
Frequency
Clarinet spectrum with only
the lowest harmonic remaining
Time
Fabio Romanelli
Fourier
Waveform view
Full sound
Fabio Romanelli
Only lowest harmonic
Fourier
Four complex tones in which all partials have been
removed by filtering
One is a French horn, one is a violin, one is a pure sine, one is
a piano (but out of order)
It’s hard to identify the instruments. However clues remain
(attack, vibrato, decay)
Fabio Romanelli
Fourier
© Copyright 2026 Paperzz