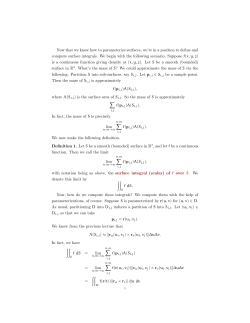
X100/11/01
NATIONAL
QUALIFICATIONS
2013
WEDNESDAY, 22 MAY
9.00 AM – 9.45 AM
MATHEMATICS
INTERMEDIATE 2
Units 1, 2 and 3
Paper 1
(Non-calculator)
Read carefully
1 You may NOT use a calculator.
2 Full credit will be given only where the solution contains appropriate working.
3 Square-ruled paper is provided. If you make use of this, you should write your name on it
clearly and put it inside your answer booklet.
LI X100/11/01 6/30910
*X100/11/01*
©
FORMULAE LIST
The roots of ax + bx + c = 0 are x =
2
(b
−b ±
2
− 4ac
)
2a
Sine rule:
a = b = c
sin A sin B sin C
Cosine rule:
2
2
2
a2 = b2 + c2 − 2bc cos A or cos A = b + c − a
2bc
Area of a triangle:
Area = 21 ab sin C
Volume of a sphere:
Volume = 43 πr 3
Volume of a cone:
Volume = 31 πr 2 h
Volume of a cylinder:
Volume = πr 2 h
Standard deviation:
s=
[X100/11/01]
2
∑ (x − x )
=
n −1
2
2
∑ x − ( ∑ x) / n
, where n is the sample size.
n −1
Page two
Marks
ALL questions should be attempted.
1. Factorise
1
6ab – 7bc.
y
2.
A (0, 4)
B (3, 0)
x
O
Find the equation of the straight line AB.
3
3. The diagram below shows a sector of a circle, centre C.
A
C
C
72 °
72 °
B
The radius of the circle is 5 centimetres and angle ACB is 72 °.
Calculate the length of arc AB.
Take π = 3·14.
3
[Turn over
[X100/11/01]
Page three
Marks
4. Solve algebraically the system of equations
2x – y = 10
4x + 5y = 6.
3
P
5.
Q
S
O
R
37 °
T 68 °
V
The tangent SV touches the circle, centre O, at T.
Angle PTQ is 37 ° and angle VTR is 68 °.
Calculate the size of angle PQR.
[X100/11/01]
3
Page four
6. The stem and leaf diagram shows the number of minutes on average spent on
homework per night by a group of first year pupils.
1
2
3
4
5
0
0
0
2
0
5
1
5
4
5
2
5
4
Marks
5
2 3 5 5 8 9
6 6 7 8 9 9 9
5 6 7
n = 30 1 0 represents 10 minutes
(a) Using the above data find:
(i) the median;
1
(ii) the lower quartile;
1
(iii) the upper quartile.
1
(b) Draw a boxplot to illustrate this data.
2
(c) A group of fourth year pupils was surveyed to find out how many minutes on
average they spent on homework per night. The boxplot below was drawn for
this data.
0
10
20
30
40
50
60
2
Compare the two boxplots and comment.
(x + 4)2
.
7. Simplify 2
x − x − 20
3
8. State the period of y = sin 2x °.
1
[Turn over
[X100/11/01]
Page five
Marks
2
9. The diagram below shows part of the graph of y = 20 – (x – 4) .
y
x
O
(a) State the coordinates of the maximum turning point.
2
(b) State the equation of the axis of symmetry.
1
10. Sketch the graph of y = sin (x – 90) °, 0 ≤ x ≤ 360.
3
[END OF QUESTION PAPER]
[X100/11/01]
Page six
[BLANK PAGE]
[BLANK PAGE]
© Copyright 2026 Paperzz