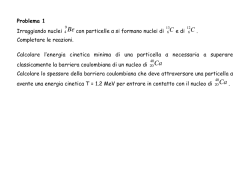
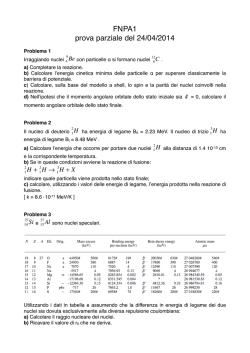
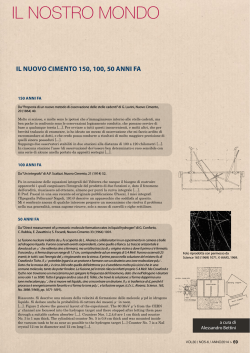
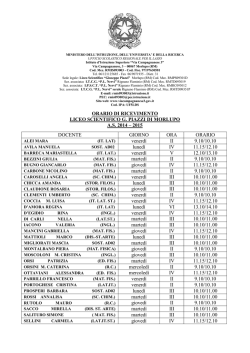
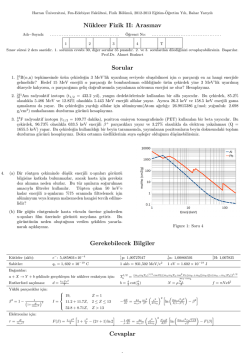
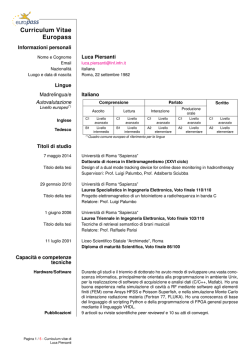
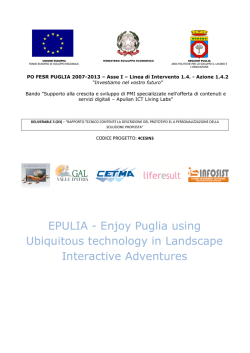
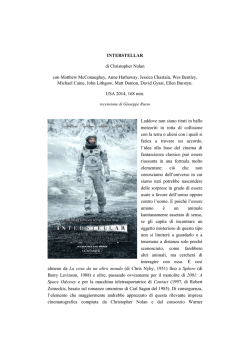
The Astrophysical Journal, 703:1249–1256, 2009 October 1
C 2009.
doi:10.1088/0004-637X/703/2/1249
The American Astronomical Society. All rights reserved. Printed in the U.S.A.
FERMI LAT OBSERVATION OF DIFFUSE GAMMA RAYS PRODUCED THROUGH INTERACTIONS
BETWEEN LOCAL INTERSTELLAR MATTER AND HIGH-ENERGY COSMIC RAYS
A. A. Abdo1,2 , M. Ackermann3 , M. Ajello3 , W. B. Atwood4 , M. Axelsson5,6 , L. Baldini7 , J. Ballet8 , G. Barbiellini9,10 ,
D. Bastieri11,12 , B. M. Baughman13 , K. Bechtol3 , R. Bellazzini7 , B. Berenji3 , E. D. Bloom3 , E. Bonamente14,15 ,
A. W. Borgland3 , J. Bregeon7 , A. Brez7 , M. Brigida16,17 , P. Bruel18 , T. H. Burnett19 , G. A. Caliandro16,17 ,
R. A. Cameron3 , P. A. Caraveo20 , P. Carlson6,21 , J. M. Casandjian8 , C. Cecchi14,15 , Ö. Çelik22 , A. Chekhtman1,23 ,
C. C. Cheung22 , S. Ciprini14,15 , R. Claus3 , J. Cohen-Tanugi24 , J. Conrad6,21,25,52 , S. Cutini26 , C. D. Dermer1 ,
A. de Angelis27 , F. de Palma16,17 , S. W. Digel3 , E. do Couto e Silva3 , P. S. Drell3 , R. Dubois3 , D. Dumora28,29 ,
C. Farnier24 , C. Favuzzi16,17 , S. J. Fegan18 , W. B. Focke3 , M. Frailis27 , Y. Fukazawa30 , S. Funk3 , P. Fusco16,17 ,
F. Gargano17 , D. Gasparrini26 , N. Gehrels22,31 , S. Germani14,15 , B. Giebels18 , N. Giglietto16,17 , F. Giordano16,17 ,
T. Glanzman3 , G. Godfrey3 , I. A. Grenier8 , M.-H. Grondin28,29 , J. E. Grove1 , L. Guillemot28,29 , S. Guiriec24,32 ,
Y. Hanabata30 , A. K. Harding22 , M. Hayashida3 , E. Hays22 , R. E. Hughes13 , G. Jóhannesson3 , A. S. Johnson3 ,
R. P. Johnson4 , W. N. Johnson1 , T. Kamae3 , H. Katagiri30 , N. Kawai33,34 , M. Kerr19 , J. Knödlseder35 , M. L. Kocian3 ,
F. Kuehn13 , M. Kuss7 , J. Lande3 , L. Latronico7 , M. Lemoine-Goumard28,29 , F. Longo9,10,36 , F. Loparco16,17 , B. Lott28,29 ,
M. N. Lovellette1 , P. Lubrano14,15 , A. Makeev1,23 , M. N. Mazziotta17 , J. E. McEnery22 , C. Meurer6,25 , P. F. Michelson3 ,
W. Mitthumsiri3 , T. Mizuno1,30 , A. A. Moiseev31,37 , C. Monte16,17 , M. E. Monzani3 , A. Morselli38 , I. V. Moskalenko3 ,
S. Murgia3 , P. L. Nolan3 , J. P. Norris39 , E. Nuss24 , T. Ohsugi30 , A. Okumura40 , N. Omodei7 , E. Orlando41 , J. F. Ormes39 ,
M. Ozaki42 , D. Paneque3 , J. H. Panetta3 , D. Parent28,29 , M. Pepe14,15 , M. Pesce-Rollins7 , F. Piron24 , M. Pohl43 ,
T. A. Porter4 , S. Rainò16,17 , R. Rando11,12 , M. Razzano7 , A. Reimer3,44 , O. Reimer3,44 , T. Reposeur28,29 , S. Ritz22 ,
L. S. Rochester3 , A. Y. Rodriguez45 , F. Ryde6,21 , H. F.-W. Sadrozinski4 , D. Sanchez18 , A. Sander13 ,
P. M. Saz Parkinson4 , T. L. Schalk4 , A. Sellerholm6,25 , C. Sgrò7 , D. A. Smith28,29 , P. D. Smith13 , G. Spandre7 ,
P. Spinelli16,17 , J.-L. Starck8 , F. W. Stecker22 , M. S. Strickman1 , A. W. Strong41 , D. J. Suson46 , H. Tajima3 ,
H. Takahashi30 , T. Takahashi42 , T. Tanaka3 , J. B. Thayer3 , J. G. Thayer3 , D. J. Thompson22 , L. Tibaldo11,12 ,
D. F. Torres45,47 , G. Tosti14,15 , A. Tramacere3,48 , Y. Uchiyama3,42 , T. L. Usher3 , V. Vasileiou22,37,49 , N. Vilchez35 ,
V. Vitale38,50 , A. P. Waite3 , P. Wang3 , B. L. Winer13 , K. S. Wood1 , T. Ylinen6,21,51 , and M. Ziegler4
1 Space Science Division, Naval Research Laboratory, Washington, DC 20375, USA
National Research Council Research Associate, National Academy of Sciences, Washington, DC 20001, USA
3 W. W. Hansen Experimental Physics Laboratory, Kavli Institute for Particle Astrophysics and Cosmology, Department of Physics and SLAC National Accelerator
Laboratory, Stanford University, Stanford, CA 94305, USA
4 Santa Cruz Institute for Particle Physics, Department of Physics and Department of Astronomy and Astrophysics, University of California at Santa Cruz,
Santa Cruz, CA 95064, USA
5 Department of Astronomy, Stockholm University, SE-106 91 Stockholm, Sweden
6 The Oskar Klein Centre for Cosmo Particle Physics, AlbaNova, SE-106 91 Stockholm, Sweden
7 Istituto Nazionale di Fisica Nucleare, Sezione di Pisa, I-56127 Pisa, Italy
8 Laboratoire AIM, CEA-IRFU/CNRS/Université Paris Diderot, Service d’Astrophysique, CEA Saclay, 91191 Gif sur Yvette, France
9 Istituto Nazionale di Fisica Nucleare, Sezione di Trieste, I-34127 Trieste, Italy
10 Dipartimento di Fisica, Università di Trieste, I-34127 Trieste, Italy
11 Istituto Nazionale di Fisica Nucleare, Sezione di Padova, I-35131 Padova, Italy
12 Dipartimento di Fisica “G. Galilei,” Università di Padova, I-35131 Padova, Italy
13 Department of Physics, Center for Cosmology and Astro-Particle Physics, The Ohio State University, Columbus, OH 43210, USA
14 Istituto Nazionale di Fisica Nucleare, Sezione di Perugia, I-06123 Perugia, Italy
15 Dipartimento di Fisica, Università degli Studi di Perugia, I-06123 Perugia, Italy
16 Dipartimento di Fisica “M. Merlin” dell’Università e del Politecnico di Bari, I-70126 Bari, Italy
17 Istituto Nazionale di Fisica Nucleare, Sezione di Bari, 70126 Bari, Italy
18 Laboratoire Leprince-Ringuet, École polytechnique, CNRS/IN2P3, Palaiseau, France
19 Department of Physics, University of Washington, Seattle, WA 98195-1560, USA
20 INAF-Istituto di Astrofisica Spaziale e Fisica Cosmica, I-20133 Milano, Italy
21 Department of Physics, Royal Institute of Technology (KTH), AlbaNova, SE-106 91 Stockholm, Sweden
22 NASA Goddard Space Flight Center, Greenbelt, MD 20771, USA
23 George Mason University, Fairfax, VA 22030, USA
24 Laboratoire de Physique Théorique et Astroparticules, Université Montpellier 2, CNRS/IN2P3, Montpellier, France
25 Department of Physics, Stockholm University, AlbaNova, SE-106 91 Stockholm, Sweden
26 Agenzia Spaziale Italiana (ASI) Science Data Center, I-00044 Frascati (Roma), Italy
27 Dipartimento di Fisica, Università di Udine and Istituto Nazionale di Fisica Nucleare, Sezione di Trieste, Gruppo Collegato di Udine, I-33100 Udine, Italy
28 Université de Bordeaux, Centre d’Études Nucléaires Bordeaux Gradignan, UMR 5797, Gradignan, 33175, France
29 CNRS/IN2P3, Centre d’Études Nucléaires Bordeaux Gradignan, UMR 5797, Gradignan, 33175, France
30 Department of Physical Sciences, Hiroshima University, Higashi-Hiroshima, Hiroshima 739-8526, Japan; [email protected].
31 University of Maryland, College Park, MD 20742, USA
32 University of Alabama in Huntsville, Huntsville, AL 35899, USA
33 Department of Physics, Tokyo Institute of Technology, Meguro City, Tokyo 152-8551, Japan
34 Cosmic Radiation Laboratory, Institute of Physical and Chemical Research (RIKEN), Wako, Saitama 351-0198, Japan
35 Centre d’Étude Spatiale des Rayonnements, CNRS/UPS, BP 44346, F-30128 Toulouse Cedex 4, France
36 Istituto Nazionale di Fisica Nucleare, Sezione di Trieste, and Università di Trieste, I-34127 Trieste, Italy
37 Center for Research and Exploration in Space Science and Technology (CRESST), NASA Goddard Space Flight Center, Greenbelt, MD 20771, USA
38 Istituto Nazionale di Fisica Nucleare, Sezione di Roma “Tor Vergata,” I-00133 Roma, Italy
2
1249
1250
ABDO ET AL.
40
Vol. 703
39 Department of Physics and Astronomy, University of Denver, Denver, CO 80208, USA
Department of Physics, Graduate School of Science, University of Tokyo, 7-3-1 Hongo, Bunkyo-ku, Tokyo 113-0033, Japan
41 Max-Planck Institut für extraterrestrische Physik, 85748 Garching, Germany
42 Institute of Space and Astronautical Science, JAXA, 3-1-1 Yoshinodai, Sagamihara, Kanagawa 229-8510, Japan
43 Department of Physics and Astronomy, Iowa State University, Ames, IA 50011-3160, USA
44 Institut für Astro- und Teilchenphysik, Leopold-Franzens-Universität Innsbruck, A-6020 Innsbruck, Austria
45 Institut de Ciencies de l’Espai (IEEC-CSIC), Campus UAB, 08193 Barcelona, Spain
46 Department of Chemistry and Physics, Purdue University Calumet, Hammond, IN 46323-2094, USA
47 Institució Catalana de Recerca i Estudis Avançats, Barcelona, Spain
48 Consorzio Interuniversitario per la Fisica Spaziale (CIFS), I-10133 Torino, Italy
49 University of Maryland, Baltimore County, Baltimore, MD 21250, USA
50 Dipartimento di Fisica, Università di Roma “Tor Vergata,” I-00133 Roma, Italy
51 School of Pure and Applied Natural Sciences, University of Kalmar, SE-391 82 Kalmar, Sweden
Received 2009 June 10; accepted 2009 August 10; published 2009 September 8
ABSTRACT
Observations by the Large Area Telescope (LAT) on the Fermi mission of diffuse γ -rays in a mid-latitude region
in the third quadrant (Galactic longitude l from 200◦ to 260◦ and latitude |b| from 22◦ to 60◦ ) are reported. The
region contains no known large molecular cloud and most of the atomic hydrogen is within 1 kpc of the solar
system. The contributions of γ -ray point sources and inverse Compton scattering are estimated and subtracted.
The residual γ -ray intensity exhibits a linear correlation with the atomic gas column density in energy from
100 MeV to 10 GeV. The measured integrated γ -ray emissivity is (1.63±0.05)×10−26 photons s−1 sr−1 H−atom−1
and (0.66 ± 0.02) × 10−26 photons s−1 sr−1 H−atom−1 above 100 MeV and above 300 MeV, respectively,
with an additional systematic error of ∼10%. The differential emissivity from 100 MeV to 10 GeV agrees
with calculations based on cosmic ray spectra consistent with those directly measured, at the 10% level.
The results obtained indicate that cosmic ray nuclei spectra within 1 kpc from the solar system in regions
studied are close to the local interstellar spectra inferred from direct measurements at the Earth within ∼10%.
Key words: cosmic rays – diffuse radiation – gamma rays: observations
1. INTRODUCTION
The diffuse high-energy γ -ray emission (E 30 MeV)
has been interpreted to be a superposition of γ -rays produced
via interactions between cosmic rays (CRs) and interstellar
matter, inverse Compton (IC) scattering of interstellar soft
photons off CR electrons, and the extragalactic diffuse γ -ray
emission. The first component, if distinguished from the others,
will enable using high-energy γ -ray observations for the study
of the distribution of CRs and the interstellar medium. The
distribution of neutral atomic hydrogen (H i) is traced by
21 cm line surveys and the molecular hydrogen distribution
is derived indirectly using 2.6 mm line observations of carbon
monoxide (CO). The total gas column density can also be traced
indirectly from extinction and reddening by dust. Thus, the
spectrum and the flux of CRs can be obtained from sufficiently
sensitive observations of high-energy γ -rays. The observation of
diffuse γ -rays away from the Galactic plane (Galactic latitude
|b| 10◦ ) is suitable for studying local CRs, since diffuse
γ -rays in such regions are less affected by contamination from
strong point sources, and most of the gas along the line of
sight is local. The SAS-2 (e.g., Fichtel et al. 1978) and COS-B
observations (e.g., Lebrun et al. 1982) indicated a correlation
between the γ -ray intensities and the total gas column densities
at medium Galactic latitudes. Sreekumar et al. (1998) and
Strong et al. (2004) showed a good correlation between the
γ -ray intensities and model calculations in their analyses of
the extragalactic diffuse emission observed by EGRET onboard
the Compton Gamma-Ray Observatory. Despite these early
studies, the flux and spectrum of local CRs deduced from γ -ray
intensity remain uncertain, due to the possible contamination
from unresolved point sources and uncertainties in modeling
52 Royal Swedish Academy of Sciences Research Fellow, funded by a grant
from the K. A. Wallenberg Foundation.
the IC contribution because of the large-scale height of CR
electrons and the reprocessing of the interstellar radiation by
dust. Although CR nuclei in the vicinity of the solar system are
thought to have spectral distributions and intensities similar to
those measured at the Earth as reported by a number of γ -ray
observations (e.g, Hunter et al. 1997; Digel et al. 2001), data
above 1 GeV, which are crucial to distinguish CR nuclei spectra
from that of CR electrons, have not been good enough due to the
limited photon statistics and relatively limited energy coverage
of these early missions.
The situation has improved significantly with the recent
launch of the Fermi Gamma-ray Space Telescope on 2008
June 11. The Fermi LAT (Large Area Telescope) has a sensitivity that is more than an order of magnitude better than that
of EGRET and enables resolving point sources and studying
the diffuse γ -rays with unprecedented sensitivity. Recent advances of a CR propagation code GALPROP (e.g., Strong &
Moskalenko 1998), which had been developed through comparisons with the EGRET data, allow us to predict and subtract IC
emission and correlate γ -ray emission with interstellar matter
more accurately.
In this paper, we present Fermi LAT observations of diffuse
γ -rays in a mid-Galactic latitude region in the third quadrant
(Galactic longitude l from 200◦ to 260◦ and |b| from 22◦ to
60◦ ). As discussed in the following sections, most of the gas
along the line of sight is local, nearby on the scale of the
Milky Way. The contribution from IC emission is only about
10% of the total diffuse emission and the LAT has already
resolved five times as many γ -ray point sources as previous
missions in this region. These facts enable us to evaluate
the local CR flux and the spectrum with small systematic
uncertainty.
FERMI LAT OBSERVATION OF DIFFUSE GAMMA RAYS
60
The LAT is the main instrument of the Fermi Gamma-ray
Space Telescope. It consists of 4×4 modules (towers) built with
tungsten foils and silicon microstrip detectors to measure the
arrival directions of incoming γ -rays, and a hodoscopic cesium
iodide calorimeter to determine the photon energies. They are
surrounded by 89 segmented plastic scintillators serving as
an anticoincidence detector to reject charged-particle events.
Details of the LAT instrument and prelaunch expectations of the
performance can be found in Atwood et al. (2009). The excellent
sensitivity of the LAT is exemplified by initial publications such
as Abdo et al. (2008).
Routine science operations with the LAT began on 2008
August 4. We have accumulated events from 2008 August 4
to 2009 January 31 to study diffuse γ -rays. During this time
interval the LAT was operated in sky survey mode nearly all of
the time; in this observing mode, the LAT scans the sky, obtaining a complete sky coverage every two orbits and relatively
uniform exposures over time. We used the standard LAT analysis software, ScienceTools53 version v9r11, and applied the
following event selection criteria: (1) events have the highest
probability of being photons, i.e., they are categorized as socalled diffuse class (Atwood et al. 2009), (2) the reconstructed
zenith angles of the arrival direction of photons are selected to
be less than 105◦ , in order to exclude periods where the Earth
enters the LAT field of view, and (3) the center of the LAT
field of view is within 39◦ from the zenith in order not to include the data taken in the pointed observation mode, because it
has increased contamination from Earth albedo γ -rays. We also
eliminated the period of time during which the LAT detected
two bright GeV-emitting GRBs, i.e., GRB080916C (Abdo et al.
2009a) and GRB081024B (Omodei et al. 2008). We then generated count maps (using gtbin in ScienceTools) and exposure
maps (using gtexpcube) in 13 logarithmically sliced energy bins
from 100 MeV to 9.05 GeV. A post-launch response function
P6_V3_DIFFUSE, which was developed to account for the
γ -ray detection inefficiencies that are correlated with trigger
rate, was used in exposure calculations. These count and exposure maps were prepared in Cartesian coordinates in 0.◦ 5 × 0.◦ 5
binning, and then transformed into HEALPix54 (Górski et al.
2005) equal area sky maps of order 7. They are used below
to correlate the γ -ray intensities with the column densities of
atomic gas along the line of sight; the γ -ray intensity is calculated as the ratio of the counts and the exposures for each energy
bin.
55
3. DATA ANALYSIS
3.1. Subtraction of Inverse Compton and Point Sources
To distinguish γ -rays produced in the interstellar medium
from others, we referred to the GALPROP prediction of IC
emission and an LAT source list for 6 month data.55 This list
was produced using a similar procedure used to obtain the
LAT Bright Source List described by Abdo et al. (2009b). It
covers the same period of time as that of our data set and
contains 740 point sources with significance more than 5σ .
We adopted positions and spectral parameters from this list
(single power-law model in 100 MeV–100 GeV) to estimate
102
50
45
Counts
Galactic Latitude (degree)
2. OBSERVATION AND DATA REDUCTION
1251
40
30
25
260
250
240
230
220
Galactic Longitude (degree)
210
1
200
Galactic Latitude (degree)
-25
102
-30
-35
-40
-45
10
-50
-55
-60
260
250
240
230
220
Galactic Longitude (degree)
210
200
1
Figure 1. Fermi LAT γ -ray count maps (E 100 MeV) of regions we analyzed.
Maps are in Cartesian projection with 0.◦ 5×0.◦ 5 binning. The north and the south
regions are shown in the upper panel and the lower panel, respectively. In these
regions there are 52 sources in the LAT 6 month source list, of which 13 sources
(indicated by green crosses) are included in the LAT Bright Source List (Abdo
et al. 2009b).
and subtract the photons from point sources to diffuse γ -ray
emission. GALPROP (e.g., Strong & Moskalenko 1998) is a
set of programs to solve the CR transport equation within our
Galaxy and predict the γ -ray emission produced via interactions
of CRs with interstellar matter (nucleon–nucleon interaction
and electron bremsstrahlung) and soft photons (IC scattering).
IC emission is calculated from the distribution of (propagated)
electrons and the interstellar radiation fields developed by
Moskalenko et al. (2006). Here we adopted the IC model
map with version 54_5gXvarh7S56 , which was used in another
Fermi LAT paper to study the diffuse γ -ray emission in
10◦ |b| 20◦ (Abdo et al. 2009d; Porter et al. 2009). The
CR electron spectrum is adjusted to agree with the directlymeasured pre-Fermi spectrum in the GALPROP model. In
order to minimize the uncertainty of the contribution from
IC emission on the diffuse γ -ray spectrum, we selected sky
regions away from the Galactic center; the lower CR electron
fluxes and interstellar radiation field will result in dimmer IC
emission than that toward the Galactic center. We chose the
third quadrant, Galactic longitude l from 200◦ to 260◦ and
the Galactic latitude b from −60◦ to −22◦ and from 22◦
to 60◦ . The region is free of known large molecular clouds;
Orion molecular clouds (Orion A and Orion B) and Monoceros
molecular cloud complexes are located in the region l from
200◦ to 220◦ and b from −10◦ to −20◦ , and the Taurus/Perseus
molecular clouds are in l from 150◦ to 185◦ (e.g., Dame et al.
2001; Digel et al. 1999; Digel & Grenier 2001). Therefore the
53
Available from the Fermi Science Support Center
(http://fermi.gsfc.nasa.gov/ssc/)
54 http://healpix.jpl.nasa.gov.
55 internally available to the LAT team.
10
35
Counts
No. 2, 2009
56
The GALPROP galdef ID of this version is available at the Web site
http://galprop.stanford.edu.
1252
ABDO ET AL.
10-2
Vol. 703
60
20
10-3
10-4
16
50
45
40
35
10
8
6
4
25
2
250
240
230
220
Galactic Longitude (degree)
210
0
200
104
region described is suitable for correlating the γ -ray intensities
with the local atomic-gas column densities.
In Figure 1, we show γ -ray count maps above 100 MeV.
There are 52 sources in the LAT 6 month source list in our
region of interest, more than five times as many sources in
the third EGRET catalog (Hartman et al. 1999) in this region (nine sources). The diffuse γ -ray spectrum, after masking sources with circular regions of 1◦ radius, is shown in
Figure 2. Atomic hydrogen column density maps of the same
region are given in Figure 3 (see Section 3.2 for details).
In Figure 2 and figures shown hereafter (Figures 4–6), the
γ -ray intensities or CR fluxes multiplied by E2 (where E is
the center of each energy bin in logarithmic scale) are presented. Also presented in Figure 2 is the contribution from IC
emission predicted by GALPROP, and the spillover from point
sources outside the mask regions estimated (using gtmodel) by
the spectral parameters given in the source list. Both the flux of
estimated IC emission and the residual point source contribution
are less than 15% of the total diffuse emission above 100 MeV.
We thus conclude that the uncertainty due to the IC and point
source contributions is negligible after we subtract them from
γ -ray data. Hereafter we analyze diffuse emission after masking point sources and subtracting IC emission and the residual
contributions from point sources.
3.2. Atomic Hydrogen Map
Column densities N(H i) of atomic hydrogen gas were calculated from existing radio surveys of the 21 cm line of H i. We
used the Leiden/Argentine/Bonn (LAB) Survey which merges
the Leiden/Dwingeloo Survey (Hartmann & Burton 1997) with
the Instituto Argentino de Radioastronomia Survey (Arnal et al.
2000; Bajaja et al. 2005) and covers the entire sky. We applied
an optical depth correction under the assumption of a uniform
spin temperature of 125 K and the cosmic microwave background intensity at 1420 MHz of 2.66 K (e.g., Hunter et al.
1994). The derived H i column density maps of our region of
interest are shown in Figure 3. Although major CO surveys
such as the one by Dame et al. (2001) do not cover the region we analyzed, no large molecular cloud is known there and
the molecular gas contribution is expected to be small due to
the moderately high Galactic latitude. See the discussion by
20
-25
18
-30
16
14
-35
1020 cm-2
Figure 2. Diffuse γ -ray spectrum in regions analyzed (l from 200◦ to 260◦ and
|b| from 22◦ to 60◦ ) after masking point sources with circular regions of 1◦
radius. IC emission predicted by GALPROP (54_5gXvarh7S) and the residual
point source contributions estimated from spectral parameters given in the LAT 6
month source list are shown by dotted and solid histograms, respectively. The
horizontal and vertical error bars indicate the energy ranges and 1σ statistical
errors, respectively.
Galactic Latitude (degree)
3
12
30
260
10
Energy (MeV)
14
1020 cm-2
Residual point source contributions
10-5 2
10
18
55
Inverse Compton (GALPROP)
Galactic Latitude (degree)
E2 × Flux (MeV 2 s-1 cm-2 sr -1 MeV-1 )
Diffuse spectrum
-40
-45
12
10
8
6
-50
4
-55
-60
260
2
250
240
230
220
Galactic Longitude (degree)
210
200
0
Figure 3. Column density maps of atomic hydrogen derived from the LAB
survey under the assumption of a uniform spin temperature of 125 K.
Dame et al. (2001) for the completeness of their survey. Hereafter we assume that all the gas is in atomic form and traced
by 21 cm radio surveys. Column densities of H i in our region
range from 1 × 1020 cm−2 up to 18 × 1020 cm−2 and the optical depth correction is rather small; the increase of the column
densities from those for the optically thin case (infinite spin
temperature) is 10% in most directions. On the assumption
of a Galactic rotation curve by Clemens (1985) for the case of
R0 = 8.5 kpc and θ0 = 220 km s−1 (where R0 and θ0 are the
Galactocentric radius and the orbital velocity of the local group
of stars, respectively), we infer that, in almost every direction in
our region, more than 80% of the H i along the line of sight is
within 1 kpc of the solar circle. Furthermore, by referring to the
vertical density distribution of H i given by Dicky & Lockman
(1990), we can conclude that more than 85% of atomic gas in
the line of sight is within 1 kpc of the solar system for |b| 22◦ .
3.3. Correlation of γ -ray Intensities and Gas Column Densities
The LAT point-spread function (PSF) strongly depends on
the photon energy (e.g., Atwood et al. 2009) and the energy
dependence of the angular size needs to be taken into account
in data analysis. We convolved the map of H i column densities
obtained as described in Section 3.2 using the GaDGET package
(Ackermann et al. 2008) with the LAT PSF for each of our energy
bins; in the convolution we used the all sky map to take account
of the contribution from outside the region for the analysis. Since
the typical angular size of the variation of column densities is
a few degrees (see Figure 3), only maps for the lowest energy
bands (less than a few hundred MeV) are noticeably smeared.
The γ -ray intensities, after masking point sources with 1◦
circular regions and subtracting the IC emission and the residual
FERMI LAT OBSERVATION OF DIFFUSE GAMMA RAYS
3.5
E2 × Intensity (10 MeV2 s-1 cm-2 sr -1 MeV-1 )
4
100-141 MeV
3
2.5
2
-3
-3
E2 × Intensity (10 MeV2 s-1 cm-2 sr -1 MeV-1 )
No. 2, 2009
1.5
1
0.5
2
4
6
8
10
12
14
20
HI column density (10 cm-2 )
16
18
3.5
E2 × Intensity (10 MeV2 s-1 cm-2 sr -1 MeV-1 )
4
1.6-2.26 GeV
3
2.5
6
400-565 MeV
5
4
3
2
1
2
4
6
8
10
12
14
20
HI column density (10 cm-2 )
16
18
20
16
18
20
3
2.5
6.4-9.05 GeV
2
1.5
-3
2
7
0
0
20
-3
E2 × Intensity (10 MeV2 s-1 cm-2 sr -1 MeV-1 )
0
0
1253
1.5
1
0.5
0
0
2
4
6
8
10
12
14
20
HI column density (10 cm-2 )
16
18
20
1
0.5
0
0
2
4
6
8
10
12
14
20
HI column density (10 cm-2 )
Figure 4. Correlation of the (IC and point sources subtracted) γ -ray intensities and the H i column densities in four representative bands. The map of N(H i) (Figure 3)
is convolved with the LAT PSF of the corresponding energy range. The horizontal and vertical error bars indicate the ranges of the column density and the 1σ statistical
errors, respectively. Data in high-energy range (above 1 GeV) are rebinned to have more than 10 γ -ray counts in each bin.
point source contributions, are correlated with the H i column
densities in each energy band. Both the γ -ray intensity map
and the H i column density map were prepared in HEALPix
equal area sky maps of order 7, whose pixel size in solid angle
is 6.39 × 10⁻⁵ steradian and is close to that of 0.5 × 0.5 deg2 .
We found a linear relationship between N(H i) and residual γ ray intensities for energies from 100 MeV to 10 GeV. Above
10 GeV, the correlation is limited by photon statistics. Figure 4
shows the correlation between γ -ray intensities and the H i
column densities for four representative energy bands. The
linear correlation indicates that point source contributions are
successfully subtracted and residual γ -rays mostly originate
from interstellar atomic gas through interactions with CRs,
plus isotropic diffuse component (extragalactic diffuse γ -rays,
the residual particle background, and a possible residual of IC
emission).
By fitting the correlation in each energy band with a linear
function using a χ 2 minimization, we obtained the intensity of
the isotropic diffuse component and the emissivity of atomic
gas as the offset and the slope, respectively, as summarized
in Table 1. Making the mask region larger, to 3◦ radius, gives
consistent fit parameters within statistical errors, confirming
that the contribution of point sources is well modeled and
subtracted. The obtained isotropic diffuse component (offset
column in Table 1) agrees within 10%–20% with the “Isotropic”
component given in Abdo et al. (2009d; see also Porter et al.
2009) which investigates the medium-latitude diffuse emission.
We note that the isotropic diffuse components obtained here and
in Abdo et al. (2009d; see also Porter et al. 2009) include the
residual background and thus should be regarded as an upper
limit of the true extragalactic diffuse γ -ray emission. We also
note that the adopted IC model affects the spectral shape and
the intensity of our isotropic component, whereas it does not
affect the emissivity significantly; modifying the IC emission by
±50% changes the offsets by 6%–7%, but alters the slopes less
than 3% except the lowest two energy bands. A detailed study of
the extragalactic diffuse emission and the residual background
using data for a larger sky area is underway and will be published
elsewhere (A. A. Abdo et al. 2009, in preparation).
So far, we have been neglecting the contribution from CR
interactions with ionized hydrogen (H ii). The low-density
ionized gas is unobservable, but can be inferred from dispersion
measures of pulsar signals in the radio band. According to the
model of Cordes & Lazio (2002), in the region we are studying,
N(H ii) is only (1–2) × 1020 cm−2 and fairly smooth. We thus
conclude that the contribution from ionized gas does not affect
the obtained emissivity significantly.
4. DISCUSSION
With the approach described in Section 3, we succeeded
in decoupling diffuse γ -rays related to the local atomic gas
from point sources, the IC emission, and the isotropic diffuse component. The derived differential γ -ray emissivity from
1254
ABDO ET AL.
Vol. 703
Table 1
A Summary of Fit Parameters with 1 Sigma Statistical Errors
Energy
(GeV)
Offset
Slope
(10−4 MeV2 s−1 cm−2 sr−1 MeV−1 ) (10−24 MeV2 s−1 sr−1 MeV−1 )
15.40 ± 0.54
17.10 ± 0.40
16.70 ± 0.36
15.83 ± 0.36
13.81 ± 0.39
12.57 ± 0.41
11.44 ± 0.44
10.23 ± 0.49
9.25 ± 0.54
8.44 ± 0.58
7.12 ± 0.64
6.44 ± 0.75
5.51 ± 0.77
0.10–0.14
0.14–0.20
0.20–0.28
0.28–0.40
0.40–0.56
0.56–0.80
0.80–1.13
1.13–1.60
1.60–2.26
2.26–3.20
3.20–4.53
4.53–6.40
6.40–9.05
1.04 ± 0.14
1.67 ± 0.10
1.91 ± 0.09
2.11 ± 0.10
2.33 ± 0.10
2.20 ± 0.11
2.17 ± 0.12
1.88 ± 0.13
1.72 ± 0.15
1.15 ± 0.16
1.10 ± 0.17
1.12 ± 0.21
0.71 ± 0.21
χ 2 /dof a
Data/Model counts b
21.90/13
18.12/14
13.47/14
16.92/14
6.65/14
16.17/15
12.26/15
9.06/14
13.16/14
10.56/12
15.07/11
11.35/11
9.92/9
11799/11678
27891/27738
31718/31564
28987/28850
22718/22073
16137/16063
11421/11368
7364/7327
4765/4733
2764/2747
1733/1712
1158/1144
678/664
Notes.
a Degree of freedom.
b Data and model total counts after masking point sources with circular regions of 1◦ radius. We believe that the small
(1%) excesses of the data counts over the model counts are due to unresolved point sources or interstellar matter not
traced by 21 cm line surveys.
E2 × Emissivity (MeV 2 s−1sr −1MeV−1)
10−23
∈M=1.84
Fermi−LAT data
total
∈M=1.45
nucleon−nucleon
electron bremsstrahlung
10−24
10−25 2
10
3
10
Energy (MeV)
104
Figure 5. Differential γ -ray emissivity from the local atomic hydrogen gas
compared with the calculated γ -ray production. The horizontal and vertical
error bars indicate the energy ranges and 1σ statistical errors, respectively. The
assumed interstellar proton, electron, and positron spectra are shown in Figure 6.
Estimated systematic errors of the LAT data are indicated by the shaded area.
A nucleus enhancement factor M of 1.84 is assumed for the calculation of the
γ -rays from nucleon–nucleon interactions. Dotted lines indicate the emissivities
for the case of M = 1.45, the lowest values in the referenced literature.
the local atomic gas is given in Figure 5. The systematic
uncertainty of the effective area of the response we used
(P6_V3_DIFFUSE) is estimated to be 10%, 5%, and 20% at
100 MeV, 560 MeV, and 10 GeV, respectively, and depend on
the energy linearly in a logarithmic scale. This systematic uncertainty is comparable with the statistical error, and is indicated
by the shaded area in the figure. The integral emissivity above
100 MeV and 300 MeV is (1.63 ± 0.05) × 10−26 photons s−1
sr−1 H−atom−1 and (0.66 ± 0.02) × 10−26 photons s−1 sr−1
H−atom−1 , respectively, with an additional systematic uncertainty of ∼10%. These values can be compared with those reported by early measurements. SAS-2 (Fichtel et al. 1978) obtained about 3 × 10⁻²⁶ photons s−1 sr−1 H−atom−1 and COS-B
(Lebrun et al. 1982) reported (1.67 ± 0.24) × 10−26 photons s−1
sr−1 H − atom−1 above 100 MeV. The EGRET analysis of various directions toward large molecular clouds (Digel et al.
2001) gives (1.65–2.4) × 10−26 photons s−1 sr−1 H−atom−1
and (0.71–1.0) × 10−26 photons s−1 sr−1 H−atom−1 above
100 MeV and 300 MeV, respectively. While most of these early
measurements are consistent with the LAT data, the emissivity
obtained by the LAT is much improved in photon statistics and
energy range.
We can give constraints on the local CR spectrum by
comparing the obtained emissivity with the model calculation
of interactions between CRs and interstellar matter. Many
evaluations of the γ -ray production due to CR interactions
in the interstellar medium have been made, including Stecker
(1973, 1989), Dermer (1986a, 1986b), Bertsch et al. (1993),
Mori (1997), Kamae et al. (2006), and Huang et al. (2007). In
the calculation of neutral pion production and decay γ -rays,
most authors have computed the γ -ray flux produced through
interactions of high-energy CR protons with proton targets. The
effects of heavy nuclei in both CRs and the target matter are
usually taken into account as a so-called nuclear enhancement
factor (M ) to multiply the proton–proton γ -ray yield. Although
the predicted γ -ray spectra from proton–proton interactions
assuming the same CR proton spectrum agree well (10%)
among these works (e.g., Kamae et al. 2006), the nuclear
enhancement factors differ by up to ∼30%; the factors range
from 1.45 to 1.80–2.0 as compiled by Mori (2009). Among
them, Dermer (1986a, 1986b) gives the lowest M of 1.45 and
Mori (2009) gives the highest M of 1.84 at the CR proton
kinetic energy of 10 GeV. His higher value of M is attributed
to the adoption of recent CR spectral formulae by Honda et al.
(2004) and the inclusion of nuclei heavier than He in both the
interstellar medium and the CR spectra. We thus regard M by
Mori (2009) as the most reliable.
In calculating the neutral pion production, we used the
proton–proton interaction formalism by Kamae et al. (2006).
They gave parameterized formulae of the π 0 inclusive cross
section and decay γ -ray spectra for arbitrary proton kinetic
energies from 0.488 GeV to 512 TeV. We adopted the proton
local interstellar spectrum (LIS) from the GALPROP model
with 54_5gXvarh7S and calculated the γ -ray spectrum from
nucleon–nucleon interactions using formulae given by Kamae
et al. (2006) under the assumption of the nuclear enhancement
No. 2, 2009
FERMI LAT OBSERVATION OF DIFFUSE GAMMA RAYS
E2 × Flux (MeV 2 s-1 cm-2 sr -1 MeV-1 )
proton, AMS
103
LIS by Shikaze et al. (2007)
proton, BESS-98
electron, AMS
electron, HEAT
102
φ=450 MV
10
galprop LIS
proton
electron
positron
1
10-1
2
2.5
3
3.5
4
4.5
log(E/MeV)
5
5.5
6
Figure 6. LIS of protons (thick blue line), electrons (thick red line), and positrons
(thin red line) used to calculate the γ -ray emissivity model in Figure 5 with a
compilation of direct measurements at the Earth; see Alcaraz et al. (2000a),
Sanuki et al. (2000), and Shikaze et al. (2007) for proton data and Alcaraz et al.
(2000b) and Barwick et al. (1998) for electron data. Modulated spectrum with
φ = 450 MV is given by the thin blue line. The proton LIS adopted by Shikaze
et al. (2007) is shown by the dotted blue line.
factor to be 1.84 as a representative value of those by Mori
(2009). In order to calculate the electron bremsstrahlung, we
fully utilized GALPROP, which calculates the γ -ray spectrum
using a formalism by Koch & Motz (1959) as explained by
Strong et al. (2000).
The predicted emissivity at the solar system (Galactocentric
radius R = 8.5 kpc and the height from the Galactic plane
z = 0 kpc) is compared with our LAT measurement in Figure 5,
and the LIS of proton, electron, and positron used in this model
calculation is presented in Figure 6. Also shown is a compilation of some measurements of proton and electron spectra at
the Earth. The proton and electron model spectra follow the
observed ones above a few tens of GeV; below this energy the
solar wind lowers the observed fluxes. We note that the CR electron spectrum measured by the LAT is somewhat harder than
the GALPROP model (Abdo et al. 2009c), but the effect on our
analysis is negligible. We also note that the bremsstrahlung at
around 100 MeV has comparable contributions from both primary electrons and secondary electrons/positrons, as discussed
by Porter et al. (2008). Their contributions are included in the
computed spectrum shown in Figure 5.
The true LIS is somewhat uncertain due to solar activity.
To model this solar modulation effect on the CR spectrum,
the formula by Gleeson & Axford (1968) generally has been
used, in which a single parameter φ is introduced. The proton
LIS we adopted reproduces the observations at the Earth with
φ = 450 MV as shown in Figure 6. The same data can also be
reproduced by a different formula of the LIS (dotted blue line)
with φ = 600 MV as described by Shikaze et al. (2007). We thus
regard the difference between two models as representing the
uncertainty of the LIS; they agree well (10%) above 10 GeV
and differ by ∼20% at about 3 GeV. This affects the calculated
emissivity by ∼20% and 10% at about 100 MeV and above
1 GeV, respectively (e.g., Mori 1997). We note that the LIS
we adopted better reproduces the observed proton spectrum
above 20 GeV. Although the true LIS below 1 GeV is highly
uncertain, these CRs do not contribute to the γ -ray emissivity
above 100 MeV significantly.
As shown in Figure 5, the emissivity measured by the LAT
agrees with the prediction from the assumed LIS and the recent
1255
estimate of M at the 10% level, which is comparable with the
statistical error and the current systematic uncertainty of the
LAT response. For reference, we also show the γ -ray emissivity
model obtained with the lowest M (among references in Mori
2009) of 1.45 that gives a predicted emissivity lower than
that observed in 100 MeV–10 GeV. Since the nucleon–nucleon
component is dominant in the emissivity spectrum especially
above 1 GeV, the observed agreement between the LAT data and
the model calculation (with the latest estimate of M ) indicates
that CR nuclei in the vicinity of the solar system in regions
observed have spectral distributions and intensities close to
those of the LIS inferred from measurements at the Earth within
∼10%. Although the constraint is rather weak, the agreement
down to 100 MeV also suggests that highly uncertain low-energy
(below a few hundred MeV) CR electron and positron spectra
are compatible with our assumption (GALPROP model with
54_5gXvarh7S) shown in Figure 6.
5. SUMMARY AND CONCLUSIONS
We report the observation of diffuse γ -rays in a mid-latitude
region in the third quadrant using data from the first six months
of Fermi LAT science observations. The region is away from
the Galactic plane and the Galactic center, and contains no
known large molecular cloud. Most of the atomic hydrogen is
within 1 kpc of the solar system, and thus the region is suitable
for studying the γ -ray emissivity of the local atomic gas and
CR spectra in the neighborhood of the solar system. Thanks to
the excellent performance of the LAT and recent developments
of the CR propagation code and the interstellar radiation field
model in GALPROP, we reliably estimated and subtracted the
contribution from point sources and IC emission. The residual
γ -ray intensities exhibit a linear relationship with the atomic
gas column densities from 100 MeV to 10 GeV, indicating that
non-isotropic γ -rays are produced through interactions of CRs
with interstellar atomic gas. The measurement of the emissivity
of local atomic hydrogen has already surpassed those by past
missions in photon statistics and the energy range. It agrees
with the prediction from CR spectra assumed, indicating that the
CR nuclei spectra in the vicinity of the solar system in regions
analyzed are close to the LIS inferred from direct measurements
at the Earth within ∼10%. Low energy CR electron/positron
spectra are suggested to be compatible with our assumption.
The Fermi LAT Collaboration acknowledges generous ongoing support from a number of agencies and institutes that have
supported both the development and the operation of the LAT as
well as scientific data analysis. These include the National Aeronautics and Space Administration and the Department of Energy
in the United States, the Commissariat à l’Energie Atomique
and the Centre National de la Recherche Scientifique/Institut
National de Physique Nucléaire et de Physique des Particules in
France, the Agenzia Spaziale Italiana and the Istituto Nazionale
di Fisica Nucleare in Italy, the Ministry of Education, Culture,
Sports, Science and Technology (MEXT), High Energy Accelerator Research Organization (KEK) and Japan Aerospace Exploration Agency (JAXA) in Japan, and the Swedish Research
Council, and the Swedish National Space Board in Sweden.
Additional support for science analysis during the operations
phase from the following agencies is also gratefully acknowledged: the Istituto Nazionale di Astrofisica in Italy and the
K. A. Wallenberg Foundation in Sweden.
Some of the results in this paper have been derived using the
HEALPix (Górski et al. 2005) package.
1256
ABDO ET AL.
REFERENCES
Abdo, A. A., et al. 2008, Science, 322, 1218
Abdo, A. A., et al. 2009a, Science, 323, 1688
Abdo, A. A., et al. 2009b, ApJS, 183, 46
Abdo, A. A., et al. 2009c, Phys. Rev. Lett., 102, 181101
Abdo, A. A., et al. 2009d, Phys. Rev. Lett., submitted
Ackermann, M., Jóhannesson, G., Digel, S., Moskalenko, I. V., Porter, A.,
Reimer, O., & Strong, A. 2008, in AIP Conf. Proc. 1085, High Energy
Gamma-ray Astronomy, ed. F. A. Aharonian, W. Hofmann, & F. Rieger
(Melville, NY: AIP), 763
Alcaraz, J., et al. 2000a, Phys. Lett. B., 472, 215
Alcaraz, J., et al. 2000b, Phys. Lett. B., 484, 10
Arnal, E. M., Bajaja, E., Larrarte, J. J., Morras, E., & Pöppel, W. G. L.
2000, A&AS, 142, 35
Atwood, W. B., et al. 2009, ApJ, 697, 1071
Bajaja, E., Arnal, E. M., Larrarte, J. J., Morras, R., Pöppel, W. G. L., & Kalberla,
P. M. W. 2005, A&A, 440, 767
Barwick, S. W., et al. 1998, ApJ, 498, 779
Bertsch, D. L., Dame, T. M., Fichtel, C. E., Hunter, S. D., Sreekumar, P., Stacy,
J. G., & Thaddeus, P. 1993, ApJ, 416, 587
Clemens, D. P. 1985, ApJ, 295, 422
Cordes, J. M., & Lazio, T. J. W. 2002, arXiv:astro-ph/0207156
Dame, T. M., Hartmann, D., & Thaddeus, P. 2001, ApJ, 547, 792
Dermer, C. D. 1986a, ApJ, 307, 47
Dermer, C. D. 1986b, A&A, 157, 223
Dicky, J. M., & Lockman, F. J. 1990, ARA&A, 28, 215
Digel, S. W., & Grenier, A. 2001, in AIP Conf. Proc. 587, Gamma-Ray
Astrophysics, ed. S. Ritz, N. Gehrels, & C. R. Shrader (Melville, NY: AIP),
538
Digel, S. W., Aprile, E., Hunter, S. D., Mukherjee, R., & Xu, F. 1999, ApJ, 520,
196
Digel, S. W., Grenier, I. A., Hunter, S. D., Dame, T. M., & Thaddeus, P.
2001, ApJ, 555, 12
Vol. 703
Fichtel, C. E., Simpson, G. A., & Thompson, D. J. 1978, ApJ, 222, 833
Gleeson, N., & Axford, W. I. 1968, ApJ, 154, 1011
Górski, K. M., Hivon, E., Banday, A. J., Wandelt, B. D., Hansen, F. K., Reinecke,
B., & Bartelmann, B. 2005, ApJ, 622, 759
Hartman, R. C., et al. 1999, ApJS, 123, 79
Hartmann, D., & Burton, W. B. 1997, Atlas of Galactic Neutral Hydrogen
(Cambridge: Cambridge Univ. Press)
Honda, M., Kajita, T., Kasahara, K., & Midorikawa, S. 2004, Phys. Rev. D, 70,
043008
Huang, C.-Y., Park, S.-E., Pohl, M., & Daniels, C. D. 2007, Astropart. Phys.,
27, 429
Hunter, S. D., Digel, S. W., de Geus, E. J., & Kanbash, G. 1994, ApJ, 436,
216
Hunter, S. D., et al. 1997, ApJ, 481, 205
Kamae, T., Karlsson, N., Mizuno, T., Abe, T., & Koi, T. 2006, ApJ, 647,
692
Koch, H. W., & Motz, J. W. 1959, Rev. Mod. Phys., 31, 920
Lebrun, F., et al. 1982, A&A, 107, 390
Mori, M. 1997, ApJ, 478, 225
Mori, M. 2009, Astropart. Phys., 31, 341
Moskalenko, I. V., Porter, T. A., & Strong, A. W. 2006, ApJ, 640, 155
Omodei, N., et al. 2008, GRB Coordinates Network, 8407
Porter, T., Moskalenko, I. V., Strong, A. W., Orlando, E., & Bouchet, L.
2008, ApJ, 682, 400
Porter, T., et al. 2009, arXiv:0907.0294
Sanuki, T., et al. 2000, ApJ, 545, 1135
Shikaze, Y., et al. 2007, Astropart. Phys., 28, 154
Sreekumar, P., et al. 1998, ApJ, 494, 523
Stecker, F. W. 1973, ApJ, 185, 499
Stecker, F. W. 1989, in Cosmic Gamma Rays, Neutrinos and Related Astrophysics, ed. M. M. Shapiro & J. P. Wefel (Dordrecht: Kluwer), 85
Strong, A. W., & Moskalenko, I. V. 1998, ApJ, 509, 212
Strong, A. W., Moskalenko, I. V., & Reimber, O. 2000, ApJ, 537, 763
Strong, A. W., Moskalenko, I. V., & Reimer, O. 2004, ApJ, 613, 956
© Copyright 2026 Paperzz