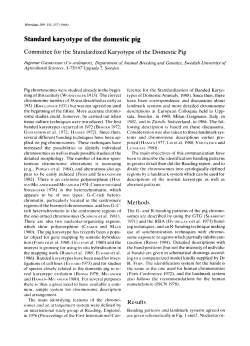
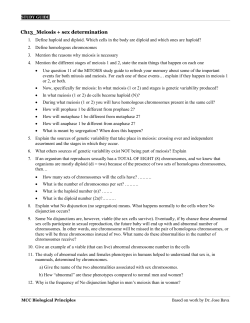
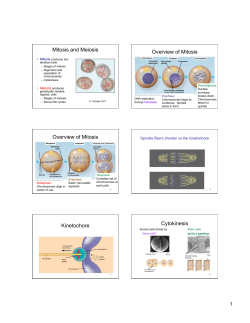
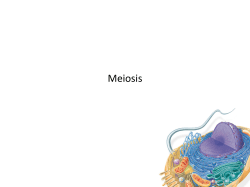
Gene 343 (2004) 245 – 251
www.elsevier.com/locate/gene
The pig genome: compositional analysis and identification of the
gene-richest regions in chromosomes and nuclei
Concetta Federicoa, Salvatore Sacconea,b, Letizia Andreozzia, Salvatore Mottaa,
Vincenzo Russob, Nicolas Carelsc, Giorgio Bernardic,*
b
a
Dipartimento di Biologia Animale bM. La GrecaQ, University of Catania, via Androne 81, 95124 Catania, Italy
Dipartimento di Protezione e Valorizzazione Agroalimentare, Sez. Allevamenti Zootecnici, University of Bologna,
via F.lli Rosselli 107, 42100 Reggio Emilia, Italy
c
Laboratorio di Evoluzione Molecolare, Stazione Zoologica bA. DohrnQ, Villa Comunale, 80121 Napoli, Italy
Received 27 June 2004; received in revised form 7 September 2004; accepted 17 September 2004
Available online 11 November 2004
Received by E. Olmo
Abstract
The isochore organization of the mammalian genome comprises a general pattern and some special patterns, the former being
characterized by a wider compositional distribution of the DNA fragments. The large majority of the mammalian genomes belong to the
former, and only some groups, such as the Myomorpha sub-order of Rodentia, belong to the latter. Here we describe the compositional
organization of the pig (Sus scrofa) genome that belongs to the general mammalian pattern. We investigated (i) the compositional
distribution of the genes by analysis of their GC3 levels (the GC levels at the third codon positions), and (ii) the correlation between the
GC3 value of orthologous genes from pig and other vertebrates (human, calf, mouse, chicken, and Xenopus). As expected, the highest
gene concentration corresponded to the H3 isochore family, and the highest GC3 correlations were observed in the pig/human and pig/
calf comparisons. Then we identified, by in situ hybridization of the GC-richest H3 isochores, the pig chromosomal regions endowed
by the highest gene-density that largely corresponded to the telomeric chromosomal bands. Moreover, we observed that these gene-rich
bands are syntenic with the previously identified GC-richest/gene richest H3+ bands of the human chromosomes. At the cell nucleus
level, we observed that the gene-dense region corresponded to the more internal compartment, as previously found in human and avian
cell nuclei.
D 2004 Elsevier B.V. All rights reserved.
Keywords: Mammals; Syntenic regions; Vertebrate genome; Gene density; Nucleus organization
1. Introduction
The vertebrate genome is a mosaic of isochores, the
compositionally fairly homogeneous DNA segments that
belong to two/six families, depending on the species
considered. In the pig genome, isochores belong to five
families: the GC-poor L1 and L2, and the GC-rich H1, H2,
* Corresponding author. Tel.: +39 81 583 3300; fax: +39 81 245 5807.
E-mail addresses: [email protected] (C. Federico)8 [email protected]
(S. Saccone)8 [email protected] (G. Bernardi).
0378-1119/$ - see front matter D 2004 Elsevier B.V. All rights reserved.
doi:10.1016/j.gene.2004.09.011
and H3 (see Bernardi, 2004, for a recent review). In the
mammalian genome, two different isochore patterns were
described: the general and the special patterns, the former
being characterized by a wider compositional distribution of
the DNA fragments compared to the latter (Sabeur et al.,
1993). The large majority of the mammalian genomes
(including that of the pig) belong to the general pattern, and
only some groups, such as the Myomorpha sub-order of
Rodentia, belong to the special pattern (Sabeur et al., 1993;
Cacciò et al., 1994). Interestingly, DNA sequences present
in the GC-rich compartments of warm-blooded vertebrates
show a high level of homology (Cacciò et al., 1994).
246
C. Federico et al. / Gene 343 (2004) 245–251
The GC-richest H3 isochore family is characterized not
only by the highest GC level, but also by the highest
concentration of genes, by a very high level of transcriptional activity, by the highest recombination frequency, by
the replication at the onset of the S phase of the cell cycle
and by an bopenQ chromatin structure (for more details, see
Bernardi, 2004). The GC-poorest isochore family L1 is
characterized by opposite features.
In the human chromosomes, the localization of the GCrichest (GCN50%) and the GC-poorest (GCb37%) isochores,
define two compositionally very different chromosomal
regions: the GC-richest regions are generally located in
telomeric position, the GC-poorest regions in internal bands
(Saccone et al., 1992, 1999; Federico et al., 2000). On the
basis to the isochore content, as obtained by in situ hybridization of the different isochore families, these regions were
called H3+ and L1+ bands, respectively. This nomenclature
was also supported by our analysis (Saccone et al., 2001) of
the recent draft of the human genome sequence (IHGSC,
2001). Moreover, two very different regions were described
in human nuclei: one, more internal, contains the GC-richest
and gene-richest isochores at a very high level of chromatin
decondensation, and the other one, more peripheral, contains
the GC-poorest and gene-poorest isochores at a very high
level of chromatin compaction (Saccone et al., 2002).
The pig genome is compositionally very similar to the
human genome, as observed by compositional DNA
fractionation (Sabeur et al., 1993). Here, we show the
compositional correlation among genes from pig and other
warm- and cold-blooded vertebrates and the compositional
features of the pig chromosomal bands and nuclei. The
compositional correlation of the pig/human syntenic chromosomal regions will be also described.
2. Materials and methods
2.1. Compositional analysis of genes
A total of 402 complete pig coding sequences from
GenBank (www.ncbi.nlm.nih.gov) were found and the
relative GC3 value, namely the average G+C level on the
third codon positions, were defined. Then 145, 67, 112,
24, 12 orthologous genes from human, calf, mouse,
chicken, and Xenopus, respectively, were obtained and
the relative GC3 values were used to establish the
compositional correlation between genes from one of
the above species and the orthologous pig genes.
Statistical analysis were performed using the StatView
1.03 software.
2.2. DNA probes
Compositional fractions of pig DNA were obtained by
preparative ultracentrifugation in Cs2SO4 density gradients
in the presence of the sequence-specific DNA ligand 3,6bis(acetato-mercuri-methyl)dioxane, BAMD, as previously
described (Cuny et al., 1981). The GC-poorest and the GCrichest fractions were then separated and the relative modal
buoyant density, q 0, was determined by analytical CsCl
ultracentrifugation. In the present work, we used two DNA
fractions: one (q 0=1.7009) containing the GC-poor isochores from the L1 and L2 families, and the other
(q 0=1.7126) containing the GC-rich isochores from the
H2 and H3 families. These DNA fractions were labelled
with biotin using a nick translation kit (Roche, Germany). A
DNA fraction (q 0=1.7136) containing the GC-richest H3
isochore family from the human genome (Saccone et al.,
Fig. 1. Compositional distribution of coding sequences. Histogram of the GC3 value (the GC levels of third codon positions) were obtained using 402
sequenced pig genes. The different colours of the histogram bars indicate the different isochore family to which they correspond, as shown on the left. The CsCl
density gradient profile of the pig main band DNA was superimposed to the GC3 histogram according to Zoubak et al. (1996).
C. Federico et al. / Gene 343 (2004) 245–251
247
1996), was also used as biotin-labeled probe, in heterologous in situ hybridizations.
2.3. Chromosome and nuclei preparation and in situ
hybridization
Pig metaphase chromosomes and cell nuclei were
prepared from phytohaemagglutinin-stimulated peripheral
blood lymphocytes using standard cytogenetic procedures.
Conventional methanol/acetic acid fixation and slide preparation were then carried out.
Two hundred nanograms of each biotin-labeled pig DNA
fraction was hybridized using the same conditions previously described for the human isochores (Saccone et al.,
1999; Federico et al., 2000), the only difference being the
addition of sheared total pig genomic DNA to suppress the
signals due to repetitive sequences present in the probe (the
amount of the competitor DNA was 500 times higher than
the probe DNA). Detection with the fluorescein isothiocyanate (FITC)-conjugated avidin was also performed as
described (Saccone et al., 1999).
In the case of the heterologous in situ hybridization of the
human GC-richest isochores on pig chromosomes, 200 ng
of the biotin-labeled probe plus the pig competitor DNA was
used as above described. The experimental conditions were:
(i) hybridization at 37 8C in a humidified box for 2 days, (ii)
post-hybridization washings at 42 8C in 2 SSC (SSC is
0.15 M NaCl/0.015 M Na-citrate), (iii) detection with FITCconjugated avidin, and (iv) staining with propidium iodide.
3. Results
3.1. Compositional features of the pig genes
The distribution of 402 complete sequenced pig coding
sequences, according to their GC3 levels, indicated that the
highest gene density corresponded to the highest GC3 values,
namely to the GC-rich isochore families H2 and H3 (Fig. 1).
This situation reflects the compositional distribution of genes
previously observed in man (Zoubak et al., 1996).
The GC3 values of the 402 pig genes were then compared
with the GC3 values of the orthologous genes from human,
calf, mouse, chicken, and Xenopus. The genomes of these
vertebrates are representative of the general mammalian
isochore pattern (human and calf), of the special myomorph
pattern (mouse), of the avian pattern (chicken), and of the
cold-blooded vertebrate pattern (Xenopus). The largest
number of sequenced orthologous genes was found in the
genome of man and mouse. The other species (in particular
Xenopus) showed a smaller number of sequenced orthologous genes (relatively to the 402 coding sequences
identified in the pig). As expected, the highest level of
correlation was observed between pig and man and pig and
calf genes (see Fig. 2). The correlation plot between the pig
and mouse genes confirms the compositional differences
Fig. 2. Compositional correlation between orthologous coding sequences.
Correlation plots between GC3 values of orthologous genes from man, or
bovine, or mouse, or chicken, or Xenopus, and pig. Each plot show the
regression line with the corresponding correlation coefficient (r) and the
number of gene pairs (N) considered in the analysis.
between the two isochore patterns (general versus special),
namely the absence in the mouse genome of very GC-poor,
as well as of very GC-rich isochores (Sabeur et al., 1993;
Cacciò et al., 1994). Correlation plots between pig and
chicken or Xenopus can only be considered as indications,
being obtained with a very small set of genes. They are,
248
C. Federico et al. / Gene 343 (2004) 245–251
Fig. 3. Compositional fractionation of pig DNA. Analytical CsCl profiles of
pig DNA fractions obtained by preparative centrifugation in a Cs2SO4/
BAMD density gradient. Fraction 1 (largely corresponding to L1 and L2
isochores) and fraction 4 (largely corresponding to H2 and H3 isochores)
were used in the present work.
Fig. 5. The H3+ band pattern of the pig karyotype. A pig karyotype from a
metaphase plate hybridized with the GC-richest isochore family DNA is
shown. DNA labeling, detection, and chromosome staining as in Fig. 4.
Note the complete absence of hybridization signals on the centromeric
regions, indicating that the suppression of the signals due to the repetitive
sequences present in the probe had occurred, namely, the hybridization
signals are due to the unique sequences present in the probe.
however, in agreement with previous comparisons with
human genes.
3.2. The gene-rich chromosomal bands
To identify the pig GC-richest chromosomal bands, we
hybridized a pig DNA fraction containing the H2 and the
H3 isochores (see Fig. 3). The results indicated the highest
concentration of hybridization signals on almost all the
telomeric non-heterochromatic bands as well as on a
number of internal bands (Figs. 4B and 5). This result
clearly shows the non-homogeneous distribution of the GCrichest isochores in the chromosomes. Moreover, we also
hybridized a DNA fraction containing the GC-poor L1 and
L2 isochores. The results showed that the hybridization
signals cover almost all the length of the chromosomes
except for the GC-rich regions (Fig. 4A), in agreement with
the compositional features of human chromosomal bands. In
fact, human H3+ bands, largely made up of H2 and H3
isochores, are completely depleted of the L1 isochores and
contain a negligible amount of L2 isochores (Federico et al.,
2000; Saccone et al., 2001).
3.3. Compositional correlation between pig and human
chromosomal regions
The in situ hybridization of the human H3 isochores on the
pig metaphase chromosomes (Fig. 4C) showed a distribution
of signals that, in general, coincided with the GC-rich regions
identified by homologous hybridization with the pig GCrichest isochores (Fig. 4B). Incidentally, these regions are
syntenic with the GC-richest bands of the human chromosomes, indicating that the previously identified syntenic
chromosomal regions from pig and human (Goureau et al.,
1996) showed a very high level of compositional correlation.
Fig. 6 shows three representative pig chromosomes and
the corresponding syntenic human chromosomes: (i) the
entire pig chromosome 12 is syntenic with human
Fig. 4. Chromosomal distribution of the GC-richest isochore family. Pig chromosomes hybridized with DNA fractions containing the GC-poorest (panel A),
and the GC-richest isochores (panel B) from the pig genome, and with the GC-richest isochores from the human genome (panel C). The white arrows in panel
A indicate some representative telomeric regions without hybridization signals. The isochore DNAs were biotin-labeled and detected with fluoresceinatedavidin (green/yellow signals). The chromosomes were stained with propidium iodide (red).
C. Federico et al. / Gene 343 (2004) 245–251
249
(Saccone et al., 2002) and others (Croft et al., 1999;
Bridger et al., 2000) previously showed, the results
obtained in the way above described are in general
agreement with those obtained when special procedures
for preserving cell integrity were used. Thus, the interior
of the nucleus in the pig cells is the GC-richest and
gene-richest compartment, in agreement with that
observed in the other warm-blooded vertebrates (Saccone
et al., 2002).
4. Discussion
Fig. 6. Pig/human syntenic chromosomal regions. Some representative pig
chromosomes (SSC6, SSC12, SSC13) are shown along with the syntenic
human (SSC: Sus scrofa); HSA: Homo sapiens sapiens). Pig and human
chromosomes show the H3+ band pattern, namely the GC-richest bands
(green/yellow signals). The white lines indicate the syntenic regions
between the pig and human chromosomes (see also text). Pig sinteny
from: http://www.toulouse.inra.fr/lgc/pig/compare/SSC.htm.
chromosome 17 (both very GC-rich chromosomes); (ii) pig
chromosome 13, containing four GC-rich regions, is
syntenic with human chromosomes 3 and 21, which have
the same number of GC-rich regions, even if some internal
rearrangements certainly occurred; (iii) pig chromosome 6
contains DNA sequences syntenic with at least four human
chromosomes (HSA1, 16, 18, and 19), and also in this
case the syntenic regions are characterized by the same
composition.
3.4. The gene-rich compartment in the cell nucleus
The hybridization of the GC-richest isochores in the
interphase nuclei showed the location of a large number
of signals in the internal part, the nuclear periphery being
always depleted of GC-rich isochores (Fig. 7). Since our
preparations were obtained by standard cytogenetic
procedures (hypotonic treatment of the cells, followed
by methanol-acetic acid fixation), that are not favourable
for chromatin structure conservation, this result could not
reflect the real chromatin conformation. However, as we
In summary, we obtained information on the following
subjects.
(1) The compositional distribution of the genes in the pig
genome (Fig. 1) provided a further demonstration on the
non-uniform distribution of the genes in the warm-blooded
genome, the highest concentration of genes being in the GCrich isochores.
(2) The correlations among the GC3 level of orthologous
genes from pig/man, pig/bovine, pig/mouse, pig/chicken,
and pig/Xenopus (Fig. 2) clearly showed that the highest
level of correlation was found with the bovine genome,
followed by the human one, as expected from phylogenetical distances (Cacciò et al., 1994). The type of regression
line obtained between the pig and mouse genes clearly
indicated that the two species belong to the two different
isochore patterns of mammals, pig showing the general
pattern and mouse the special one. In addition, the
correlation with the chicken and the Xenopus genomes
agreed with previous indications (see Bernardi, 2004), even
if the present correlations were obtained with a small
number of orthologous genes.
(3) The chromosomal distribution of the pig GC-richest
isochores, and the identification of the gene-richest chromosomal regions showed a non-homogeneous distribution
of the GC-richest isochores (belonging to the H2 and H3
families), with the large number of telomeric bands showing
hybridization signals (see Figs. 4B and 5). Then, the
hybridization of a pool of L1, L2 isochore families further
confirmed the GC-richest nature of the chromosomal
telomeric bands, the lack of hybridization signals in these
bands being very evident (see Fig. 4A). This result is in
Fig. 7. The GC-richest nuclear compartment. Some representative nuclei from pig cells hybridized with the GC-richest isochores. DNA labeling, detection, and
staining of the nuclei as in Fig. 4.
250
C. Federico et al. / Gene 343 (2004) 245–251
agreement with those previously described in other mammals, namely in human and mouse chromosomes (Saccone
et al., 1993, 1997). Moreover, the above GC-rich bands are
also rich in CpG islands, as demonstrated by the large
correspondence to the previously identified bands containing the highest density of CpG islands (McQueen et al.,
1997).
(4) The compositional correlation of the syntenic
regions from the pig and human chromosomes (Fig. 4C),
indicated that the pig/human syntenic regions are compositionally related, namely the gene-dense regions of pig and
human chromosomes are GC-rich. This also reflects what
was observed with the compositional distribution of the
coding sequences according to the GC3 value: the highest
gene density is in the H2/H3 isochore families, and
moreover, the high level of correlation among pig and
human orthologous sequences indicated that the same
genes, in pig and in man, are GC rich. This indicates that
the GC-richest regions of the pig chromosomes not only
are compositionally related to the human ones, but they
also contain the same set of genes, as also reported by
comparative analysis of the pig and human chromosomes
(Sun et al., 2002; Tuggle et al., 2001). This is further
confirmed by the syntenic correlation among the entire pig
chromosome 12 and the entire human chromosomes 17
(see Fig. 6): both are very GC-rich and contain, to a large
extent, the same genes. In addition, our present chromosomal compositional mapping is in agreement with the
gene content of the pig chromosomes obtained with the
recent EST radiation hybrid map (Rink et al., 2002).
If we correlate our present GC-rich bands (Fig. 5) with
the replication timing of the DNA during the S phase of the
cell cycle, we can observe a very high level of correspondence with the more intensely stained R bands (Rbnne et al.,
1987; Gustavsson, 1988; Rbnne, 1995), namely to the early
replicated regions of the chromosomes (Dutrillaux et al.,
1976; Drouin et al., 1991). This is a demonstration of
another very well-known feature of the genomic DNA,
namely the correlation of the DNA composition and of the
gene concentration with the replication timing (Federico et
al., 1998, 2000).
(5) The compositional compartmentalization of the pig
cell nucleus indicates a general scheme of the vertebrate
genome organization at the chromosomal and nuclear level,
whose structural and physiological relevance is under study
in our laboratories.
Thus, we can conclude that in mammals the compositional organization of the chromosomes and nuclei shows a
general plan: the GC-richest regions are in a few, generally
telomeric, regions endowed with other important features
correlated with the GC level, such as gene density, a more
open chromatin structure, and a very early replication
timing during the S phase of the cycle. Likewise, the
internal regions of the nuclei are characterized by a more
open chromatin structure, as previously reported in detail
for the human genome (Saccone et al., 2002).
Note added in proof
Our results (Saccone et al., 2002) on the open chromatin
structure of the gene-richest human isochores in interphase
nuclei (extended here to pig nuclei) have been confirmed
by Gilbert et al. [Cell 118 (2004) 555–556]. Most
surprisingly, these authors did not quote our results.
References
Bernardi, G., 2004. Structural and Evolutionary Genomics. Natural
Selection in Genome Evolution. Elsevier, Amsterdam.
Bridger, J.M., Boyle, S., Kill, I.R., Bickmore, W.A., 2000. Re-modelling of
nuclear architecture in quiescent and senescent human fibroblasts. Curr.
Biol. 10, 149 – 152.
Cacciò, S., Perani, P., Saccone, S., Kadi, F., Bernardi, G., 1994. Single-copy
sequence homology among the GC-richest isochores of the genomes
from warm-blooded vertebrates. J. Mol. Evol. 39, 331 – 339.
Croft, J.A., Bridger, J.M., Boyle, S., Perry, P., Teague, P., Bickmore, W.A.,
1999. Differences in the localization and morphology of chromosomes
in the human nucleus. J. Cell Biol. 145, 1119 – 1131.
Cuny, G., Soriano, P., Macaya, G., Bernardi, G., 1981. The major components
of the mouse and human genomes: 1. Preparation, basic properties and
compositional heterogeneity. Eur. J. Biochem. 115, 227 – 233.
Drouin, R., Lemieux, N., Richer, C.-L., 1991. Chromosome condensation
from prophase to late metaphase: relationship to chromosome bands and
their replication time. Cytogenet. Cell Genet. 57, 91 – 99.
Dutrillaux, B., Couturier, J., Richer, C.-L., Viegas-Pequinot, E., 1976.
Sequence of DNA replication in 277 R- and Q-bands of human
chromosomes using a BrdU treatment. Chromosoma 58, 51 – 61.
Federico, C., Saccone, S., Bernardi, G., 1998. The gene-richest bands of
human chromosomes replicate at the onset of the S-phase. Cytogenet.
Cell Genet. 80, 83 – 88.
Federico, C., Andreozzi, L., Saccone, S., Bernardi, G., 2000. Gene density
in the Giemsa bands of human chromosomes. Chromosome Res. 8,
737 – 746.
Goureau, A., Yerle, M., Schmitz, A., Riquet, J., Milan, D., Pinton, P., Frelat,
G., Gellin, J., 1996. Human and porcine correspondence of chromosome segments using bidirectional chromosome painting. Genomics 36,
252 – 262.
Gustavsson, I., 1988. Standard karyotype of the domestic pig. Hereditas
109, 151 – 157.
International Human Genome Sequencing Consortium, 2001. Initial
sequencing and analysis of the human genome. Nature 409, 860 – 921.
McQueen, H.A., Clark, V.H., Bird, A.P., Yerle, M., Archibald, A.L., 1997.
CpG islands of the pig. Genome Res. 7, 924 – 931.
Rink, A., Santschi, E.M., Eyer, K.M., Roelofs, B., Hess, M., Godfrey, M.,
et al., 2002. A first-generation EST RH comparative map of the porcine
and human genome. Mamm. Genome 13, 578 – 587.
Rbnne, M., 1995. Localization of landmarks and bands in the karyotype of
Sus scrofa domestica. Comparison between different classification.
Hereditas 123, 155 – 168.
Rbnne, M., Stefanova, V., Di Berardino, D., Poulsen, B.S., 1987. The Rbanded karyotype of the domestic pig (Sus scrofa domestica L.).
Hereditas 106, 219 – 231.
Sabeur, G., Macaya, G., Kadi, F., Bernardi, G., 1993. The isochore patterns
of mammalian genomes and their phylogenetic implications. J. Mol.
Evol. 37, 93 – 108.
Saccone, S., De Sario, A., Della Valle, G., Bernardi, G., 1992. The highest
gene concentrations in the human genome are in T-bands of metaphase
chromosomes. Proc. Natl. Acad. Sci. U. S. A. 89, 4913 – 4917.
Saccone, S., De Sario, A., Wiegant, J., Raap, A.K., Della Valle, G., Bernardi,
G., 1993. Correlations between isochores and chromosomal bands in the
human genome. Proc. Natl. Acad. Sci. U. S. A. 90, 11929 – 11933.
C. Federico et al. / Gene 343 (2004) 245–251
Saccone, S., Cacciò, S., Kusuda, J., Andreozzi, L., Bernardi, G., 1996.
Identification of the gene-richest bands in human chromosomes. Gene
174, 85 – 94.
Saccone, S., Cacciò, S., Perani, P., Andreozzi, L., Rapisarda, A., Motta, S.,
Bernardi, G., 1997. Compositional mapping of mouse chromosomes and
identification of the gene-rich regions. Chromosome Res. 5, 293 – 300.
Saccone, S., Federico, C., Solovei, I., Croquette, M.F., Della Valle, G.,
Bernardi, G., 1999. Identification of the gene-richest bands in human
prometaphase chromosomes. Chromosome Res. 7, 379 – 386.
Saccone, S., Pavlicek, A., Federico, C., Paces, J., Bernardi, G., 2001.
Genes, isochores and bands in human chromosomes 21 and 22.
Chromosome Res. 9, 533 – 539.
Saccone, S., Federico, C., Bernardi, G., 2002. Localization of the generichest and the gene-poorest isochores in the interphase nuclei of
mammals and birds. Gene 300, 169 – 178.
251
Sun, H.S., Tuggle, C.K., Goureau, A., Fitzsimmons, C.J., Pinton, P.,
Chardon, P., Yerle, M., 2002. Precise mapping of breakpoints in
conserved synteny between human chromosome 1 and pig chromosomes 4, 6 and 9. Anim. Genet. 33, 91 – 96.
Tuggle, C.K., Genet, C., Shi, X.-W., Chardon, P., Sanchez-Serrano, I.,
Cravens, G., Milan, D., Yerle, M., 2001. Cytogenetic and radiation
hybrid mapping reveals conserved synteny and gene order between
human Chromosome 21 and pig Chromosome 13. Mamm. Genome 12,
397 – 399.
Zoubak, S., Clay, O., Bernardi, G., 1996. The gene distribution of the
human genome. Gene 174, 95 – 102.
© Copyright 2026 Paperzz