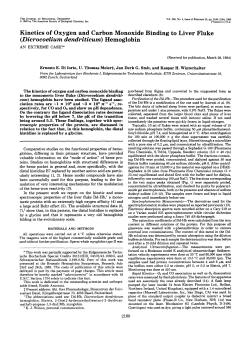
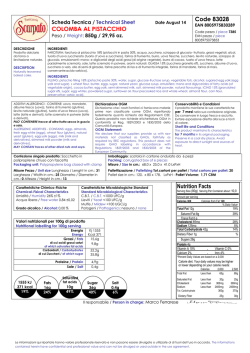
Meat Science 81 (2009) 238–244
Contents lists available at ScienceDirect
Meat Science
journal homepage: www.elsevier.com/locate/meatsci
Use of pure glycerol in fattening heavy pigs q
G. Della Casa a,*, D. Bochicchio a, V. Faeti a, G. Marchetto a, E. Poletti a, A. Rossi b,
A. Garavaldi c, A. Panciroli d, N. Brogna d
a
CRA Unità di Ricerca per la suinicoltura, Via Beccastecca, 345, 41018 San Cesario sul Panaro (MO), Italy
Centro Ricerche Produzioni Animali SpA (CRPA), 42100 Reggio Emilia, Italy
c
Fondazione C.R.P.A. Studi e Ricerche Onlus, 42100 Reggio Emilia, Italy
d
Dipartimento di Morfofisiologia Veterinaria e Produzioni Animali, Università di Bologna, Via Tolara di Sopra, 50, 40064 Ozzano Emilia (BO), Italy
b
a r t i c l e
i n f o
Article history:
Received 6 March 2008
Received in revised form 24 July 2008
Accepted 28 July 2008
Keywords:
Glycerol
Heavy pig
Meat quality
Fat quality
Sensory evaluation
a b s t r a c t
Eighty Italian Duroc Italian Large White pigs (BW 42.6 ± 3.37 kg) were used to determine the effects of
pure glycerol on growth performance and meat quality of heavy pigs. Pigs were divided into five groups
receiving 0% (control), 5% or 10% during the growing and finishing phases (42.6–160 kg BW)
(G+F5,G+F10) or 5% or 10% during the finishing period (100–160 kg BW) (FIN5,FIN10) of pure glycerol
in substitution for maize meal (on a dry matter basis). The pigs were slaughtered at approximately
160 kg BW. The growth performance of pigs fed 5% glycerol did not differ from controls regardless of
feeding duration, whereas those fed 10% glycerol showed reduced growth and poorer feed:gain ratio.
Fat quality and meat suitability for raw ham curing were not affected by dietary treatment. Differences
were not consistent enough to draw any conclusion about the effects of feeding glycerol on sensory
characteristics.
Ó 2008 Elsevier Ltd. All rights reserved.
1. Introduction
Glycerine (crude glycerol) is the main by-product of biodiesel
production. According to Thompson and He (2006), 79 g of crude
glycerine are generated for every litre of biodiesel produced. EC
Directive 2003/30 states that by 31 December 2010, biofuels
should account for 5.75% of all petrol and diesel for transport purposes. The Commission Green Paper ‘‘Towards a European strategy
for the security of energy supply” sets the objective of 20% substitution of conventional fuels by alternative fuels in the road transport sector by 2020 (Commission Green Paper, 2001).
Therefore, it may be argued that in the near future a large
amount of crude glycerol will be available in Europe. According
to Thompson and He (2006) glycerol, when refined to a chemically
pure substance, would be a very valuable by-product with hundreds of uses. Purifying it to that stage, however, is very costly
and generally not economically feasible for small to medium sized
plants. These size plants may represent the future of Italian biodiesel production to reduce harvesting and related costs of raw material transport (Riva, Foppa Pedretti, & Toscano, 2007). Animal
feeding may be an alternative utilization for crude glycerol if a suf-
q
Research supported by Regione Emilia Romagna (project manager Centro
Ricerche Produzioni Animali).
* Corresponding author. Tel.: +39 059926268; fax: +39 059928371.
E-mail address: [email protected] (G. Della Casa).
0309-1740/$ - see front matter Ó 2008 Elsevier Ltd. All rights reserved.
doi:10.1016/j.meatsci.2008.07.030
ficient degree of purity could be achieved with less expensive
refining systems.
In the last two decades some trials have been conducted on the
use of crude glycerol in growing/finishing pigs (Cerneau, Mourot, &
Peyronnet, 1994; Kijora & Kupsch 1996; Kijora, Kupsch, Bergner,
Wenk, & Prabucki, 1997; Lammers et al., 2007; Mourot, Aumaitre,
Mounier, Peiniau, & François, 1994). Mourot et al. (1994) found
that 5% of crude glycerol in diets with added animal or vegetable
fat leads to a reduction of drip and cooking loss in longissimus dorsi
and semimembranosus muscles. These data are consistent with the
results of Cerneau et al. (1994), who found an increased yield in
cooked ham production using thighs of pigs which had been fed
glycerol. Kijora and Kupsch (1996) found that both pure and crude
glycerol had no effects on meat quality, even though they found a
tendency toward a reduction in drip and press water loss. Mourot
et al. (1994) also found an increase in the percentage of oleic acid
and a decrease in the percentages of linoleic and linolenic acid in
subcutaneous fat. These findings partially agree with the results
of Cerneau et al. (1994), identifying an increase in the percentage
of palmitic acid and a decrease in linoleic acid, and the results of
Kijora et al. (1997), showing a tendency towards an increase of
oleic acid, a decrease of stearic acid and a significant reduction
of linoleic acid content.
Both subcutaneous fat fatty acid composition and ham water
loss during curing are important parameters for the production
of heavy pigs, whose thighs are utilized for the production of
the typical raw hams of Northern Italy. To avoid soft and oily
G. Della Casa et al. / Meat Science 81 (2009) 238–244
subcutaneous fat, the Parma Ham production rules provide that
the content of linoleic fatty acid must not exceed 15%, and the Iodine value must not exceed 70. Thereafter, each polyunsaturated
fatty acid reduction must be considered favourable for raw ham
quality. The water loss (and related salt absorption) during the
salting period, the first phase of cured ham production, is important both for the organoleptic and dietetic qualities of ham and
for its improved storage. In fact, excessive water loss increases
the saltiness and toughness in cured hams, whereas insufficient
salt absorption may cause putrefactive fermentations.
It is therefore important to understand what may be achievable
with the use of glycerol in heavy pig nutrition, not only from the
point of view of in vivo and slaughtering performances, but also
for its effect on meat and fat quality. To understand the effect of
glycerol per se this trial used pure glycerol as crude glycerine is
not a standard product.
2. Material and methods
2.1. Diets and animals
The study involved 80 Italian Duroc Italian Large White pigs
(average initial BW 42.6 ± 3.37), half barrows and half gilts subdivided in five groups of four replicates (four pigs per pen) according
to litter, gender, live weight and age. Pigs received either a maizebased (55%) diet without glycerol (control), or a substitution of 5%
or 10% maize (on a dry matter basis) with 5% or 10% glycerol,
respectively, throughout the entire growing and finishing phases
(G+F5 and G+F10, respectively), or a substitution of 5 or 10% maize
with 5% or 10% glycerol during the finishing phase (100 to 160 kg;
FIN5 and FIN10, respectively).
The diets were formulated according to the live weight of pigs
(Table 1). The Net Energy content of the diets was calculated
according to Noblet (1994). The transition from 90 to 120 diet to
the 120 to slaughter diet was not contemporary to the start of
the finishing phase. All pigs were wet fed (water to feed ratio of
2:1) and the daily ration was supplied in two meals all days except
on Sunday when the pigs received only the morning meal. Glycerol
(bidistilled glycerine 30 BE0 ) was added to water immediately before the meal for each pen. All pigs had free access to water. At
the start of the trial, the feed ration was 1.8 kg/pig/day, which
was increased by 0.2 kg weekly for two weeks and 0.1 kg weekly
for eleven weeks up to 3.3 kg/pig/day, which was maintained until
slaughter. Animals were weighed individually every 28 days, after
77 days (mean BW approximately 100 kg), and on the day before
slaughter. Pigs were slaughtered when the mean BW reached
Table 1
Composition of diets fed to control group
Periods
50–90 kg
90–120 kg
120 to slaughter
Ingredients (%)
Maize meal
Barley meal
Soybean oil meal
Soft wheat bran
Calcium carbonate
Dicalcium phosphate
Sodium chloride
Mineral-vit. premix
L-Lysine HCl
DL-Methionine
55.00
17.35
14.50
10.00
1.20
0.80
0.40
0.50
0.20
0.05
55.00
18.92
13.00
10.00
1.20
0.80
0.40
0.50
0.18
0.00
55.00
20.44
11.50
10.00
1.20
0.80
0.40
0.50
0.16
0.00
2.29
0.80
3.50
2.29
0.75
3.28
2.30
0.70
3.06
Calculated values
Net energy (Mcal/kg)
Lysine (%)
Lysine:N.E. ratio (g/Mcal)
239
approximately 160 kg. Two replicates per group were slaughtered
after 147 days of and two after 154 days.
Pigs were slaughtered according to industry-accepted procedures. Hot carcass weight, lean meat percentage by Fat–O–Meat’er
instrument (Commission Decision 2001/468/CE), thighs, shoulder
and loin weight were recorded during the first hour after slaughter.
0
Semimembranosus and biceps femoris muscles pH45 was measured
by pH-meter KNICK 910 (Portamess).
After the 24-h chilling period (0–2 °C) loins and thighs were
weighed, and hams were trimmed to the typical Parma ham
round-shape. Trimmed hams were weighed and final pH was measured on semimembranosus and biceps femoris muscles. The colour
of the semimembranosus muscle was measured using a colorimeter
Minolta Chroma-meter CR-300 (Illuminant D65, aperture size
8 mm) according to the CIE L*a*b* system (Poretta, 1993).
Subcutaneous fat and gluteus medius muscle were removed
from ham trimmings to determine subcutaneous and intramuscular fat fatty acid composition and subcutaneous fat Iodine value.
Samples were frozen in a conventional freezer and kept at
30 °C until analysis.
From eight loins for each group (two pigs selected randomly inside each pen 2 gender 1 replicate 2 slaughtering day) were
kept two portions. A 10–12 cm thick portion of loin (11th and 12th
ribs) was subdivided into a sample used to measure drip loss (sample weight 80–100 g), a sample with thickness of 50 50 10 mm
to measure cooking loss and tenderness as Warner–Bratzler shear
force, and a sample (weight 200 g) to determine the proximate
analysis of the longissimus dorsi muscle. A 30–35 cm thick portion
of the same loins (2nd–3rd–4th and possibly 1st lumbar vertebrae)
was used perform a visual panel test on raw meat and a sensory
panel test on cooked meat.
Both hams of each pig were cured according to the production
regulations of the Consorzio del Prosciutto di Parma (Consortium
of Parma Ham) and weight losses were recorded after the 1st week
of salting, at the end of the salting period and after nine months of
curing.
2.2. Lipid analyses
The intramuscular fat was extracted by the chloroform/methanol method of Folch, Lees, and Sloane-Stanley (1957). Following De
Pedro, Casillas, and Miranda (1997), the subcutaneous tissue was
chopped into small pieces (approximately 0.5 cm3), placed in individual microwave-resistant glass containers, and heated in a laboratory microwave oven MDS-2000 (CEM CORPORATION Matthews
North Carolina) of 650 W power and 2450 MHz microwave frequency for 10 min at 33% power. The liquid fat obtained was filtered through anhydrous sodium sulphate. These samples were
used for both fatty acid composition analysis and Iodine value.
The preparation of methyl esters for both intramuscular and subcutaneous fat was performed following the method proposed by
Stoffel, Chu, and Ahrens (1959). About 100 mg of fat was dissolved
in methanolic HCl (5 ml) and placed at 100 °C for 40 min. After
cooling, 2 ml of water and 2 ml of hexane were added. The organic
phase was filtered through anhydrous sodium sulphate and injected into a Trace Ultra gas chromatograph (Thermo Electron Corporation) equipped with a flame ionization detector and an
automatic injection system (S 2000 Thermo Electron Corporation).
The column was a SP 2380 fused-silica capillary column (30 m
length, 0.25 mm i.d. 0.20 lm film thickness). The initial column
temperature was 160 °C raised to 250 °C in 20 min. The injector
and detector temperature was 250 °C.
The helium carrier gas pressure was 70 kPa, and 1 ll of sample
solution was injected (split ratio 1:40). Chrom–Card for Trace software for Windows (Version 2.3, Thermo Electron Corporation)
was used for data analysis. Identification was accomplished by
240
G. Della Casa et al. / Meat Science 81 (2009) 238–244
comparing the retention time of the unknown fatty acid methyl esters (FAME) with those of known FAME standard mixtures (Supelco, Inc. Alltech Associated, Inc., Deerfield, IL).
Iodine value was determined using the Hanus method (AOAC
920.158, Fats and Oils Hanus Method, 1990).
2.3. Longissimus dorsi muscle analyses
Drip loss and cooking loss were determined by Honikel’s gravimetric methods (Honikel, 1998).
For drip loss, a meat sample of approximately 80–100 g
(±0.05 g) was placed within a plastic box on a supporting mesh
ensuring that the sample did not make contact with the box and
sealed. After 24 h at a chill temperature (1–5 °C) the samples were
taken out from the box, dabbed lightly on filter paper and weighed
again.
Drip loss was expressed as a percentage of the initial weight.
For cooking loss, a freshly cut meat sample of thickness 50 50 10 mm was weighed (weight 1) and placed in a water-bath,
with the water boiling continuously, in a thin plastic bag with its
opening above the surface. All the samples were cooked in the
same water-bath at the same time at 80 °C for 60 min to ensure
a core temperature of at least 75 °C. After they had been removed from the water-bath, the samples were cooled under
tap water for 20 min and kept at room temperature until equilibrated. The meat was then taken from the bag, dabbed lightly
on filter paper and weighed (weight 2). The cooking loss was
expressed as a percentage of the initial sample weight according
to the following equation: cooking loss = 100 ((weight 1 weight 2)/weight 1).
Warner–Bratzler shear force (WBSF) was determined by AMSA
methods ( AMSA, 1995). Cooked meat samples were cooled for
24 h at 4 °C. Six round cores (1.27 cm diameter) were removed
from each sample parallel to the long axis of the muscle fibers by
a mechanical coring device. Each core was sheared once through
the center by a WBSF device (V-shape blade) connected to an Instron Universal Testing Machine (model 1011, Instron Corp., Canton, MA). A 50-kg compression load cell and 200 mm/min crosshead speed were used. WBSF was expressed as peak force (kg).
The six cores were averaged for statistical analysis.
The proximate chemical composition of the muscle tissues was
determined according to standard methods of AOAC. (1990) on
freeze-dried milled samples. The measurement of intramuscular
fat content was determined by the Soxhlet method (Soxtec System
HT6, Tecator AB). Crude protein was determined using a Kjeldahl
Nitrogen/Protein Analyzer. (Gerhadt Vapodest 50, Gerhardt.
GMBH). Ash content was determined by ashing samples in a muffle
furnace at 500 °C.
2.4. Longissimus dorsi muscle sensory evaluation
The longissimus dorsi muscle was removed from the bone
(Schivazappa, Virgili, & Puglia, 2001) and divided into chops with
a thickness of about 1.5 cm and immediately placed in vacuum at
20 °C until analysis, within one month. The sensory tests were
conducted following the standard UNI 10957 (UNI – Norma italiana,
Ente Nazionale Italiano di Unificazione, 2003). A panel of nine assessors were selected and trained according to the ISO 8586-1 (International Organization for Standardization, 1993) and 8586-2
(International Organization for Standardization, 1994) rules. A
descriptive form was used for the sensory evaluation setting out
nine sensory attributes (two visual, one olfactory, two flavour-related and four tactile). The descriptive factors analyzed were colour
and marbling for raw samples and odour intensity, flavour intensity,
buttery flavour, tenderness, juiciness, masticability, fibrous texture
for cooked meat. These factors were evaluated with the use of a
structured continuous scale of values between 0 and 10 (0 = absence
of sensation, 10 = greatest intensity of sensation). The scales (0–10)
were as follows. Color: 0–2, light pink, reference samples chicken
breast (t 0–8 °C); 2–4, dark pink, reference samples pork chop
(t 0–8 °C); 4–5, light red, reference samples pork chop after 2 h at
room temperature; 5–6, bright red, reference samples beef steak
(t 0–8 °C); 7–8, dark red, reference samples neck after few days;
9–10, brown, reference samples horse steak after few days. Marbling: 0–2, low on one side of the slice; 2–3, high on one side of
the slice; 4–5, low on two or three side of the slice; 6–7, high on
two or three side of the slice; 7–8, low on all sides of the slice; 9–
10, high on all sides of the slice. Masticability (number of chewings
required to masticate the sample for swallowing): 0–2, more than
30 bites (min. 27); 2–4, from 27 to 21 bites; 4–6, from 21 to 15 bites;
6–8, from 15 to 9 bites; 8–10, from 9 to less than 5 bites. Fibrous
texture (perception of the muscle fibers in the sample after 3–4
chewings): 0–2, not all fibrous; 2–4, not much fibrous; 4–6, quite
fibrous; 6–8, fibrous; 8–10, very fibrous. The day before the sensory
assessment, the vacuum samples were thawed at 2–8 °C. For raw
evaluations, samples were removed from vacuum about 1-h before
the test and stored at 2–8 °C until analysis. Colour and marbling
were always evaluated on a whole chop placed on an opaque white
polystyrene commercial container for food (Parolari, 1985).
The evaluation of the cooked meat was on two small cubes
(1.5 1.5 1.5 cm), eliminating connecting parts that might differentiate them. Cooking was performed on a cast iron hot plate
brought to about 200 °C at least half an hour prior to the test.
The temperature of the meat was monitored constantly with a
probe. The chops were turned every 2 min and removed from the
hot plate once their core temperature reached 70 °C. They were
then cut into homogeneous cubes immediately and served hot
(Schivazappa et al., 2001).
Each individual test involved the evaluation of all five groups,
first evaluating the raw meat and then the cooked samples. The order of presentation of the different samples over the five testings
was varied during the test to avoid possible effects in the response
of the assessors based on order of presentation/cooking. All samples were coded with three-figure numbers, changing for each tasting session.
2.5. Statistical analysis
The data regarding body weight gain and food conversion rate
were subjected to variance analysis with GLM procedure using
the SAS System, 8.2 release for Windows, according to the following model: yij = M + Di + Eij where yij = dependent variable observed
on the jth subject (the pen) of the ith subgroup; M = general mean;
Di = diet (i = 1, 5); Eij = residual error. There were four pens, two
pens with castrated males and two pens with entire females, for
each of five dietary treatments. The Bonferroni t test (a = 0.01,
0.05) was used for pair-wise comparisons of variables differing
by P 6 0.05. The model used for the other measured parameters
(except the sensory panel test) was: yijkl = M + Di + Gj + Sk + (DGS)ijk
+ Eijkl where yijkl = dependent variable observed on the lth subject
(the pig) of the ijkth subgroup; M = general mean; Di = diet
(i = 1,5); Gj = slaughtering day (j = 1, 2); Sk = sex (k = 1, 2);
(DGS)ijk = interaction diet slaughtering day sex; Eijkl = residual
error. The Bonferroni t test (a = 0.01, 0.05) was used for pair-wise
comparisons of variables differing by P 6 0.05.
The sensory panel test analysis of the data was carried out in
accordance with the UNI 10957 regulations. The data as a whole
was subjected to univaried variance analysis with three factors
(samples, assessors and replicate) and two interactions (threeway ANOVA) to study the effects linked to the product, the replicate/assessment and the assessors (SPSS vers.15.0 – univaried
GLM) by statistical testing of multiple comparison on the basis of
241
G. Della Casa et al. / Meat Science 81 (2009) 238–244
Table 2
Growth performance data for heavy pigs fed 0%, 5%, or 10% glycerol during the finishing period or during the growing and finishing periods
Feeding period
Control
Glycerol 5
Growing-finishing
Glycerol 10
Growing-finishing
Glycerol 5
Finishing
Glycerol 10
Finishing
Error mean square
Pens (n)
4
4
4
4
4
Mean live weight
Day 0 (kg)
After growing period (kg)
At slaughtering (kg)
42.6
101.7
161.1ab
42.6
102.4
161.8a
42.6
100.3
156.1b
42.5
101.5
159.6ab
42.6
102.0
156.1b
9.15
7.83
3.76
Average daily gain
Growing period (g/d)
Finishing period (g/d)
Growing and finishing (g/d)
767
814a
790a
777
814a
795a
749
764ab
756a
767
794a
780ab
772
742b
757b
1209.41
3176.35
1108.76
Feed:gain ratio (on DM)
Growing period
Finishing period
Growing and finishing
2.41xy
3.28c
2.84c
2.38y
3.30c
2.84c
2.47x
3.49ab
2.97a
2.41xy
3.37bc
2.89bc
2.40xy
3.56a
2.95ab
0.0012
0.0036
0.0008
abc
xyz
Different letters, within a row, indicate significant differences (P 6 0.01).
Different letters, within a row, indicate significant differences (P 6 0.05).
Table 3
Hot carcass weights and wholesale cut weights from heavy pigs fed 0%, 5%, or 10% glycerol during the finishing period or during the growing and finishing periods
Feeding period
Control
Glycerol 5
Growing-finishing
Glycerol 10
Growing-finishing
Glycerol 5
Finishing
Glycerol 10
Finishing
Animals (n)
Hot carcass weighta (kg)
Dressing percentage (%)
Lean meat percentage (%)
Ham weights (kg)
Ham yieldb (%)
Shoulder weights (kg)
Shoulder yield b (%)
Loins ‘‘Bologna cut” weight (kg)
Loin yieldb (%)
16
135.8
84.3
48.1
34.0
25.0
19.5
14.4
15.2
11.2
16
135.9
84.0
49.4
34.3
25.2
19.1
14.0
15.3
11.3
16
131.4
84.2
49.3
33.0
25.1
18.8
14.3
14.6
11.1
15
134.3
84.2
48.6
33.4
24.9
19.1
14.2
14.9
11.2
16
131.0
83.9
49.1
32.8
25.0
18.6
14.2
14.6
11.0
a
b
Error mean square
61.87
1.09
5.50
6.52
1.05
1.67
0.22
1.23
0.34
Diaphragm, kidneys and flare fat.
Hot carcass weight.
Table 4
Ham muscle quality characteristics from heavy pigs fed 0%, 5%, or 10% glycerol during the finishing period or during the growing and finishing periods
Feeding period
Control
Glycerol 5
Growing-finishing
Glycerol 10
Growing-finishing
Glycerol 5
Finishing
Glycerol 10
Finishing
Animals (n)
45 min pH
Semimembranosus
Biceps Femoris
24 h pH
Semimembranosus
Biceps Femoris
Semimembranosus color
Lightness (L*)
Redness (a*)
Yellowness (b*)
Chroma
Hue angle
Cold hams weight (kg)
Cooling loss (%)
Trimmed hams weight (kg)
Trimming loss (%)
Hams weight after one week salting (kg)
Weight loss after one week salting (%)
Hams weight after salting (kg)
Weight loss after salting (%)
Hams weight after 9 m curing (kg)
Weight loss after 9 m curing (%)
16
16
16
15
16
Error mean square
6.06
6.04
5.99
6.06
6.04
6.08
6.01
6.12
6.02
6.19
0.0787
0.0635
5.61
5.66
5.61
5.64
5.62
5.67
5.57
5.65
5.56
5.61
0.0051
0.0098
49.25
9.59
4.58
10.67
25.25
33.5
1.4
27.7
17.2
27.1
2.1
26.6
4.0
20.0
28.0
47.95
9.93
4.30
10.84
23.25
33.8
1.4
28.0
17.3
27.4
2.1
26.9
4.0
20.2
27.8
49.61
9.54
4.67
10.65
26.00
32.5
1.4
27.1
16.8
26.5
2.1
26.0
4.0
19.6
27.7
48.50
10.82
4.96
1.93
4.58
33.0
1.4
27.1
17.7
26.6
2.1
26.1
3.9
19.6
27.6
50.01
10.13
4.97
11.31
25.94
32.3
1.4
26.7
17.4
26.1
2.1
25.6
3.9
19.3
27.8
8.2869
3.0686
1.2277
3.7763
14.8884
6.37
0.01
4.38
1.83
4.19
0.10
4.04
0.31
2.57
2.36
242
G. Della Casa et al. / Meat Science 81 (2009) 238–244
calculation of least significance difference (LSD) to identify difference sub-groups; a spider plot graphic was generated by excel.
mances than controls, and therefore, a worse feed:gain ratio
(P 6 0.01). In the same way, groups FIN5 and FIN10 showed similar
growth performance as controls in the growing period; whereas, in
the finishing period group FIN5 showed similar performance, and
group FIN10 had a poorer (P 6 0.01) growth rate and feed:gain ratio than controls.
The inferior performance of pigs receiving the 10% glycerol diets
may be due to free glycerol excretion via the urine. Serum glycerol
is transported across cell membranes very quickly through the
aquaglyceroporins (Jensen, 2002; Kozono, Yasui, King, & Agre,
2002) by osmotic or concentration gradients. In the cytoplasm
3. Results and discussion
3.1. Rearing and slaughtering
Group G+F5 (5% pure glycerol both in growing and in finishing
period) showed the same rearing performances (Table 2) as the
control. Group G+F10 showed poorer (P 6 0.01) growth perfor-
Table 5
Loin quality characteristics from heavy pigs fed 0%, 5%, or 10% glycerol during the finishing period or during the growing and finishing periods
Feeding period
Control
Glycerol 5
Growing-finishing
Glycerol 10
Growing-finishing
Glycerol 5
Finishing
Glycerol 10
Finishing
Animals (n)
Cold loin weight (kg)
Cooling loss (%)
Loins (n)
Drip loss (%)
Cooking loss (%)
Warner Bratzler shear force (kg)
16
15.0
1.28
8
1.56
39.1xy
3.12
16
15.1
1.34
8
1.89
39.2xy
3.18
16
14.4
1.32
8
1.57
38.8y
3.33
15
14.7
1.27
8
1.95
39.7xy
3.34
16
14.4
1.26
8
2.27
40.9x
3.15
0.6125
1.93
0.1669
Proximate analysisa
Crude protein (%)
Ether extract (%)
Ash (%)
86.96
8.82
4.22
85.90
9.46
4.18
85.80
10.01
4.26
84.77
10.48
4.17
86.16
9.78
4.29
12.8717
7.5839
0.0228
a
xyz
Error mean square
1.19
0.0163
Dry matter.
Different letters, within a row, indicate significant differences (P 6 0.05).
Table 6
Fatty acid composition of ham subcutaneous fat from heavy pigs fed 0%, 5%, or 10% glycerol during the finishing period or during the growing and finishing periods
Feeding period
Fatty acids
Myristic (%)
Palmitic (%)
Palmitoleic (%)
Stearic (%)
Octadecenoic (%)
Linoleic (%)
Linolenic (%)
Eicosenoic (%)
Eicosadienoic (%)
Iodine value
Saturated (%)
Monounsaturated (%)
Polyunsaturated (%)
abc
(C14:0)
(C16:0)
(C16:1)
(C18:0)
(C18:1n9 +C18:1n7)
(C18:2)
(C18:3)
(C20:1)
(C20:2)
Control
Glycerol 5
Growing-finishing
Glycerol 10
Growing-finishing
Glycerol 5
Finishing
Glycerol 10
Finishing
Error mean square
1.13
22.62
1.60
14.85
44.47b
13.65
0.22
0.81
0.64
65.2
38.61
46.88b
14.52
1.15
22.25
1.62
14.32
45.66ab
13.24
0.23
0.89
0.64
65.9
37.72
48.18ab
14.10
1.07
21.83
1.57
14.47
46.29a
12.91
0.22
0.99
0.65
66.1
37.37
48.85a
13.78
1.10
22.61
1.64
14.66
45.26ab
12.97
0.23
0.91
0.62
64.5
38.38
47.82ab
13.81
1.19
23.27
1.76
14.51
45.02ab
12.6
0.21
0.85
0.59
64.2
38.97
47.63ab
13.40
0.0262
1.6144
0.0786
1.0848
1.5227
1.6667
0.0016
0.0230
0.0034
4.67
2.6674
12.5673
1.7701
Different letters, within a row, indicate significant differences (P 6 0.01).
Table 7
Fatty acid composition of intramuscular fat from gluteus medius of heavy pigs fed 0%, 5%, or 10% glycerol during the finishing period or during the growing and finishing periods
Feeding period
Fatty acids
Myristic (%)
Palmitic (%)
Palmitoleic (%)
Stearic (%)
Octadecenoic (%)
Linoleic (%)
Linolenic (%)
Eicosenoic
Arachidonic (%)
Saturated (%)
Monounsaturated (%)
Polyunsaturated (%)
(C14:0)
(C16:0)
(C16:1)
(C18:0)
(C18:1n9 +C18:1n7)
(C18:2)
(C18:3)
(C20:1)
(C20:4)
Control
Glycerol 5
Growing-finishing
Glycerol 10
Growing-finishing
Glycerol 5
Finishing
Glycerol 10
Finishing
Error mean square
1.19
23.71
2.83
13.38
46.45
9.68
0.19
0.52
2.04
38.28
49.81
11.91
1.15
23.24
2.73
12.92
45.39
11.15
0.20
0.54
2.69
37.30
48.66
14.04
1.10
23.17
2.68
13.09
47.60
9.44
0.19
0.60
2.12
37.36
50.89
11.75
1.21
23.68
2.95
13.23
47.00
9.22
0.19
0.56
1.96
38.12
50.51
11.36
1.18
23.41
2.95
13.17
46.82
9.56
0.20
0.56
2.15
37.75
50.34
11.90
0.0183
0.8502
0.2584
1.0480
7.7467
4.1405
0.0019
0.0081
0.6010
2.4712
9.2482
7.6222
243
G. Della Casa et al. / Meat Science 81 (2009) 238–244
glycerol is activated by glycerol-kinase to glycerol-3-phosphate,
which cannot be transported through aquaglyceroporins. Therefore, the amount of glycerol that cells can retain depends on the
enzymatic glycerol-kinase activity which differs according to cell
type (Coppack, Persson, Judd, & Miles, 1999) and animal species.
Doppenberg and Van der Aar (2007) found that increasing the glycerol dose from 5% to 15% resulted in a more dramatic decrease in
metabolisable energy in pigs than in layers or broilers. According
to Bartelt and Schneider (2002), the glycerol Metabolizable Energy
(ME) for pigs fed 5%, 10% and 15% represents 97%, 80% and 59% of
the Gross Energy, respectively.
Lammers et al. (2007), in trials on weaning piglets kept in metabolic cages, found an ME of 3601, 3329 and 2579 kcal/kg using
doses of 5%, 10% and 20%, respectively. In finishing pigs they found
that energy in urine doubled with the increase of dietary glycerol
from 10% to 20%.
Kijora and Kupsch (1996) fed growing/finishing pigs (semi ad
libitum, i.e. the 80% of the ad libitum intake) a diet containing
the 0%, 5% or 10% of pure or crude glycerol and found an increase
of feed intake in diets with glycerol in conjunction with a greater
weight gain. Subsequently, feed:gain ratio was similar for all
groups. In a subsequent trial, Kijora et al. (1997) found similar results in relation to feed intake and growth rate, but a tendency towards a poorer feed: gain ratio for pigs fed 10% glycerol.
No differences were seen among groups (Table 3) for dressing
yield, lean meat content and lean cuts (thigh, loin, shoulder)
weight and yield. Similar results were obtained by Mourot et al.
(1993) who found no significant differences due to glycerol on carcass lean meat content and lean cut weights. Kijora and Kupsch
(1996) found that pigs fed the 10% crude glycerol had leaner carcasses than controls, but the authors ascribed the differences to
different gain intensity in the fattening period and not to glycerol
intake.
3.2. Meat and fat quality
Different diets did not influence the pH and colour of thigh
muscles (Table 4) or the ham weight loss recorded over 9 months
of curing, the period when the majority of weight loss occurs.
The ‘‘Bologna cut” loin cooling loss did not differ among groups
(Table 5). Neither drip loss nor cooking loss was influenced by glycerol, even though there appeared to be a tendency toward higher
loss in glycerol-fed pigs. These results are in contrast to the results
of Mourot et al. (1994), who found a significant reduction of drip
and cooking loss in pigs fed 5% glycerol, and Cerneau et al.
(1994), who found an increased cooking yield of the ham. Kijora
Table 8
Mean scores for sensory attributes of loins from heavy pigs fed 0%, 5%, or 10% glycerol
during the finishing period or during the growing and finishing periods
Feeding
period
Control
Glycerol
5
Growingfinishing
Glycerol
10
Growingfinishing
Glycerol
5
Finishing
Glycerol
10
Finishing
Error
mean
square
Colour
Marbling
Odourintensity
Flavour
intensity
Butter
flavour
Tenderness
Juiciness
Masticability
Fibrous
texture
4.3b
7.1c
5.2
4.3b
6.6d
5.3
4.2b
8.0a
5.4
5.0a
7.6b
5.4
4.2b
7.6b
5.1
0.96
1.13
1.02
5.1
5.0
5.1
5.1
5.1
0.99
abc
xyz
2.6
ab
6.0x
4.8
5.8
4.3
b
a
a
2.4
2.8
2.8
5.7x
5.0
5.8
4.2
5.8x
5.1
6.0
4.3
5.3y
4.6
5.6
4.7
a
0.89
5.7x
4.6
6.0
4.3
1.14
1.29
1.08
1.39
2.8
Different letters, within a row, indicate significant differences (P 6 0.01).
Different letters, within a row, indicate significant differences (P 6 0.05).
Average loin sensory profile
COLOUR
8,0
7,0
FIBROUS TEXTURE
MARBLING
6,0
5,0
4,0
3,0
MASTICABILITY
ODOUR INTENSITY
2,0
1,0
JUICINESS
FLAVOUR INTENSITY
TENDERNESS
control
FIN10
BUTTERY FLAVOUR
G+F10
FIN5
G+F5
Fig. 1. Spider’s web graph of the sensory profiles of loins from heavy pigs fed 0%, 5%, or 10% glycerol during the finishing period or during the growing and finishing periods.
244
G. Della Casa et al. / Meat Science 81 (2009) 238–244
and Kupsch (1996) found a tendency towards a reduction of drip
and press water loss in loin chops.
The fatty acid composition of the ham subcutaneous fat (Table
6) was influenced by treatment. Pigs receiving the higher dose of
glycerol for the entire growing-finishing period showed a higher
(P 6 0.01) octadecenoic acid content than controls and a tendency
toward a reduction in palmitic, stearic and linoleic acids. Because
of the tendency toward a reduction of both saturated and polyunsaturated fatty acid, Iodine value did not differ between group
G+F10 and control. The subcutaneous fatty acid composition of
other groups was intermediate. Mourot et al. (1994) also found
an increase in oleic acid with a significant reduction in linoleic acid.
Cerneau et al. (1994) found an increase in palmitic acid and a decrease in linoleic acid. Kijora et al. (1997) found a significant reduction in linoleic acid.
Intramuscular fatty acid composition (Table 7) was not influenced by the dietary treatment.
Thus in heavy pigs, the effect of substitution of 5% or 10% of
maize meal with pure glycerol did not affect the fresh meat quality
significantly and the suitability of ham for parma ham production.
Differences found between our results and those in the literature
may be due to genetic differences in the pigs concerned but are
mostly attributable to different slaughtering age and weight. In
fact, the pigs of Mourot et al. (1994), Cerneau et al. (1994) and
Kijora et al. (1997) were slaughtered at approximately 5–6 months
of age at a live weight of 99–112 kg; whereas the pigs in the present trial were slaughtered at nine months at a live weight of
160 kg. A very important result is that the weight loss of hams during curing was not influenced by diet. Increased weight loss is
attributable to increased water losses resulting in meat which is
too salty and tough; whereas decrease in weight loss is detrimental
because insufficient water loss, particularly in the salting period,
may facilitate microbial decay fermentations. Pure glycerol did
not substantially modify the fatty acid composition of subcutaneous fat achievable with traditional diets.
3.3. Sensory attributes
The attribute scores for sensory analysis (Table 8), showed significant differences for four sensory attributes (colour and marbling (P 6 0.001), buttery flavour (P 6 0.01) and tenderness
(P 6 0.05)). The G+F10, FIN5 and FIN10 groups showed higher marbling values and higher butter flavour values than the G+F5 group;
the control group showed intermediary values for both attributes.
The FIN5 group showed colour and tenderness values different
from the other groups. However the numeric differences between
groups were small when subjected to scale expansion (0–10) as
shown by Spider’s web graph (Fig. 1). Thus there were not enough
consistent differences in these attributes to drawn any conclusion
about the effects of feeding glycerol on sensory characteristics.
4. Conclusions
The substitution of 5% of maize meal with pure glycerol did not
modify the in vivo and slaughtering performance of heavy pigs or
the suitability of the meat and fat for curing, whereas a substitution of 10% caused a worsening of growth and feed efficiency performance without jeopardizing the suitability of meat and fat for
curing. So far as the sensory characteristics were concerned, the
tests on the longissimus dorsi muscle were not unequivocal. More
research is needed because the sensory evaluation of meat destined for fresh consumption may help improve heavy pig value.
The future increasing production of biodiesel will provide crude
glycerine that could be price competitive with cereals, mainly maize.
More information is thus needed about the use of crude glycerine for
a high quality production, such as heavy pig production.
References
AOAC (1990). Official methods of analysis (15th ed.). USA, Arlington, VA: Association
of Official Analytical Chemists.
AMSA (1995). Research guidelines for cookery, sensory evaluation and instrumental
tenderness measurements of fresh meat. Chicago, IL: American Meat Science
Association and National Live Stock and Meat Board.
Bartelt, J., & Schneider, H. D. (2002). Glycerine in der Tierernährung. UFOP-Schriften,
Bonn Germany, 15–36.
Cerneau, P., Mourot, J., & Peyronnet, C. (1994). Effet du glycérol alimentaire sur la
qualité de la viande de porc et le rendement technologique du jambon cuit.
Journées de la Recherche Porcine en France, 26, 193–198.
Commission Decision 2001/468/CE of 8 June 2001 authorising methods for grading
pig carcasses in Italy (2001). Official Journal L, 163, 31–33.
Commission Green Paper ‘Towards a European strategy for the security of energy
supply’ (2001), <http://www.jet.efda.org/documents/books/eugreenpaper.pdf>.
Coppack, S. W., Persson, M., Judd, R. L., & Miles, J. M. (1999). Glycerol and
nonesterified fatty acid metabolism in human muscle and adipose tissue
in vivo. American Journal of Physiology, 276(39), E233–E240.
De Pedro, E., Casillas, M., & Miranda, C. M. (1997). Microwave oven application in
the extraction of fat from the subcutaneous tissue of Iberian pig ham. Meat
Science, 45, 45–51.
Directive of the European Parliament and of the Council of 8 May 2003 on the
promotion of the use of biofuels or other renewable fuels for transport. Official
Journal L, 123, 42–46.
Doppenberg, J., & van der Aar, P. J. (2007). Applications of rapeseed meal or-expeller
and glycerine in diets for non ruminants. In J. Doppenberg & P. J. van der Aar
(Eds.), Biofuels: Implications for the feed industry (pp. 73–88). Wageningen:
Wageningen Academic Publishers.
Folch, J., Lees, M., & Sloane-Stanley, G. H. (1957). A simple method for the isolation
and purification of total lipids from animal tissues. Journal of Biological
Chemistry, 226, 497–509.
International Organization for Standardization (1993) ISO 8586-1:1993 – Sensory
analysis – General guidance for the selection, training and monitoring of
assessors – Part 1: Selected assessors.
International Organization for Standardization (1994) ISO 8586-2:1994 – Sensory
analysis – General guidance for the selection, training and monitoring of
assessors – Part 2: Experts.
Honikel, K. O. (1998). Reference methods for the assessment of physical
characteristics of meat. Meat Science, 49, 447–457.
Jensen, M. O. (2002). Energetics of glycerol conduction through aquaglyceroporin
GlpF. PNAS, 99(10), 6731–6736.
Kijora, C., & Kupsch, R. D. (1996). Evaluation of technical glycerols from
‘‘Biodiesel” production as a feed component in fattening pigs. Fett/Lipid, 98,
240–245.
Kijora, C., Kupsch, R. D., Bergner, H., Wenk, C., & Prabucki, A. L. (1997).
Vergleichende Untersuchungen zum Einsatz von Glycerin, freien Fettsäuren,
freien Fettsäuren und Glycerin sowie pflanzlichem Öl in del Schweinemast.
Journal of Animal Physiology and Animal Nutrition, 77, 127–138.
Kozono, D., Yasui, M., King, L. S., & Agre, P. (2002). Aquaporin water channels:
atomic structure and molecular dynamics meet clinical medicine. The Journal of
Clinical Investigation, 109, 1395–1399.
Lammers, P. J., Kerr, B. J., Weber, T. E., Dozier, W. A., III, Kidd, M. T., Bregendahl, K.,
et al. (2007). Digestible and metabolizable energy of crude glycerol for growing
pigs. Journal of Animal Science, 86, 602–608.
Mourot, J., Aumaitre, A., Mounier, A., Peiniau, P., François, A. C., Peyronnet, C., et al.
(1993). Effects du glycécol alimentaire sur les performances de croissance et la
qualité de la viande chez le porc Large White. Journées de la Recherche Porcine en
France, 25, 29–36.
Mourot, J., Aumaitre, A., Mounier, A., Peiniau, P., & François, A. C. (1994). Nutritional
and physiological effects of dietary glycerol in the growing pig. Consequences
on fatty tissues and post morten muscular parameters. Livestock Production
Science, 38, 237–244.
Noblet, J. (1994). Les systèmes d’appreciation de la valeur énergetique des aliments
pour le porc. Production Animales, 6(2), 105–115.
Parolari, G. (1985). Valutazione sensoria del colore delle carni. In G. Montedoro
(Ed.), Caratteristiche olfattive e gustative degli alimenti (pp. 291–299), Pinerolo,
Chiriotti Editori.
Poretta, S., (1993). Il colore dei prodotti alimentari. Principi e tecniche di valutazione
(pp. 11–43). Milano, Tecniche Nuove.
Riva, G., Foppa Pedretti, E., Toscano, G. (2007). Biocombustibili e biocarburanti.
Aspetti generali e tecnici della loro produzione e utilizzo con riferimento alla
situazione agricola nazionale. Quaderni dell’Accademia dei Georgofili. Lettura del
18 gennaio 2007 (16 p).
Schivazappa, C., Virgili, R., & Puglia, A. (2001). Effetto del tempo di frollatura sulla
tenerezza della carne suina nazionale (M. Longissimus dorsi). Rivista di
suinicoltura, 62(9), 123–127.
Stoffel, W., Chu, F., & Ahrens, E. H. Jr., (1959). Analysis of long-chain fatty acids by
gas-liquid chromatography. Analytical Chemistry, 31, 307–308.
Thompson, J. C., & He, B. B. (2006). Characterization of crude glycerol from biodiesel
production from multiple feedstock. Applied Engineering in Agriculture, 22(2),
261–265.
UNI – Norma italiana, Ente Nazionale Italiano di Unificazione (2003). Analisi
sensoriale- Metodo per la definizione del profilo sensoriale degli alimenti e
delle bevande. UNI10957.
© Copyright 2026 Paperzz