SLAC-PUB-8408
June 2000
arXiv:hep-ex/0006019v1 14 Jun 2000
FIRST DIRECT MEASUREMENT OF THE
PARITY-VIOLATING COUPLING OF THE Z0 TO THE
s-QUARK∗
The SLD Collaboration∗∗
Stanford Linear Accelerator Center
Stanford University, Stanford, CA 94309
Abstract
We have made the first direct measurement of the parity-violating coupling of the Z 0
boson to the strange quark, As , using ∼550,000 e+ e− → Z 0 →hadrons events produced
with a polarized electron beam and recorded by the SLD experiment. Z 0 → ss̄ events
were tagged by the absence of B or D hadrons and the presence in each hemisphere of a
high-momentum K ± or Ks0 . From the polar angle distributions of the strangeness-signed
thrust axis, we obtained As = 0.895±0.066(stat.)±0.062(syst.). The analyzing power and
uū+dd̄ background were constrained using the data.
Submitted to Physical Review Letters.
∗
Work supported in part by Department of Energy contract DE-AC03-76SF00515.
The extent of parity violation in the electroweak coupling of the Z 0 boson to an
elementary fermion f can be specified by the parameter Af = 2vf af /(vf2 +a2f ), where vf
(af ) is the vector (axial-vector) Zf f¯ coupling. In the Standard Model (SM), universal
couplings are expected for the leptons (Ae = Aµ = Aτ ), the down-type quarks (Ad =
As = Ab ) and the up-type quarks (Au = Ac = At ). Precise measurements of the Af
allow stringent tests of the SM and sensitivity through radiative corrections to e.g.: the
top quark and Higgs boson masses (Ae,µ,τ ); new physics that affects primarily the righthanded couplings (Ad,s,b ); and new physics that couples more strongly to heavier quarks
(deviations from universality).
All except At can be measured in e+ e− annihilations at the Z 0 resonance via forwardbackward production asymmetries in θf , the polar angle of the outgoing f with respect
to the incoming e− beam. At the SLC, the e− beam has longitudinal polarization Pe ,
the e+ beam is unpolarized, and the Born-level differential cross-section for the process
e+ e− → Z 0→ f f¯ is:
dσf /dx ∝ (1−Ae Pe )(1+x2) + 2Af (Ae −Pe )x,
(1)
where the last term is antisymmetric in x = cos θf . Using both left- (Pe < 0) and rightpolarized (Pe > 0) beams of magnitude |Pe |, one can measure both the initial- (Ae ) and
final-state (Af ) couplings directly [1, 2]; for Pe = 0 one can measure only their product,
or AfF B ≡ 3Ae Af /4.
The most precisely measured coupling is Ae , with a relative error of 1.3% [1, 3], and
lepton universality is verified at the 8% level [3]. In the quark sector, several measurements
of Ab and Ac that use properties of the leading B and D hadrons can be combined to
yield precisions of 2.0% and 4.4%, respectively [3]. However there are few measurements
of Au , Ad or As [4, 5] because the leading particles in u, d and s jets are more difficult
to identify experimentally; they have relatively low energy, are not unique to events of a
particular flavor, and nonleading particles of the same species are produced in hadronic
jets of all flavors. Furthermore, these aspects of jet fragmentation are not well measured,
and previous indirect measurements either relied on imprecise constraints from their data
(OPAL: AuF B = 0.040±0.073; Ads
F B = 0.068±0.037 [4]) or are model-dependent (DELPHI:
AsF B = 0.101±0.012 [5]).
In this Letter we present the first direct measurement of As . We used high-momentum
±
K and Ks0 to tag Z 0→ ss̄ events, and the K ± charge to separate s jets from s̄ jets. The
heavy flavor (cc̄ + bb̄) event background was suppressed by identifying B and D decay
vertices. The uū + dd¯ background was suppressed and the s-s̄ separation enhanced by
requiring an s/s̄-tag in each event hemisphere, reducing any model dependence. The
remaining uū+dd¯ background and the s-s̄ separation were constrained using related observables in the data.
We used the sample of approximately 550,000 hadronic Z 0 decays recorded by the
SLD [6] experiment at the SLAC Linear Collider, with h|Pe |i = 0.735±0.005 [1], from 1993–
1998. Charged tracks were measured in the Central Drift Chamber (CDC) [7] and the
original (upgraded) Vertex Detector (VXD) [8] in 26.5% (73.5%) of the data; the resolution
2
on the impact parameter d in the plane perpendicular to the beam direction, including
the uncertainty on the interaction point, was σd =11⊕70/(p sin3/2 θ) µm (8⊕29/(p sin3/2 θ)
µm), where p is the track momentum in GeV/c and θ its polar angle with respect to the
beamline. Tracks were identified as π ± , K ± or p/p̄ in the Cherenkov Ring Imaging
Detector (CRID) [9], which allowed the identification with high efficiency and purity of
π ± with 0.3 < p < 35 GeV/c, K ± with 0.75 < p < 6 GeV/c or 9 < p < 35 GeV/c, and
p/p̄ with 0.75 < p < 6 GeV/c or 10 < p < 46 GeV/c [10]. The event thrust axis [11] was
calculated using energy clusters measured in the Liquid Argon Calorimeter [12].
After selecting hadronic Z 0 decays [13], we removed cc̄ and bb̄ events by requiring
no more than one well-measured [13] track with d/σd > 2.5 in the event. The efficiency
for selecting light-flavor events with | cos θthrust | <0.71 and the VXD, CDC and CRID
operational was estimated to be over 95%; the selected sample comprised 205,708 events,
with an estimated contribution of 14.2% (3.4%) from cc̄ (bb̄) events. Such performance
parameters were estimated from a detailed Monte Carlo (MC) simulation [13, 14] of the
SLD based on the JETSET 7.4 [15] event generator, tuned to reproduce many measured
properties of hadronic Z 0 decays, including the momentum-dependent production of K ± ,
K 0 , K ∗ and φ mesons.
Each selected event was divided into two hemispheres by the plane perpendicular to
the thrust axis, and in each hemisphere we searched for high-momentum strange particles
K ± , Ks0 and Λ0 /Λ̄0 . Candidate K ± tracks were required to have p > 9 GeV/c, d < 1 mm,
to extrapolate through an active region of the CRID gaseous radiator system, and to have
a log-likelihood [10] for the K ± hypothesis LK that exceeded both Lπ and Lp by at least
3 units. For p > 9 GeV/c, the estimated K ± selection efficiency (purity) was 48% (91.5%).
Candidate Ks0 → π + π − and Λ0 /Λ̄0 →pπ − /p̄π + decays were reconstructed as described
in [10, 16] from tracks not identified as K ± . We required p > 5 GeV/c and a reconstructed
invariant mass mππ or mpπ within two standard deviations of the Ks0 or Λ0 mass. If CRID
information was available for the p/p̄ track in a Λ0 /Λ̄0 candidate, we required Lp > Lπ ;
otherwise we required that the Λ0 /Λ̄0 not be a Ks0 candidate and that the flight distance
exceed 10 times its uncertainty. The estimated Λ0 /Λ̄0 reconstruction efficiency (purity)
was 12% (90.7%). These Λ0 /Λ̄0 were removed from the Ks0 sample, for an estimated Ks0
efficiency (purity) of 24% (90.7%).
We considered only the selected strange particle with the highest momentum in each
hemisphere (5.5% of those tagged contained more than one), and tagged the event as ss̄
if one hemisphere contained a K ± and the other contained either an oppositely charged
K ± or a Ks0 . The Λ0 /Λ̄0 tags provided a useful veto in multiply tagged hemispheres and
important checks of the simulation; however their inclusion did not improve the total error
on As . The thrust axis, signed so as to point into the hemisphere containing (opposite)
the K − (K + ), was used as an estimate of the initial s-quark direction. Table 1 shows
the number of events tagged in each mode, along with the predictions of the simulation,
which are consistent. Also shown are the simulated ss̄ event purities and analyzing powers
as ≡ (Nr −Nw )/(Nr + Nw ), where Nr (Nw ) is the number of events in which the signed
thrust axis pointed into the true s (s̄) hemisphere.
3
Mode
K +K −
K ± Ks0
K + Λ0 , K − Λ̄0
Λ0 Λ̄0
0 0
Λ Ks , Λ̄0 Ks0
# Events
in Data
1290
1580
219
17
193
MC
Prediction
1312
1617
213
14
194
ss̄
Purity
0.73
0.60
0.66
0.57
0.50
Analyzing
Power
0.95
0.70
0.89
0.70
0.32
Table 1: Summary of the selected event sample for the two tagging modes and the three
cross-check modes.
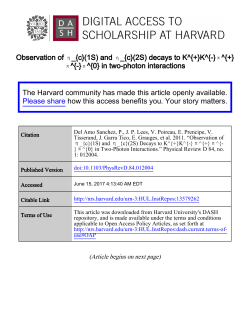
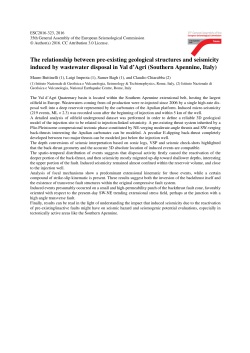
Figure 1 shows the distributions of the measured s-quark polar angle θs for the K + K −
and K ± Ks0 modes. In each case, production asymmetries of opposite sign and different
magnitude for left- and right-polarized e− beams are visible. The content of the largest
| cos θs | bins is reduced by the detector acceptance. The estimated backgrounds (discussed
below) are indicated: those from cc̄+bb̄ events exhibit asymmetries of the same sign and
similar magnitude to those of the signal, so the measured As is largely insensitive to them;
those from uū+dd¯ events exhibit asymmetries of opposite sign, and As is more sensitive
to the associated uncertainties.
A simultaneous maximum likelihood fit to these four distributions was performed using
the function:
L=
NY
data
X
k=1 q=udscb
Nq {(1−Ae Pe )(1+x2k ) + 2(Ae −Pe )(1+δ)aq Aq xk }.
(2)
Here, the number of tagged q q̄ events Nq = Nevents Rq ǫq , Rq = Γ(Z 0→ q q̄)/Γ(Z 0→hadrons),
ǫq is the tagging efficiency, aq is the analyzing power for tagging the q direction, and the
correction for hard gluon radiation δ = −0.013 was derived [17] as in [2]. The values of
the ǫq and aq depend on the tagging mode. World average values [3] of Ae , Ac , Ab , Rc
and Rb were used, along with SM values of Au , Ad , Ru , Rd and Rs . Simulated values of
ǫc , ǫb , ac and ab were used, as they depend primarily on measured quantities with well
defined uncertainties.
For the light flavors, the relevant parameter values were derived where possible from
the data. The number of events Nu+Nd+Ns was determined by subtracting the simulated
Nc and Nb from the total observed. The values of as and the ratio (Nu + Nd )/Ns were
constrained (see below) using the data; since the simulation was consistent with the data,
the simulated values of as were used and the simulated ǫu , ǫd and ǫs were scaled by a
common factor to give the measured Nu+Nd+Ns . The average aud ≡ (Nu au+Nd ad )/(Nu+
Nd ) can also be constrained from the data; however our constraint is less precise than
the range −as < au , ad < 0, obtained by noting that a u (d) jet can produce a leading
K + (K ∗0 → K + π − ), giving au (ad )<0, but with an associated K − or K̄ 0 , and a K − can
be selected with reduced probability, giving |au |(|ad |)< |as |. We scaled the simulated
4
Entries
120
80
40
0
6-2000
8535A1
y
yyy
yyy
yyyyyyyyy
yyy
yyyyyyyyy
yyy
K+K– Mode
(a) Pe < 0
SLD
–0.8
0
K±K 0s Mode
(c) Pe < 0
(b) Pe > 0
Fit Result
–
–+dd
uu
–
–+bb
cc
0.8 –0.8
0
0.8 –0.8
cosθs
0
(d) Pe > 0
0.8 –0.8
0
0.8
120
80
40
0
Figure 1: Measured s-quark polar angle distributions (dots) for selected events in the a,b)
K + K − and c,d) K ± Ks0 modes, produced with a,c) left- and b,d) right-polarized electron
beams. The histograms represent the result of a simultaneous fit to the four distributions,
and the upper (lower) hatched areas indicate the estimated uū+dd̄ (cc̄+bb̄) backgrounds.
au and ad by a common factor such that aud = −as /2 for each mode. The fit yielded
As = 0.895±0.066 (stat.). Histograms corresponding to this value are shown in fig. 1 and
are consistent with the data; the binned χ2 is 42 for 48 bins.
We considered several sources of systematic uncertainty, summarized in table 2. The
values of Rc , Rb , Ac and Ab were varied by the uncertainties on their world averages [3].
A large number of quantities in the simulation of heavy flavor events and detector performance were varied as in [14] with negligible effect on the measured value of As . The
yield and analyzing power of true K ± from D (B) decays have been derived from SLD
data in the context of a measurement [18] of Ac (Ab ), and our simulation reproduces them
within the measurement errors. We applied corresponding relative variations of ±9% to
ǫc , ±3.3% to ǫb , ±5% (15%) to ac and ±3.6% (4.4%) to ab for the K + K − (K ± Ks0 ) mode.
The sum in quadrature of the uncertainties due to heavy flavor background is listed in
Table 2; the largest contribution is from δac .
The key to this measurement is the understanding of the light-flavor parameters, for
which there are few experimental constraints, and these gave rise to the dominant systematic uncertainties [16]. In order to minimize model dependence, we used our data
to constrain the largest uncertainties in these parameters within the context of our simulation, which reproduces existing measurements of relevant quantities such as leading
particle production and strange-antistrange correlations [16].
To constrain the analyzing power as , we note that to mistag an s jet as an s̄ jet
5
we must either identify a true K + or misidentify a π + or p as a K + . A true highmomentum K + in an s jet must be produced in association with an antistrange particle,
yielding a jet with three high-momentum particles of nonzero strangeness. In our data we
found 61 hemispheres containing three selected K ± and/or Ks0 ; the MC prediction of 67 is
consistent. We quantified this as a constraint on as by subtracting the simulated (c+c̄+b+b̄)
contribution of 9.3, scaling by the simulated ratio (s+s̄)/(u+ ū+d+ d̄+s+s̄) = 0.74, and
comparing with the MC prediction for (s+ s̄). Propagating the data and MC statistical
errors yielded an 18.5% relative constraint on the wrong-sign fraction, ws = (1 −as )/2,
in s/s̄ hemispheres. This constraint is not entirely model-independent but any further
uncertainties are small compared with 18.5%. Assuming equal production of charged and
neutral kaons, this procedure delivers a calibration of ws for both tagging modes, which we
varied simultaneously by ±18.5% relative. To account for misidentified particles we varied
the production of >9 GeV/c p and π + in s jets by ±100%, and varied the misidentification
probability by its measured relative uncertainty of ±25% [10]. The sum in quadrature of
these three effects is shown in table 2 and is dominated by the 3-kaon calibration.
The relative uū + dd̄ background Bud = (Nu + Nd )/Ns was constrained in a similar
manner, by exploiting the fact that an even number of particles with nonzero strangeness
must be produced in a u or d jet. The three quantities, the number N1 = 1262 of hemispheres in the data containing an identified K + K − pair, N2 = 983 hemispheres containing
a K ± Ks0 pair, and N3 = 503 events with an identified K ± of the same charge in both
hemispheres, constrain Bud in complementary ways: N1 and N2 are primarily sensitive
to K K̄ production in u/d jets; (N1 −N2 ) to φ production in s jets; and N3 to these and
also the production and misidentification of π ± and p/p̄. Furthermore, all are sensitive to
deviations from the assumed values of Ru , Rd and Rs . The MC predictions of N1 = 1218,
N2 = 1002 and N3 = 559 are consistent, and relative constraints on Bud of 4.6%, 5.1%
and 8.1%, respectively, were derived. Since N3 constrains the sum of all contributions, we
varied Bud by ±8.1%.
These quantities are also sensitive to au and ad , however our limited event sample
did not allow us to obtain a useful constraint. We therefore took −as < au√
, ad < 0 as
hard limits and scaled au and ad simultaneously such that aud = −as /2 ±as / 12. This
yielded the dominant systematic error on As and is a quantity that must be understood
experimentally before a more precise measurement can be made. Since the product Aq aq
appears in Eqn. 2, this is equivalent to varying Au and Ad down to half of their SM
values and up to well over unity; we considered no additional variation of Au or Ad . The
uncertainties listed in table 2 were added in quadrature to yield a total relative systematic
error of ±0.069.
Several systematic checks were also performed. Ad hoc corrections [16] to the simulation of the kaon momentum distributions and identification efficiencies, and the charged
track reconstruction efficiency and impact parameter resolution were removed and the
analysis repeated; changes in the measured value of As were much smaller than the systematic error. We fitted each tagging mode separately, including those involving Λ0 tags,
with consistent results. We repeated the analysis using all K ± , and all Λ0 /Λ̄0 , hemi6
Source
Heavy flavor background
Correction for gluon radiation
h|Pe |i
MC statistics
as
K +K −
K ± Ks0
(Nu + Nd )/Ns
K +K −
(incl. (Ru + Rd )/Rs ) K ± Ks0
au , ad
Au , Ad
Total
Systematic
variation
See text
−0.013±0.006
0.735±0.005
0.949±0.012
0.701±0.060
0.190±0.015
0.316±0.026
√
−as /2±as / 12
–
δAs /As
0.014
0.006
0.006
0.014
0.032
0.021
0.054
0.069
Table 2: Summary of the systematic uncertainties.
spheres with no tag required in the opposite hemisphere; results were consistent. This
K ± analysis is similar to that in [5]; it has a relative statistical precision of 0.03, but of
0.18 systematic.
In conclusion, we have made the first direct measurement of the parity-violating coupling of the Z 0 boson to the strange quark,
As = 0.895±0.066(stat.) ± 0.062(syst.),
using high-momentum identified K ± and Ks0 to tag Z 0→ ss̄ decays and determine the squark direction. Our high K ± identification efficiency allowed the use of a relatively highpurity, double-tagged event sample, and the extraction from the data of constraints on the
analyzing power of the method and the uū+dd¯ background, using events with same-charge
double tags and jets with two or three identified kaons. This result is consistent with the
Standard Model expectation, As = 0.935, and with less precise, previous measurements
of AsF B [4, 5]. It is also consistent with a recent world average b-quark asymmetry,
Ab = 0.881±0.018 [3], providing a 10% test of down-type quark universality.
We thank the personnel of the SLAC accelerator department and the technical staffs
of our collaborating institutions for their outstanding efforts on our behalf. This work was
supported by the U.S. Department of Energy, the UK Particle Physics and Astronomy
Research Council (Brunel, Oxford and RAL); the Istituto Nazionale di Fisica Nucleare
of Italy (Bologna, Ferrara, Frascati, Pisa, Padova, Perugia); the Japan-US Cooperative
Research Project on High Energy Physics (Nagoya, Tohoku); and the Korea Science and
Engineering Foundation (Soongsil).
7
References
[1] SLD Collab., K. Abe et al., SLAC-PUB-8401, to appear Physical Review Letters
(June 26, 2000).
[2] SLD Collab., K. Abe et al., Phys. Rev. Lett. 83 (1999) 3384.
[3] The LEP Collabs., the LEP Electroweak Working Group, and the SLD Heavy Flavor
and Electroweak Groups, CERN-EP/99-015 (1999).
[4] OPAL Collab., K. Ackerstaff et al., Z. Phys. C76 (1997) 387.
[5] DELPHI Collab., P. Abreu et al., Z. Phys. C67 (1995) 1; CERN-EP/99-134, submitted to Eur. Phys. J. C.
[6] SLD Design Report, SLAC-Report 273 (1984).
[7] M. D. Hildreth et al., Nucl. Instr. Meth. A367 (1995) 111.
[8] C.J.S. Damerell et al., Nucl. Instr. Meth. A288 (1990) 236; Nucl. Instr. Meth. A400
(1997) 287.
[9] K. Abe et al., Nucl. Inst. Meth. A343 (1994) 74.
[10] SLD Collab., K. Abe et al., Phys. Rev. D59 (1999) 52001.
[11] S. Brandt et al., Phys. Lett. 12 (1964) 57.
E. Farhi, Phys. Rev. Lett. 39 (1977) 1587.
[12] D. Axen et al., Nucl. Inst. Meth. A328 (1993) 472.
[13] SLD Collab., K. Abe et al., Phys. Rev. D53 (1996) 1023.
[14] SLD Collab., K. Abe et al., Phys. Rev. Lett. 80 (1998) 660.
[15] T. Sjöstrand, Comput. Phys. Commun. 82 (1994) 74.
[16] H. Stängle, Ph.D. Thesis, Colorado State University (1999), SLAC-R-549.
[17] S. Narita, Ph.D. Thesis, Tohoku University (1998), SLAC-R-520.
[18] SLD Collab., K. Abe et al., SLAC-PUB-8199, SLAC-PUB-8200, unpublished.
8
∗∗
List of Authors
Koya Abe,(24) Kenji Abe,(15) T. Abe,(21) I. Adam,(21) H. Akimoto,(21) D. Aston,(21)
K.G. Baird,(11) C. Baltay,(30) H.R. Band,(29) T.L. Barklow,(21) J.M. Bauer,(12)
G. Bellodi,(17) R. Berger,(21) G. Blaylock,(11) J.R. Bogart,(21) G.R. Bower,(21)
J.E. Brau,(16) M. Breidenbach,(21) W.M. Bugg,(23) D. Burke,(21) T.H. Burnett,(28)
P.N. Burrows,(17) A. Calcaterra,(8) R. Cassell,(21) A. Chou,(21) H.O. Cohn,(23)
J.A. Coller,(4) M.R. Convery,(21) V. Cook,(28) R.F. Cowan,(13) G. Crawford,(21)
C.J.S. Damerell,(19) M. Daoudi,(21) S. Dasu,(29) N. de Groot,(2) R. de Sangro,(8)
D.N. Dong,(13) M. Doser,(21) R. Dubois, I. Erofeeva,(14) V. Eschenburg,(12) E. Etzion,(29)
S. Fahey,(5) D. Falciai,(8) J.P. Fernandez,(26) K. Flood,(11) R. Frey,(16) E.L. Hart,(23)
K. Hasuko,(24) S.S. Hertzbach,(11) M.E. Huffer,(21) X. Huynh,(21) M. Iwasaki,(16)
D.J. Jackson,(19) P. Jacques,(20) J.A. Jaros,(21) Z.Y. Jiang,(21) A.S. Johnson,(21)
J.R. Johnson,(29) R. Kajikawa,(15) M. Kalelkar,(20) H.J. Kang,(20) R.R. Kofler,(11)
R.S. Kroeger,(12) M. Langston,(16) D.W.G. Leith,(21) V. Lia,(13) C. Lin,(11)
G. Mancinelli,(20) S. Manly,(30) G. Mantovani,(18) T.W. Markiewicz,(21)
T. Maruyama,(21) A.K. McKemey,(3) R. Messner,(21) K.C. Moffeit,(21) T.B. Moore,(30)
M. Morii,(21) D. Muller,(21) V. Murzin,(14) S. Narita,(24) U. Nauenberg,(5) H. Neal,(30)
G. Nesom,(17) N. Oishi,(15) D. Onoprienko,(23) L.S. Osborne,(13) R.S. Panvini,(27)
C.H. Park,(22) I. Peruzzi,(8) M. Piccolo,(8) L. Piemontese,(7) R.J. Plano,(20)
R. Prepost,(29) C.Y. Prescott,(21) B.N. Ratcliff,(21) J. Reidy,(12) P.L. Reinertsen,(26)
L.S. Rochester,(21) P.C. Rowson,(21) J.J. Russell,(21) O.H. Saxton,(21) T. Schalk,(26)
B.A. Schumm,(26) J. Schwiening,(21) V.V. Serbo,(21) G. Shapiro,(10) N.B. Sinev,(16)
J.A. Snyder,(30) H. Staengle,(6) A. Stahl,(21) P. Stamer,(20) H. Steiner,(10) D. Su,(21)
F. Suekane,(24) A. Sugiyama,(15) A. Suzuki,(15) M. Swartz,(9) F.E. Taylor,(13)
J. Thom,(21) E. Torrence,(13) T. Usher,(21) J. Va’vra,(21) R. Verdier,(13) D.L. Wagner,(5)
A.P. Waite,(21) S. Walston,(16) A.W. Weidemann,(23) E.R. Weiss,(28) J.S. Whitaker,(4)
S.H. Williams,(21) S. Willocq,(11) R.J. Wilson,(6) W.J. Wisniewski,(21) J.L. Wittlin,(11)
M. Woods,(21) T.R. Wright,(29) R.K. Yamamoto,(13) J. Yashima,(24) S.J. Yellin,(25)
C.C. Young,(21) H. Yuta.(1)
(The SLD Collaboration)
(1)
Aomori University, Aomori, 030 Japan,
University of Bristol, Bristol, United Kingdom,
(3)
Brunel University, Uxbridge, Middlesex, UB8 3PH United Kingdom,
(4)
Boston University, Boston, Massachusetts 02215,
(5)
University of Colorado, Boulder, Colorado 80309,
(6)
Colorado State University, Ft. Collins, Colorado 80523,
(7)
INFN Sezione di Ferrara and Universita di Ferrara, I-44100 Ferrara, Italy,
(8)
INFN Laboratori Nazionali di Frascati, I-00044 Frascati, Italy,
(9)
Johns Hopkins University, Baltimore, Maryland 21218-2686,
(10)
Lawrence Berkeley Laboratory, University of California, Berkeley, California 94720,
(11)
University of Massachusetts, Amherst, Massachusetts 01003,
(2)
9
(12)
University of Mississippi, University, Mississippi 38677,
Massachusetts Institute of Technology, Cambridge, Massachusetts 02139,
(14)
Institute of Nuclear Physics, Moscow State University, 119899 Moscow, Russia,
(15)
Nagoya University, Chikusa-ku, Nagoya, 464 Japan,
(16)
University of Oregon, Eugene, Oregon 97403,
(17)
Oxford University, Oxford, OX1 3RH, United Kingdom,
(18)
INFN Sezione di Perugia and Universita di Perugia, I-06100 Perugia, Italy,
(19)
Rutherford Appleton Laboratory, Chilton, Didcot, Oxon OX11 0QX United Kingdom,
(20)
Rutgers University, Piscataway, New Jersey 08855,
(21)
Stanford Linear Accelerator Center, Stanford University, Stanford, California 94309,
(22)
Soongsil University, Seoul, Korea 156-743,
(23)
University of Tennessee, Knoxville, Tennessee 37996,
(24)
Tohoku University, Sendai, 980 Japan,
(25)
University of California at Santa Barbara, Santa Barbara, California 93106,
(26)
University of California at Santa Cruz, Santa Cruz, California 95064,
(27)
Vanderbilt University, Nashville,Tennessee 37235,
(28)
University of Washington, Seattle, Washington 98105,
(29)
University of Wisconsin, Madison,Wisconsin 53706,
(30)
Yale University, New Haven, Connecticut 06511.
(13)
10
© Copyright 2026 Paperzz