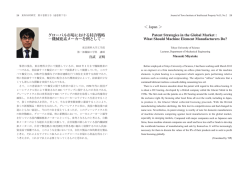
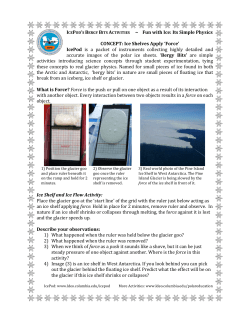
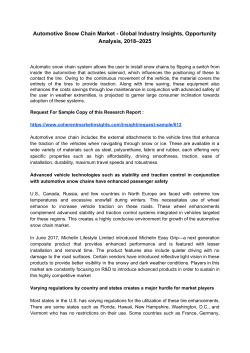
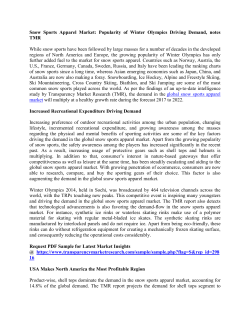
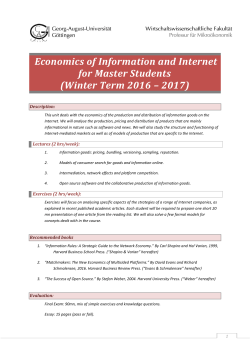
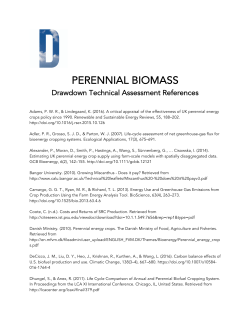
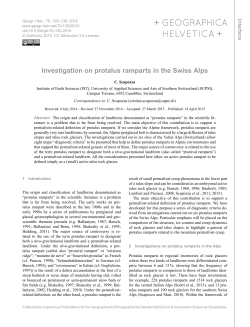
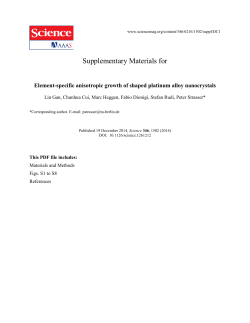
Geogr. Fis. Dinam. Quat.
38 (2015), 143-154, 7 figg., 1 tab.
DOI 10.4461/GFDQ.2015.38.13
Stephan P. Galos (*), Christoph Klug (**), Rainer Prinz (***), Lorenzo Rieg (**),
Roberto Dinale (****), Rudi Sailer (**) & Georg Kaser (*)
Recent glacier changes and related
contribution potential to river discharge in the
Vinschgau / Val Venosta, Italian Alps
Abstract: Galos S.P., Klug Ch., Prinz R., Rieg L., Dinale R., Sailer R.
& Kaser G., Recent glacier changes and related contribution potential to river
discharge in the Vinschau/Val Venosta, Italian Alps. (ITISSN, 0391-9838).
Recent glacier changes in the Vinschgau / Val Venosta region of the
Autonomous Province of Bozen / Bolzano, Northern Italy, were quantified
using high resolution multi-temporal airborne laser scanning data (fall 2005
to fall 2013). The analysis reveals a marked reduction in glacier area (-14.6
%), mean surface elevation (-7.1 m) and mass (-388 ± 26 % 109 kg) during
the study period. Observed values of relative area change and mean changes
in surface elevation are similar in the Ötztal Alps and the Texel Group in
the North and the Ortler-Cevedale Group in the South of the study region.
The mass balance record of Langenferner / Vedretta Lunga, a well
measured glacier within the study region, was analyzed in terms of its representativeness for glacier changes in the wider region. The inter-annual
variability of the mass balance signal was investigated by comparing the results to those of other monitored glaciers in the Eastern Alps and the magnitude of the geodetically derived mass change of the glacier was compared
to the mass change of all other 91 glaciers within the study region. Results
show that Langenferner / Vedretta Lunga over all satisfactorily represents
————————
(*) Institut für Atmosphären- und Kryosphärenwissenschaften, Universität Innsbruck, Innrain 52, 6020 Innsbruck, Austria
(**) Institut für Geographie, Universität Innsbruck, Innrain 52, 6020
Innsbruck, Austria
(***) Geographie und Raumforschung, Universität Graz, Heinrichstraße
36, 8010 Graz, Austria
(****) Hydrographisches Amt der Autonomen Provinz Bozen, Drususallee 116, 39100 Bozen, Italy/Ufficio idrografico della Provincia Autonoma di
Bolzano – Alto Adige, viale Druso 116 - 39100 Bolzano, Italy
Corresponding Author: Stephan P. Galos, e-mail: stephan.galos@uibk.
ac.at
The study presented in this paper is part of the Project “A physically
based regional mass balance approach for the glaciers of Vinschgau - glacier
contribution to water availability,” funded by the Autonomous Province of
Bozen / Bolzano. We thank all persons involved in the field work at LGF
and other glaciers of the region. We are grateful to Dr. Lindsey Nicholson
who proof-read the manuscript. The comments of two anonymous reviewers
substantially improved the quality of the paper.
the temporal variability of regional glacier mass changes, but values for the
mass balance in certain years request further analysis. Furthermore, the
glacier displays one of the most negative values of geodetic mass balance
within the study region.
Finally, a first order quantification of glacier melt contribution to total
river discharge in the study area is provided which reveals that the annual
contribution of excess melt due to glacier retreat amounts to 4.6 % of total
river discharge, while values for single years can reach 9 %. During the
months July to September, the contribution of glacier melt to total runoff
can be in the order of 25 % in single years.
Key Words: Glacier mass balance, Airborne laser scanning, Geodetic
mass balance, Glacier runoff, Vinschgau – Val Venosta, Italian Alps.
Riassunto: Galos S.P., Klug Ch., Prinz L., Rieg L., Dinale R., Sailer
R. & Kaser G., Cambiamenti glaciali recenti e relativi potenziali contributi
alle portate fluviali nella Vingschgau/ Val Venosta, Alpi Italiane. (IT ISSN
0391-9838).
I recenti cambiamenti glaciali nella Vinschgau/Val Venosta nel territorio della Provincia Autonoma di Bolzano nell’Italia Settentrionale sono
stati quantificati con i dati acquisiti mediante l’uso di un Laser Scanning aereotrasportato ad alta risoluzione dall’autunno 2005 all’autunno 2013. Le
analisi hanno rivelato una marcata riduzione delle masse glaciali (-14,6 %),
della media dell’altezza della superficie (-7.1 m) e della massa (-388 ± 26
% 109 kg) nel periodo studiato. I valori osservati delle variazioni dell’area
e delle variazioni medie dell’altezza della superficie sono simili nelle Alpi
dell’Otztal e nel Gruppo di Tessa a nord e nel Gruppo Ortles-Cevedale a
sud dell’area studiata.
Il bilancio di massa del Ghiacciaio del Langenferner / Vedretta Lunga, un ghiacciaio ben misurato nella regione di studio, è stato analizzato
in termini di rappresentatività dei cambiamenti glaciali dell’area più vasta.
La variabilità interannuale dei bilanci di massa è stata analizzata mettendo a confronto i risultati con quelli di altri ghiacciai monitorati nelle Alpi
Orientali. La grandezza dei cambiamenti di massa glaciale ottenuti per via
geodetica sono stati comparati con quelli degli altri 91 ghiacciai presenti
nella regione. I risultati mostrano che complessivamente il Ghiacciaio del
Langenferner / Vedretta Lunga rappresenta in maniera soddisfacente la
variabilità temporale dei cambiamenti di massa glaciali nella regione, anche
se i cambiamenti di alcuni anni vanno ulteriormente analizzati. Di più, il
ghiacciaio mostra uno dei valori più negativi dei bilanci di massa geodetici
dell’intera regione studiata.
Infine viene fornito un primo ordine di grandezza del contributo dello
scarico glaciale alle portate dei corsi d’acqua delle regione. Il risultato è
che il contributo dell’eccesso di scarico dovuto al ritiro glaciale ammonta
143
al 4.6 % della portata dei corsi d’acqua mentre i valori di alcuni anni può
raggiungere il 9%. Durante i mesi da Luglio a Settembre il contributo dello
scarico glaciale può in alcuni anni raggiungere il 25%.
Termini Chiave: Bilancio di massa glaciale, Laser Scanning, Bilancio di
massa geodetico, Bilancio idrico,Vinschau/ Val Venosta, Alpi.
INTRODUCTION
During recent decades retreating mountain glaciers
around the world have received much attention as they are
among the most striking signs of ongoing global climate
change (e.g. Vaughan & alii, 2013; Marzeion & alii, 2014;
Zemp & alii, 2015) and they represent the second largest contribution to current sea level rise after the thermal
expansion of the oceans (Church & alii, 2013). Mountain
glaciers can also constitute an important component of the
local or regional seasonal hydrological cycle and in certain
regions of the world they provide a substantial fraction of
the available water resources to the local population (e.g.
Immerzeel & alii, 2010; Kaser & alii, 2010). This also holds
for some regions in the European Alps (e.g. Schaefli & alii,
2007; Lambrecht & Mayer, 2009; Huss, 2011) where the
rate of glacier retreat during recent decades was especially
strong (e.g. Paul & alii, 2004; Lambrecht & Kuhn, 2007;
Fischer & alii, 2014). One of these regions is in the focus of
the current study: Vinschgau / Valle Venosta, a dry inner alpine catchment in the central Eastern Alps with a relatively
high degree of glaciation.
The rapid glacier changes within the Eastern Alps during recent decades were addressed by a range of studies (e.g.
Carturan & alii, 2013a; Scotti & alii, 2014), which resulted
in a number of national or regional glacier inventories or
similar data sets (e.g. Abermann & alii, 2009; Knoll & Kerschner, 2009; Fischer & alii, 2014). However, these studies do
not address regional scale glacier change in the Vinschgau /
Valle Venosta during the recent decade, nor do they provide
a quantification of the consequent contribution of observed
glacier melt to the water availability in this region.
The relevance of glacier melt runoff for the (sub-) seasonal water availability in the Vinschgau / Valle Venosta is
under investigation within a scientific project at the University of Innsbruck in cooperation with the Hydrological Office Bozen / Bolzano. As part of this project and as a first
step towards more detailed future analyses, the goals of the
current study are (i) a sound quantification of recent glacier changes within the study region during the period 2005
to 2013 using high resolution airborne laser-scanning data,
(ii) the evaluation of the regional representativeness of Langenferner / Vedretta Lunga (LGF), a well measured glacier
within the study region, and (iii) a first order estimate on the
contribution of glacier melt to total river discharge.
STUDY SITE
The Vinschgau / Val Venosta
The Vinschgau / Val Venosta (fig. 1) is situated in the
Italian part of the central Eastern Alps and covers an
144
area of about 1500 km². Four percent of the catchment
is covered by glaciers. The valley is shielded from synoptic precipitation by the surrounding high mountain ranges of the Ötztal Alps and the Texel Group in the North,
the Sesvenna Group in the Northwest, the Bernina and
Livigno Alps in the Southwest and the Ortler-Cevedale
Group in the South. Consequently, with annual precipitation amounts of ~ 500 mm or less at the bottom of the
main valley, Vinschgau / Val Venosta is one of the driest
areas within the European Alps (e.g. Frei & Schär, 1998).
About one third of the precipitation in the study region
falls during summer (June, July, August), often related to
convective events leading to an increased frequency of precipitation compared to the rest of the year (e.g. Fliri, 1976;
Adler & alii, 2015). Winter precipitation, which forms the
largest part of glacial accumulation, is mainly associated
with southwesterly air flow, triggered by cyclonic activity
over the Mediterranean Sea (e.g. Auer & alii, 2007; Frei &
Schär, 1998). Only a minor part of the annual precipitation
amount is related to fronts from northern directions. Due
to the dry climate, sunshine duration and air temperature
are higher than in other Alpine regions (e.g. Adler & alii,
2015). The mean zero-degree level in the study region derived from high altitude weather stations (2004 - 2013) is
around 2500 m a.s.l.
The main water resources of the valley are the Etsch /
Adige River and its tributaries which during the ablation
period are fed by the melt runoff of about 100 glaciers and
glacierets. The water of these rivers is partly used for fruit
cultivation in large orchards which, in addition to tourism, is the dominant economic activity in the region. As
large amounts of water are used for irrigation during the
growing season, the contribution of glacier melt to the total river discharge can be of considerable importance for
the local water availability and economic activity during
dry and hot periods in summer (e.g. Schaefli & alii, 2007;
Lambrecht & Mayer, 2009).
Langenferner / Vedretta Lunga
Situated at the head of Martell / Martello Valley in the
Ortler-Cevedale Group, Autonomous Province of Bozen
/ Bolzano, Northern Italy, LGF (46.46°N|10.61°E) is a
small valley glacier where detailed glaciological measurements have been carried out since the hydrological year
2003/04. As other long term glacier monitoring programs
in the region (Careser since 1967 and Weißbrunnferner
/ Fontana Bianca since 1984) seem to be (i) threatened
by the massive glacier retreat during the recent decades
(e.g. Carturan & alii, 2013b) and/or (ii) are considered
to be of limited regional representativeness (Kaser & alii,
1996; Carturan & alii, 2013a), the LGF program was initiated in order to create a new long term monitoring site
allowing the temporal extension of glaciological measurements within this region into the upcoming decades. The
glacier is part of the large glaciated area surrounding the
Cevedale Massif, in addition to LGF consisting of Fürkele Ferner / Ved. della Forcola, Zufallferner / Ved. del
Cevedale, Vedretta de la Mare and Vedretta di Cedec.
Fig. 1 - Satellite-image of the study
region showing LGF in red and other observed glaciers in yellow. The
Ötztal Alps (OEA) and Texel Group
(TSG) are situated in the North,
the glaciers of the Ortler-Cevedale
Group (OCG) in the South of the
study region. The political outline
of Vinschgau / Valle Venosta is indicated by the red line while the
area shown in Figure 3 is given by
the green rectangle and the location
of the runoff gauge in Töll / Tel is
shown by a green dot.
The highest point of LGF (fig. 2) is defined by an ice
divide which was derived by applying a watershed algorithm (e.g. Winsvold & alii, 2014) to the glacier surface
topography obtained by photogrammetry in 1996. Although the surface topography in this area changed during the observation period due to considerable glacier
recession, the impacts on the glacier flow direction are
negligible and the outlines of the uppermost glacier part
were consequently kept constant throughout the study
period. In 2013, the highest point of LGF was at 3370
m a.s.l., while the terminus elevation was 2711 m a.s.l.
The glacier area at that time amounted to 1.61 km² with
a median altitude of about 3143 m a.s.l. The upper part
of LGF is exposed to the North while the lower sections
face East. The glacier runoff feeds the Plima River, which
is a tributary to the Etsch / Adige. Ground penetrating
radar measurements carried out by the Institute of Atmospheric & Cryospheric Sciences / University of Innsbruck (ACINN) in spring 2010 gave an estimated glacier
volume of 0.08 km³ with a maximum thickness of about
130 m in the upper glacier part, between Rifugio Casati
and the Tre Cannoni (fig. 2).
Since its Little Ice Age maximum extent around the
year 1822 (Finsterwalder, 1890), the tongue of LGF has
retreated by more than 3 km and during recent decades
the glacier was among the fastest retreating glaciers in
Italy (e.g. Baroni & alii 2013; WGMS, 2012 and earlier
volumes). Figure 2 illustrates the glacier retreat in area
since 1996, which amounts to 0.57 km² (-26%).
DATA AND METHODS
Airborne laser scanning and orthophotos
Regional changes in glacier area and volume during the
period 2005 to 2013 were derived using multi-temporal
airborne laser scanning (ALS) data which has proven to
be a powerful tool to detect and quantify glacier changes
(e.g. Geist & alii, 2003; Abermann & alii, 2010; Joerg &
alii, 2012). In the current study the analyses are based on
data from two ALS campaigns. The first campaign (ALS1)
was commissioned by the Autonomous Province of Bozen
/ Bolzano in 2005 (Zanvettor & alii, 2006) and has a mean
point density of 1.06 points per m² within the study area.
The exact dates of the survey unfortunately were not documented, but a comparison with field data suggests an acquisition date around the mid of September 2005. The second data acquisition (ALS2) was performed on September
22nd and 23rd 2013, except for the glaciers in the Schnals
/ Senales tributary valley which were surveyed on September 5th. The mean point density of ALS2 is 2.65 points per
m². High resolution (1 m) digital elevation models (DEM)
calculated from the ALS point cloud data provided the basis for the subsequent analyses. The vertical error of the
DEMs was tested by investigating the DEM differences
in stable areas with low slope angles (<30°). The resulting mean squared vertical error amounts to 0.12 m with a
standard deviation of 0.21 m and a nearly Gaussian error
distribution. The error is increasing in steeper terrain, but
this is not really relevant for our study, since only a minor
145
Fig. 2 - Orthophoto of 2012 showing the mass and energy balance measurement network at LGF. Glacier outlines from years when orthophotos or ALS
data are available illustrate areal glacier retreat since 1996. (Orthophoto source: World Imagery - Esri, DigitalGlobe, GeoEye, Earthstar Geographics,
CNES/Airbus DS, USDA, USGS, AEX, Getmapping, Aerogrid, IGN, IGP, swisstopo and the GIS User Community)
fraction of the investigated glacier areas display slope angles steeper than 30°.
The glacier outlines for both dates were delineated from
high resolution hill shade DEMs following the approach of
Abermann & alii, 2010. Orthophotos from the years 2006
and 2012 offered additional information for the delineation
procedure. The Orthophotos for 2006 were provided by
the Autonomous Province of Bozen / Bolzano, while those
for 2012 are available through ESRI - ArcGis World Imagery. In the case of the heavily debris covered Suldenferner
we also benefit from in situ observations conducted in the
frame of another scientific project at the ACINN.
Changes in glacier surface elevation were derived based
on differencing the obtained DEMs for the glaciated areas
(e.g. Geist & Stötter, 2007; Abermann & alii, 2010). As all
investigated glaciers displayed a retreating behavior during
the study period, we used the larger glacier extents of 2005
as the reference area for the subsequent calculations. To calculate volume changes, the elevation differences for single
grid cells were multiplied by the cell size (1 x 1 m) and integrated over the area of the respective glacier. Mass changes
were then calculated by multiplying volume changes with
the density range of 850 ± 60 kg/m³ as proposed by Huss
(2013). This wide range of density was applied in order to
account for the uncertainties related to the regional scale
volume-to-mass conversion such as the unknown spatial extent of firn areas and crevasse zones.
146
Mass balance measurements at Langenferner /
Vedretta Lunga
Annual surface mass balance studies at LGF have been
carried out since the hydrological year 2003/04 by the
ACINN in collaboration with the Hydrological Office Bozen
/ Bolzano applying the direct glaciological method with the
fixed date convention (e.g. Østrem & Brugmann, 1991; Kaser & alii, 2003). In all observation years, measurements were
performed close to the end of the hydrological year (between
September 28th and October 8th) except for 2005 and 2007,
when unfavorable weather conditions led to a delay of a few
days. Whenever required, corrections for snow accumulation
were applied to obtain the fixed date mass balance. Corrections for ablation were not necessary as in that time of the
year considerable glacier melt commonly coincides with fair
weather conditions during which measurements were performed.
Winter balance measurements follow the floating date
system and have been conducted each year at the beginning
of May (in all years between May 2nd and 18th) performing
about 50 to 100 snow depth probings and normally four
density pits. During summer, ice ablation is measured at 29
(2013/14) ablation stakes which are read up to six times a
year depending on location and current conditions. Accumulation at the end of the hydrological year is measured in one
or two snow pits accompanied by a number of snow depth
probings depending on the amount and spatial extent of
present snow. Figure 2 gives an overview on the measurement
network at LGF.
The point values of specific mass balance have been manually extrapolated to the area of the whole glacier applying
the contour line method (e.g. Østrem & Brugmann, 1991)
using additional information such as repeated terrestrial and
airborne photos giving the spatial distribution of snow covered areas and the date of the onset of ice ablation. Further
analyses such as spatial integrations and intersections with altitudinal bands and the final calculations of the mean specific
mass balance were performed in ArcGIS. Respective data for
glacier outline and topography for the first observation years
originate from stereo-orthophotos of the year 1996. The glacier outline was updated in 2005 using data from a survey
with a differential geo-positioning system (DGPS). Since the
hydrological year 2007/08 analyses were based on the ALS
data of 2005 with another DGPS update for the glacier outline in 2010. During recent years, glacier topography and outlines were updated using ALS data of the years 2011 (since
2011/12) and 2013 (2013/14). The results of the mass balance
program at LGF (fig. 4) are reported to the World Glacier
Monitoring Service (WGMS).
Runoff data
Monthly values of river discharge for the Etsch / Adige
River measured at the village of Töll / Tel in the lowest part
of the study area were provided by the Hydrological Office
of Bozen / Bolzano. The discharge of 98.9 % of the observed
glacier area in the study region is captured by this station.
The remaining 1.1 % drain to the Ultental / Val d’Ultima and
enter the Etsch / Adige further downstream. In our analysis
the mass change of these glaciers is considered to compensate
for a few small glacierets within the catchment of Töll / Tel
which are not captured by our analysis due to the lack of data
in ALS2.
RESULTS AND DISCUSSION
Regional changes in glacier area, volume and mass
Changes in glacier area, thickness, volume and mass were
calculated for 92 individual glaciers and glacierets in the
study region for the period September 2005 to September
2013. The total area of the observed glaciers amounts to 64.3
km² for the year 2005 and has reduced by 14.6 % to 54.9 km²
until 2013. Significant areal shrinkage was detected for all glaciers in the region. None of the observed glaciers displayed
a stationary or advancing behavior during the study period.
The mean area loss in the Southern Ötztal Alps (29 glaciers,
36 % of observed glacier area) during the study period (2005
to 2013) was 15.5 %, while retreat in the Ortler-Cevedale
Group (55 glaciers, 63 % of observed glacier area) amounts
to 14.0 %. As demonstrated in other studies (e.g. Abermann
& alii, 2009; Carturan & alii, 2013a), smaller glaciers tend
to lose larger fractions of their total extent which explains
the larger relative area loss of 20.2 % observed in the Texel
Group (8 glaciers, 1 % of observed glacier area).
All observed glaciers showed a decrease in mean surface
elevation. At the lower parts of some valley glaciers the observed reduction in surface elevation is in the order of 25 to
40 m. Highest rates of surface elevation loss were observed in
the lower parts of Langtauferer Ferner / Ghiacciaio di Vallelunga, Fürkele Ferner / Ved. della Forcola, Zufallferner /
Ved. del Cevedale and LGF. Small reductions or even some
areas with increasing surface elevation were detected in areas where avalanche accumulation is significant, for example
around Königsspitze / Grand Zebru or in parts of Oberer
Ortlerferner / Alto dell Ortles (fig. 3), which as a whole
showed the smallest change of mean surface elevation (-2.2
m) of all glaciers. Remarkable is the detection of a widespread
reduction of glacier thickness even in the highest glaciated
parts of the study region (fig 3). The mean change in glacier
surface elevation for the whole study area amounts to -7.1 m
which corresponds to a mean change rate of about -0.9 m
per year. There is no significant difference between glaciers in
the Ötztal Alps (-7.2 m), the Texel Group (-6.7 m) or in the
Ortler-Cevedale Group (-7.1 m).
The detected volume loss integrated over all glaciers in the
study region amounts to 0.46 x 10⁹ m³. In order to calculate
the corresponding mass loss, the density range of 850 ± 60
kg/m³ proposed by Huss (2013) was applied to the derived
volume loss. The resulting change in glacier mass amounts to
-388 ± 26 x 109 kg and is distributed between the different
mountain ranges as follows: Ötztal Alps: -140 ± 9 x 10⁹ kg,
Texel Group: -8 ± 0.6 x 10⁹ kg, Ortler-Cevedale Group: -240
± 16 x 109 kg.
Many of the observed glaciers showed signs of strong
imbalance with current climate conditions such as rapid
terminus retreat, down-wasting and areal shrinking, disintegration into smaller component parts, an increasing number
and size of rock outcrops and an increase of debris covered
areas. Similar observations have recently been reported from
neighboring mountain ranges (e.g. Abermann & alii 2009,
Carturan & alii 2013a, D’Agata & alii, 2014).
Uncertainties of regional data
While the ALS derived surface elevation data is of high
accuracy (vertical accuracy of 0.12 m compared to an observed mean glacier surface elevation change of -7.1 m), the
main error sources in this study are related to the delineation
of glaciated areas, the extent and amount of snow cover and
the conversion of glacier volume change to mass change.
One of the key difficulties in determining glacier outlines
is associated with delineating the margins of debris covered
ice areas. In the current study, glacier outlines were delineated on the basis of maps of surface elevation difference
between ALS1 and ALS2 in which non-glaciated terrain is
readily identifiable as having undergone no vertical change.
This approach minimizes respective errors (Abermann & alii,
2010), and hence enables a relatively accurate determination
of glacier areas, especially for the date of the first data acquisition in fall 2005. Accordingly, the glacier outlines calculated
by Knoll & Kerschner (2009) were not used in our study, as
their delineation was based on a different technique without
DEM-differencing.
147
Fig. 3 - Spatial distribution of surface elevation change for glaciers in the Ortler-Cevedale Group. The locations of Langenferner / Vedretta Lunga and
Careser are given by the acronyms LGF and CAR respectively. Lower areas of the larger glaciers around Cevedale show the most significant decrease in
surface elevation (red areas) while some very high or avalanche dominated glacier parts around Königsspitze / Gran Zebru and Ortler / Ortles display
minor changes or even slight increase in surface elevation (green & blue areas).
The largest source of error in our study most probably
relates to snow cover which cannot be quantified for individual glaciers within the study area and which is affecting
the conversion of the detected changes in surface elevation
and volume to changes in mass.
As a consequence of the extremely hot summer 2003, the
extent of multi-year firn areas across the region was strongly
reduced. Hence, by 2005, the compaction of multi-year
firn bodies is unlikely to play a significant role on the regional scale. In addition, the size of those areas did also not
change drastically between ALS1 and ALS2. In contrast, the
amount of snow cover on the glaciers differed significantly
between the dates of ALS1 and ALS2. Field work notes and
photos from LGF combined with meteorological information from high elevation weather stations in the study region confirm that at the date of ALS1 (mid of September
2005) the glaciers were covered only with a few centimeters
of snow which was restricted to regions above 3000-3200
m a.s.l. At the date of ALS2 (September 2013), the thick148
ness and extent of snow cover on the glaciers in the study
region was significantly larger than during ALS1. This was
mainly due to the fact that on most glaciers a considerable
amount of snow from the previous winter survived throughout the ablation season of 2013. At LGF the accumulation
area at the end of the hydrological year 2012/13 accounted
for 53 % of the total area, while the mean accumulation area
ratio of the years 2004/05 to 2011/12 was about 10 %. In
the upper parts of LGF the thickness of the observed snow
layer reached the order of two meters. Similar is true for
other glaciers in the region (Matscherferner / Gh. di Mazia,
Madatschferner / Gh. del Madaccio, Texelferner / Gh. di
Tessa) where the ACINN carried out direct measurements
in September and October 2013. As a result of the large
snow amounts in fall 2013, the derived changes in regional
glacier mass are somewhat underestimated. A correction for
this problem on the regional scale is difficult and for this
qualitative analysis is considered not necessary as we make
recourse to the broad range of glacier density proposed
by Huss (2013). Nevertheless, we subsequently provide a
quantification of the error related to the 2013 snow cover
at LGF.
In fall 2013 snow depth probings at LGF were carried
out simultaneously with ALS2 on September 23rd. In combination with further snow depth and density measurements
carried out on September 6th and October 1st 2013, this data
allow for a sound quantification of snow depth and mass
at LGF. In order to calculate the mass of the snow layer
we distinguished between snow from the previous winter
and snow fallen in late Summer / early Autumn 2013. Point
measurements of snow depth were extrapolated to the glacier area by applying an automatic interpolation algorithm.
The resulting mean thickness of the snow cover at LGF during ALS2 was 0.79 m ranging from values close to zero in
the lower most areas of the glacier tongue to more than two
meters in some areas in the upper glacier part. The snow
mass was determined by combining the rasters for snow
depth with snow density information obtained at LGF on
September 23rd (autumn snow) and on October 1st (snow
from previous winter). The values used in the subsequent
analysis are 500 kg/m³ and 300 kg/m³ for snow of the previous winter and for snow of late Summer / early Autumn
2013 respectively.
The geodetically derived mass change of a glacier can be
formulated as follows:
, (1)
where
is the mass change,
is the ALS destands for the
rived mean change in surface elevation,
mean glacier density (in our case 850 ± 60 kg/m²), while
and
represent the corrections related to snow cover during ALS1 and ALS2 respectively. As
previously discussed, we omit the correction for ALS1 due
to the fact that the shallow snow cover at the date of ALS1
was negligible in the context of our analysis over a period of
eight years with drastic glacier retreat. The snow correction
for ALS2 writes as:
, (2)
where
is the mean snow depth during ALS2
is the respective mean snow density (444.3
and
kg/m³). Hence, the mean specific mass of snow cover during
amounts to 351 kg/m²
ALS2 at LGF
of -321 kg/m². Aswhich leads to a value of
suming a density of 850 ± 60 kg/m³, the ALS derived mean
specific geodetic mass balance of LGF during the period fall
2005 to fall 2013 (uncorrected for snow) amounts to -9381 ±
663 kg/m². This indicates that the correction for snow cover
at LGF during ALS2 changes the result by -3.4 % and that
the impact of snow cover is covered by the broad density
range we applied.
Annual surface mass balance at Langenferner
Results of the direct glaciological observations at LGF
for the period 2003/04 to 2013/14 show a mean annual
surface mass balance of -1050 kg/m² with persistent mass
loss in all years except for the hydrological year 2013/14.
Values for single years range from -1637 kg/m² in 2007/08
to +442 kg/m² in 2013/14. Especially the first years of the
observation period were characterized by very negative
mass balances (fig. 4). The years around 2010 brought a
slight decrease of the observed mass losses, while in 2012
ablation rates increased with considerable magnitudes
of melt even in the highest glaciated areas of the region.
Large amounts of accumulation in late spring / early summer 2013 followed by a relatively short ablation season
resulted in limited mass loss on LGF and possibly even
in positive mass balances at a few smaller glaciers in the
Fig. 4 - Time series of seasonal and annual mean specific mass balances measured at LGF during the period 2003/04 to 2013/14.
149
region in that year. The exceptionally high accumulation
in winter 2013/14 and the following cool (relative to the
preceding years) summer 2014 combined to give the only
positive mass balance at LGF in the study period. However, the mass gain of 2013/14 compensates for less than
4% of the large mass losses at LGF during the ten preceding years.
Representativeness of the Langenferner Record
The mass balance record at LGF comprises eleven years
of direct observations, a time span sufficient for first comparisons with records from other mass balance glaciers and
further analyses. Hence, we investigated the spatial representativeness of the LGF record regarding both, the magnitude and inter-annual variability of the directly measured
annual mass balance. Furthermore the directly measured
mass balance was compared to the geodetic mass balance
for the period fall 2005 to fall 2013.
A comparison of the directly measured annual mass
balance at LGF to the mass balance time series of eight
other directly measured glaciers in the Silvretta, the Ötztal
Alps, the Stubai Alps and the Ortler-Cevedale Group (fig.
5) shows that the inter-annual variability of the mass balance record at LGF correlates with records of other reference glaciers. Values for the mean specific mass balance
at LGF are in most cases around the mean of all other
glaciers except for the years 2003/04 and 2007/08 when a
shift towards negative values is detectable. Nevertheless,
the temporal variability of LGFs rank within the sample
set is comparable to those of other individual glaciers. On
this basis, it seems reasonable to transfer the temporal
mass balance signal from LGF to other glaciers of the region, despite the local topographic constraints, the effect
of area altitude distribution (Kuhn & alii, 1985) and the
slight tendency towards a more positive rank towards the
end of the study period visible in Figure 5. The latter may
partly be explained with the loss of low elevated areas at
the formerly larger tongue of the glacier (fig. 2) which were
subject to large mass and area losses during the observation years. It may also be worth noting that in the first observation year the mass balance calculations were carried
out using the glacier area of 1996 as a reference, which
leads to a negative bias of calculated mass balance values.
Another source of error may be the lack of measurement
points in the upper glacier area during the first observation
years affecting the quality of spatial extrapolations. All the
afore mentioned problems require further investigations
and are hence subject to a follow up study dedicated to the
re-analysis of the mass balance record at LGF. Preliminary
results of that study show that the largest errors occur in
2003/04 and 2007/08 (fig. 4 and 5), when the amount of
surface mass loss is most likely overestimated.
To investigate the regional representativeness of the
mass balance magnitude at LGF, the geodetic mass balance of LGF was related to the geodetic mass balance of
all other 91 glaciers in the study region. This assessment
shows that LGF is amongst the glaciers with the most
negative geodetic mass balance during the period fall 2005
to fall 2013, eventhough its altitudinal area distribution
is quite representative for the study region (fig 7.) Consequently, a sound extrapolation of specific mass balance
values obtained at LGF to the regional scale requires further analyses.
Fig. 5 - The time series of annual mean specific mass balances measured at LGF in relation to mass balance series of eight other glaciers in Eastern Alps:
Hintereisferner (HEF), Kesselwandferner (KWF), Jamtalferner (JTF), Vernagtferner (VNF), Weißbrunnferner / Ved. Fontana Bianca (WBF), Careser
(CAR), Uebeltalferner / Gh. d. Malavalle (UTF), Hangender Ferner / Ved. Pendente (HGF) and the sample mean.
150
Fig. 6 - Spatial comparison of directly measured surface mass change (left panel) and ALS derived surface height change (right panel) at LGF for the
period 2005 to 2013.
To cross-check the magnitude of the directly measured mass balance at LGF, the respective results for the
years 2005/06 to 2012/13 were compared to the geodetically derived (from ALS1 and ALS2) mass balance. Figures 6 and 7 show significant differences in the spatial
patterns of the two methods, which can be explained as
follows: While the directly measured mass balance only
accounts for mass change on the glacier surface, the geodetic measurements also capture the local mass change
due to glacier dynamics and mass change due to internal
or subglacial processes (e.g. Zemp & alii., 2013). Consequently, the mass balance values at a fixed point of the
glacier may differ significantly. The spatial pattern of the
geodetic mass balance is smoother due to the compensative effect of ice flow. This effect is of course cancelled
out by integrating the mass balances obtained by either
method over the whole glacier area. At LGF the two
methods show satisfying agreement on the glacier-wide
scale. While the cumulated mean specific mass balance
2005/06 to 2012/13 calculated from the direct measurements amounts to -9197 kg/m², the geodetic mass balance using a density of 850 ± 60 kg/m³ corrected for 2013
snow cover is -9702 ± 685 kg/m². Since large multiannual
firn layers (Huss, 2013), and crevasse zones covering large
areas of the glacier are not present at LGF, the magnitude
of the geodetic mass loss is most likely slightly underestimated. But as a first order comparison the agreement
between the two methods is sufficient and a calibration of
the results obtained by the direct method (Zemp & alii,
2013) seems unnecessary.
The contribution potential of glacier melt
to total river discharge
While during steady state conditions glaciers only act
as a seasonal storage retaining water during the accumulation period and releasing it during the melt period, in years
of glacier retreat they provide an additional contribution
to stream flow. In order to provide a qualitative first order
analysis of this excess discharge due to glacier retreat within
the study area, the regional glacier mass changes were related to the stream flow of the Etsch / Adige measured at
the village of Töll / Tel in the lowest part of the study area.
The mean annual excess discharge due to glacier mass
loss at Töll / Tel amounts to about 4.6 % (tab. 1). This fraction rises to 12.2 % when considering only the months July,
August and September (JAS) during which virtually all the
glacier melt occurs (apart from the seasonal on-glacier snow
cover). Annual values were obtained by scaling the regional
glacier mass change with the series of annual mass change
at LGF. The transfer of mass balance properties from one
glacier to another or even to the regional scale is complex
and difficult (e.g. Kuhn & alii, 2009; Huss, 2012) so this
simplified analysis is error prone. Consequently, this problem will be addressed in more detail in a follow-up study
including distributed glacier modeling and our analysis presented here can be regarded as a first order approximation.
As such, the obtained values for annual runoff contribution
are listed in Table 1. Numbers vary between 0.8 % in the hydrological year 2012/13 and 9 % in the year 2006/07. During the JAS period of the same years the calculated contri151
Fig. 7 - Altitudinal distribution of surface area 2005 and specific mass balance for the period fall 2005 to fall 2013 at LGF (left panel). Altitudinal area
distribution of all studied glaciers and altitudinal distribution of ALS derived specific mass balance for the study region and LGF (right panel).
bution rates amount to 2.1 % and 26.1 % respectively (tab.
1). The maximum contribution in 2006/07 can be explained
by the coincidence of an exceptionally dry winter resulting
in low seasonal snow cover storage and hence very negative
glacier mass balances. Consequently, the runoff from melting snow cover during early summer was lacking while the
excess discharge due to glacier melt was high resulting in
a large relative contribution of the latter to total runoff. In
contrast, the minimum in 2012/13 is due to a relative large
amount of snow related seasonal water storage released during summer and only slightly negative glacier mass balances.
CONCLUSION AND OUTLOOK
We have presented the first results of an interdisciplinary
project carried out at the University of Innsbruck which
aims to investigate the contribution of glacier melt to total
river discharge in the Vinschgau / Val Venosta. We quantified changes in area, volume and mass for 92 glaciers and
glacierets in the study region based on very accurate high
resolution multi-temporal ALS data from fall 2005 and fall
2013. Results reveal drastic mass loss and areal shrinkage on
all glaciers in the study region and a widespread decrease in
Table 1 - Key numbers related to the calculation of annual amounts of regional glacier mass change and the resulting contribution to total river discharge in the Etsch / Adige at the village of Töll / Tel. Directly measured annual mass balance at LGF (b LGF), relative fraction of annual to total mass
loss at LGF (b LGF relative), regional glacier mass loss (GML reg), annual runoff at Töll / Tel (RO Töll), runoff at Töll / Tel during July to September
(RO Töll JAS), as well as glacier melt contribution to total annual runoff (GMC) and to runoff during July to September (GMC JAS) at Töll / Tel.
Year
2005/06
2006/07
2007/08
2008/09
2009/10
2010/11
2011/12
2012/13
Total
b LGF [kg/m²]
-1456
-1616
-1637
-998
-659
-1078
-1532
-221
-9197
b LGF relative
[%]
15,8
17,6
17,8
10,9
7,2
11,7
16,7
2,4
100,0
GML reg [109 kg]
61
68
69
42
28
45
65
9
388
RO Töll [109 kg]
875
761
1111
1192
1049
1094
1060
1242
8386
RO Töll JAS [109
kg]
323
261
504
433
440
403
369
434
3168
GMC [%]
7,0
9,0
6,2
3,5
2,6
4,2
6,1
0,8
4,6
GMC JAS [%]
19,0
26,1
13,7
9,7
6,3
11,3
17,5
2,1
12,2
152
surface elevation even in the highest glaciated areas of the
study region.
The series of directly measured mass balance at LGF for
the period 2003/04 to 2013/14 were analyzed in terms of
regional representativeness of both, the inter-annual variability, as well as the magnitude of the measured mass balances. A comparison of the directly measured balance series at LGF to data of eight other measured glaciers in the
Eastern Alps yields a satisfying representation of the annual
signal. The geodetic mass balance of LGF was compared
to those of all other individual glaciers showing that LGF
is amongst the glaciers with the highest rates of mass loss
in the region during the period 2005 to 2013. Despite the
sufficient results, the analyses also show the need for further
investigations within follow-up studies related to the mass
balance record of LGF.
A cross check of the mass balance derived from direct
measurements with the geodetic mass balance at LGF
yields minor differences between the two approaches revealing that a calibration of the directly measured values
is not required.
A simplified approach was applied in order to provide
a first order estimate of the annual contribution of glacier
retreat to total river discharge in the study region. Results
show that the mean annual excess discharge within the
period fall 2005 to fall 2013 amounts to about 4.6 % with
a minimum value of less than 1 % in the hydrological
year 2012/13 and a maximum of 9 % in 2006/07. Values
for the period July to September are in the order of 12
% and vary between 2.1 % in 2013 and 26.1 % in 2007.
Although the simplified approach applied is most probably subject to larger errors, it was shown that the current
seasonal contribution potential of excess discharge due
to glacier retreat can reach more than 25 % of the total
river discharge and hence requires more detailed investigation in future studies.
T., Dolinar M., Gajic-Capka M., Ksenija Zaninovic K., Zeljko MaZ. & Nieplova E. (2007) - HISTALP - historical instrumental
climatological surface time series of the Greater Alpine Region. International Journal of Climatology, 27(1), 17-46, doi:10.1002/joc.1377.
jstorovic
Baroni C., Bondesan A. & Mortara G. (2013) - Relazioni della Campagna Glaciologica 2012 – Report of the glaciological survey 2012.
Geografia Fisica e Dinamica Quaternaria, 36, 303-304, doi: 10.4461/
GFDQ.2013.36.24.
Carturan L., Filippi R., Seppi R., Gabrielli P., Notarnicola C., Bertoldi L., Paul F., Rastner P., Cazorzi F., Dinale R., & Dalla Fontana G. (2013a) - Area and volume loss of the glaciers in the OrtlesCevedale group (Eastern Italian Alps): controls and imbalance of the
remaining glaciers. The Cryosphere, 7, 1339-1359, doi: 10.5194/
tc-7-1339-2013.
Carturan L., Baroni C., Becker M., Bellin A., Cainelli O., Carton A.,
Casarotto C., Dalla Fontana G., Godio A., Martinelli T., Salvatore M. C. & Seppi R. (2013b) - Decay of a long-term monitored glacier:
Careser Glacier (Ortles-Cevedale, European Alps). The Cryosphere, 7,
1819-1838, 2013, doi: 10.5194/tc-7-1819-2013.
Church J. A., Clark P. U., Cazenave A., Gregory J. M., Jevrejeva S., Levermann A., Merrifield M. A., Milne G. A., Nerem R. S., Nunn P. D.,
Payne A. J., Pfeffer W. T., Stammer D. & Unnikrishnan A. S. (2013)
- Sea Level Change. In Stocker T. F., Qin D., Plattner G.-K., Tignor M.,
Allen S. K., Boschung J., Nauels A., Xia Y., Bex V., & Midgley P. M.
[eds.], Climate Change 2013: The Physical Science Basis. Contribution
of Working Group I to the Fifth Assessment Report of the Intergovernmental Panel on Climate Change. Cambridge, United Kingdom
and New York, NY, USA: Cambridge University Press.
D’Agata C., Bocchiola D., Maragno D., Smiraglia C. & Diolaiuti G.A.
(2014) - Glacier shrinkage driven by climate change during half a century (1954 - 2007) in the Ortles-Cevedale group (Stelvio National Park,
Lombardy, Italian Alps). Theoretical and Applied Climatology, 116,
169-190, doi: 10.1007/s00704-013-0938-5.
Finsterwalder S. (1890) - Die Gletscherausbrüche des Martell-Thales. Mitteilungen des Deutsch-Österreichischen Alpenvereines, 20, 21-34.
Fischer M., Huss M., Barboux, C. & Hoelzle M. (2014) - The new Swiss
Glacier Inventory SGI2010: Relevance of using high-resolution source
data in areas dominated by very small glaciers. Arctic, Antarctic and
Alpine Research, 46(4), 933-945, doi: 10.1657/1938-4246-46.4.933.
Fliri F. (1976) - Niederschlag und Lufttemperatur im Alpenraum. Wissenschaftliche Alpenvereinshefte 24, Innsbruck.
Frei C. & Schär C. (1998) - A precipitation climatology of the Alps from
high-resolution rain-gauge observations. International Journal of Climatology, 18, 873-900.
REFERENCES
Abermann J., Lambrecht A., Fischer A. & Kuhn M. (2009) - Quantifying
changes and trends in glacier area and volume in the Austrian Ötztal
Alps (1969-1997-2006). The Cryosphere, 3, 205-215, doi: 10.5194/tc3-205-2009.
Abermann J., Fischer A., Lambrecht A. & Geist T. (2010): On the potential of very high-resolution repeat DEMs in glacial and periglacial environments. The Cryosphere, 4, 53-65, doi: 10.5194/tc-4-53-2010.
Adler S., Chimani B. , Drechsel S., Haslinger K., Hiebl J., Meyer V.,
Resch G., Rudolph J., Vergeiner J., Zingerle C., Margio G., Fischer
A. & Seiser B. (2015) - Das Klima von Tirol - Südtirol - Belluno: 1981
- 2010. Vergangenheit - Gegenwart – Zukunft. Zentralanstalt für Meteorologie und Geodynamik, Südtirol. Abteilung Brand- und Zivilschutz
(Hrsg.), Fotolito Varesco, Auer, 102pp.
Auer I., Böhm R., Jurkovic A., Lipa W.,Orlik A., Potzmann R., Schöner
W., Ungersböck M., Matulla C., Briffa K., Jones P, Efthymiadis D.,
Brunetti M., Nanni T, Maugeri M., Mercalli L., Mestre O., Moisselin J.M., Begert M., Müller-Westermeier G., Kveton V., Bochnicek
O., Stastny P., Milan Lapin M., Szalai S., Szentimrey T., Cegnar
Geist T., Lutz E. & Stötter J. (2003) - Airborne laser scanning technology
and its potential for applications in glaciology. International Archives
of Photogrammetry, Remote Sensing and Spatial Information Science,
Vol. XXXIV, part 3/W13, 101-106.
Geist T. & Stötter J. (2007) - Documentation of glacier surface elevation
change with multi-temporal airborne laser scanner data - a case study:
Hintereisferner and Kesselwandferner, Tyrol, Austria. Zeitschrift für
Gletscherkunde und Glazialgeologie, 41, 77-106.
Immerzeel W. W., Van Beek L. P. H. & Bierkens M. F. P. (2010) - Climate
change will affect the Asian water towers. Science, 328, 1382-1385,
doi:10.1126/science.1183188.
Joerg P.C., Morsdorf F. & Zemp M. (2012) - Uncertainty assessment of
multi-temporal airborne laser scanning data: A case study on an Alpine
glacier. Remote Sensing of Environment, 127, 118-129.
Huss M. (2011) - Present and future contribution of glacier storage change
to runoff from macroscale drainage basins in Europe. Water Resources
Research, 47, W07511, doi: 10.1029/2010WR010299.
Huss M. (2012) - Extrapolating glacier mass balance to the mountain-range
scale: The European Alps 1900-2100. The Cryosphere, 6, 713-727, doi:
10.5194/tc-6-713-2012.
153
Huss M. (2013) - Density assumptions for converting geodetic glacier volume
change to mass change. The Cryosphere, 7, 877-887, doi: 10.5194/tc7-877-2013.
Kaser G., Munari M., Noggler B., Oberschmied C. & Valentini P. (1996)
- Ricerche sul bilancio di massa del Ghiacciaio di Fontana Bianca (Weissbrunnferner) nel Gruppo Ortles-Cevedale. Geografia Fisica e Dinamica
Quaternaria, 18 (2), 277-280.
Kaser G., Fountain A. & Jansson P. (2003) - A manual for monitoring the
mass balance of glaciers. Technical Documents in Hydrology, 59, 107.
Kaser G., Grosshauser M. & Marzeion B. (2010) - Contribution potential
of glaciers to water availability in different climate regimes. Proceedings
of the National Academy of Sciences, 107, 20223-20227, doi: 10.1073/
pnas.1008162107.
Knoll C. & Kerschner H. (2009) - A glacier inventory for South Tyrol, Italy, based on airborne laser scanner data. Annals of Glaciology, 53, 46-52.
Kuhn M., Markl G., Kaser G., Nickus U., Obleitner F. & Schneider H.
(1985) - Fluctuations of climate and mass balance: Different responses
of two adjacent glaciers. Zeitschrift für Gletscherkunde und Glazialgeologie, 21, 409-416.
Kuhn M., Abermann J., Bacher M. & Olefs M. (2009) - The transfer of
mass balance profiles to unmeasured glaciers. Annals of Glaciology, 50,
185 - 190.
Lambrecht A. & Kuhn M. (2007) - Glacier changes in the Austrian Alps
during the last three decades derived from the new Austrian glacier inventory. Annals of Glaciology, 46, 177-184.
Lambrecht A. & Mayer C. (2009) - Temporal variability of the non-steady
contribution from glaciers to water discharge in western Austria. Journal
of Hydrology, 376, 353-361.
Levermann A., Clark P.U., Marzeion B., Milne G.A., Pollard D., Radic
V. & Robinson A. (2013) - The multimillennial sea-level commitment
of global warming. Proceedings of the National Academy of Sciences,
110, 13745-13750, doi: 10.1073/pnas.1219414110.
Marzeion B., Jarosch A.H. & Hofer M. (2012) - Past and future sea-level
change from the surface mass balance of glaciers. The Cryosphere, 6,
1295-1322, doi: 10.5194/tc-6-1295-2012.
Schaefli B., Hingray B. & Musy A. (2007) - Climate change and hydropower production in the Swiss Alps: quantification of potential impacts and
related modelling uncertainties. Hydrology and Earth System Sciences,
11, 1191-1205, doi: 10.5194/hess-11-1191-2007.
Scotti R., Brardinoni F. & Crosta G.B. (2014) - Post-LIA glacier changes
along a latitudinal transect in the Central Italian Alps. The Cryosphere,
8, 2235-2252, doi: 10.5194/tc-8-2235-2014.
Vaughan D.G., Comiso J.C., Allison I., Carrasco J., Kaser G., Kwok R.,
Mote P., Murray T., Paul F., Ren J., Rignot E., Solomina O., Steffen
K. & Zhang T. (2013) - Observations: Cryosphere. In: Climate Change
2013: The Physical Science Basis. Contribution of Working Group I
to the Fifth Assessment Report of the Intergovernmental Panel on Climate Change [Stocker T.F., Qin D., Plattner G.K., Tignor M., Allen
S.K., Boschung J., Nauels A., Xia Y., Bex V. & Midgley P.M. (eds.)].
Cambridge University Press, Cambridge, United Kingdom and New
York, NY, USA, 317-382, doi: 10.1017/CBO9781107415324.012.
WGMS (2012) - Fluctuations of Glaciers 2005-2010. In: Zemp M., Frey H.,
Gärtner-Roer I., Nussbaumer S. U., Hoelzle M., Paul F. and Haeberli
W. (Eds.), ICSU (WDS)/ IUGG (IACS)/ UNEP/ UNESCO/ WMO,
World Glacier Monitoring Service, Zurich, Switzerland. Based on database version, doi: 10.5904/wgms-fog-2012-11.
Winsvold S.H., Andreassen L.M. & Kienholz C. (2014) - Glacier area
and length changes in Norway from repeat inventories. The Cryosphere,
8(5), 1885-1903, doi: 10.5194/tc-8-1885-2014.
Zanvettor G., Colmano D. & Iellici, M. (2006) - Beschreibung der Kartographischen Daten/Descrizione Dei Dati Cartografici. Landeskartographie und Geographisches Informationssystem/Cartografia Provinciale
E Sistema Informativo Geografico, Autonome Provinz Bozen-Südtirol, Amt für überörtliche Raumordnung, Abteilung Raumordnung.
Zemp M., Thibert E., Huss M., Stumm D., Rolstad Denby C., Nuth C.,
Nussbaumer S. U., Moholdt G., Mercer A., Mayer C., Joerg P. C.,
Jansson P., Hynek B., Fischer A., Escher-Vetter H., Elvehøy H., &
Andreassen L. M. (2013) - Reanalysing glacier mass balance measurement series. The Cryosphere, 7(4), 1227-1245, doi: 10.5194/tc-7-12272013.
Paul F., Kääb A., Maisch M. Kellenberger T. & Haeberli W. (2004) Rapid disintegration of Alpine glaciers observed with satellite data. Geophysical Research Letters, 31, L21402, doi: 10.1029/2004GL020816.
Zemp M., Holger Frey H., Gärtner-Roer I., Nussbaumer S.U., Hoelzle
M., Paul F., Haeberli W., Denzinger F., Ahlstrom A.P., Anderson
B., Bajracharya S., Baroni C., Braun L.N., Caceres B.E., Casassa G.,
Cobos G., Davila L.R., Delgado Granados H., Demuth M.N., Espizua L., Fischer A., Fulita K. Gadek B., Ghazanfar A., Hagen J.O.,
Holmlund P., Karimi N., Zhongqin Li Z., Pelto M., Pitte P., Popovnin V.V., Portocarrero C.A., Prinz R., Sangewar C.V., Severskiy I.,
Sigurdsson O., Soruco A., Usubaliev R. & Vincent C. (2015) - Historically unprecedented global glacier decline in the early 21st century.
Journal of Glaciology, 61(228), 745-762, doi: 10.3189/2015JoG15J017.
Radic V. & Hock R. (2011) - Regionally differentiated contribution of mountain glaciers and ice caps to future sea-level rise. Nature Geoscience, 4,
91-94, doi: 10.1038/NGEO1052.
(Ms. received 30 March 2014; accepted 30 September 2015)
Marzeion B., Cogley J.G., Richter K. & Parkes D. (2014) - Attribution
of global glacier mass loss to anthropogenic and natural causes. Science,
doi: 10.1126/science.1254702.
Østrem G. & Brugmann M. (1991) - Glacier Mass Balance Measurements.
A manual for field and office work. National Hydrology Research Institute (Canada), Science Report No. 4.
154
© Copyright 2026 Paperzz