Tracing Past Human Male Movements in Northern/Eastern Africa and
Western Eurasia: New Clues from Y-Chromosomal Haplogroups E-M78
and J-M12
Fulvio Cruciani,* Roberta La Fratta,* Beniamino Trombetta,* Piero Santolamazza,*
Daniele Sellitto, Eliane Beraud Colomb,à Jean-Michel Dugoujon,§ Federica Crivellaro,*1
Tamara Benincasa,k Roberto Pascone,{ Pedro Moral,# Elizabeth Watson,** Bela Melegh, Guido Barbujani,àà Silvia Fuselli,àà Giuseppe Vona,§§ Boris Zagradisnik,kk Guenter Assum,{{
Radim Brdicka,## Andrey I. Kozlov,*** Georgi D. Efremov, Alfredo Coppa,ààà
Andrea Novelletto,§§§ and Rosaria Scozzari* *Dipartimento di Genetica e Biologia Molecolare, Sapienza Università di Roma, Rome, Italy; Istituto di Biologia e Patologia
Molecolari del Consiglio Nazionale delle Ricerche, Rome, Italy; àLaboratoire d’Immunologie, Hôpital de Sainte-Marguerite,
Marseille, France; §Laboratoire d’Anthropobiologie, FRE 2960 Centre National de la Recherche Scientifique (CNRS), Université
Paul Sabatier, Toulouse, France; kDipartimento di Biologia Cellulare, Università della Calabria, Rende, Italy; {Dipartimento di
Scienze Ginecologiche Perinatologia e Puericultura, Sapienza Università di Roma, Rome, Italy; #Departament de Biologia Animal,
Universitat de Barcelona, Barcelona, Spain; **The Swedish Museum of Natural History, Stockholm, Sweden; Department of
Medical Genetics and Child Development, University of Pécs, Pécs, Hungary; ààDipartimento di Biologia, Università di Ferrara,
Ferrara, Italy; §§Dipartimento di Biologia Sperimentale, Università di Cagliari, Cagliari, Italy; kkLaboratory of Medical Genetics,
General Hospital Maribor, Maribor, Slovenia; {{Institut für Humangenetik, Universität Ulm, Ulm, Germany; ##Institute for
Haematology and Blood Transfusion, Prague, Czech Republic; ***ArctAn C Innovative Laboratory, Moscow, Russia; Research
Center for Genetic Engineering and Biotechnology, Macedonian Academy of Sciences and Arts, Skopje, Republic of Macedonia;
àààDipartimento di Biologia Animale e dell’Uomo, Sapienza Università di Roma, Rome, Italy; and §§§Dipartimento di Biologia,
Università ‘‘Tor Vergata’’, Rome, Italy
Detailed population data were obtained on the distribution of novel biallelic markers that finely dissect the human Ychromosome haplogroup E-M78. Among 6,501 Y chromosomes sampled in 81 human populations worldwide, we found
517 E-M78 chromosomes and assigned them to 10 subhaplogroups. Eleven microsatellite loci were used to further
evaluate subhaplogroup internal diversification.
The geographic and quantitative analyses of haplogroup and microsatellite diversity is strongly suggestive of
a northeastern African origin of E-M78, with a corridor for bidirectional migrations between northeastern and eastern Africa
(at least 2 episodes between 23.9–17.3 ky and 18.0–5.9 ky ago), trans-Mediterranean migrations directly from northern
Africa to Europe (mainly in the last 13.0 ky), and flow from northeastern Africa to western Asia between 20.0 and 6.8 ky ago.
A single clade within E-M78 (E-V13) highlights a range expansion in the Bronze Age of southeastern Europe, which is
also detected by haplogroup J-M12. Phylogeography pattern of molecular radiation and coalescence estimates for both
haplogroups are similar and reveal that the genetic landscape of this region is, to a large extent, the consequence of a recent
population growth in situ rather than the result of a mere flow of western Asian migrants in the early Neolithic.
Our results not only provide a refinement of previous evolutionary hypotheses but also well-defined time frames for
past human movements both in northern/eastern Africa and western Eurasia.
Introduction
A large number of Y chromosome unique event polymorphisms (UEPs) has been reported in the last 7 years (Shen
et al. 2000, 2004; Underhill et al. 2000, 2001; Cruciani et al.
2002, 2004, 2006; The Y Chromosome Consortium 2002;
Hammer et al. 2003; Cinnioğlu et al. 2004; Rootsi et al.
2004; Semino et al. 2004; Wilder et al. 2004; Kayser
et al. 2006; Mohyuddin et al. 2006; Sengupta et al. 2006;
Sims et al. 2007) leading to the identification of hundreds
of Y-specific haplogroups. Most of the terminal branches
of the present Y-phylogenetic tree show a geographic distribution, which is essentially limited to specific continental or
subcontinental areas, mainly as a consequence of the reduced
1
Present address: Leverhulme Centre for Human Evolutionary
Studies, University of Cambridge, Cambridge, United Kingdom.
Key words: Y-chromosome haplogroups, Y-chromosome phylogeography, human migrations, Bronze Age, European populations,
African populations.
E-mail: [email protected].
Mol. Biol. Evol. 24(6):1300–1311. 2007
doi:10.1093/molbev/msm049
Advance Access publication March 10, 2007
The Author 2007. Published by Oxford University Press on behalf of
the Society for Molecular Biology and Evolution. All rights reserved.
For permissions, please e-mail: [email protected]
effective population size of the Y chromosome and/or of the
origin of each branch after major peopling episodes (for a review see Jobling and Tyler-Smith 2003). As previously observed (Cruciani et al. 2004), haplogroup E3b1a (E-M78)
escapes this rule, being present at high frequencies in a wide
area stretching from northern and eastern Africa, Europe,
and western Asia (Underhill et al. 2000, 2001; Bosch
et al. 2001, 2006; Cruciani et al. 2002, 2004; Semino
et al. 2002, 2004; Arredi et al. 2004; Behar et al. 2004;
Cinnioğlu et al. 2004; Flores et al. 2004, 2005; Luis et al.
2004; Shen et al. 2004; Alonso et al. 2005; Goncxalves
et al. 2005; Marjanovic et al. 2005; Peričić et al. 2005;
Sanchez et al. 2005; Wood et al. 2005; Regueiro et al. 2006).
Due to the lack of informative UEPs defining additional nodes internal to this haplogroup, scholars relied
upon the information provided by network analysis of
fast evolving microsatellites in order to identify putative
monophyletic groups of chromosomes within E-M78
(Cruciani et al. 2004; Semino et al. 2004), an approach
which had been successfully used in the past for an initial
molecular dissection of major unresolved haplogroups
(Malaspina et al. 1998, 2000; Scozzari et al. 1999).
E-M78 and J-M12 Y Haplogroups and Human Migrations 1301
Cruciani et al. (2006) recently reported on the identification of 6 new UEPs within the E-M78 clade, 4 of which
seem to be relatively common and informative for evolutionary studies. An evaluation of the correspondence between the subhaplogroups defined by the new UEPs and
the E-M78 clusters previously identified by microsatellite
network analysis, revealed not only a tight correspondence
between the trees generated by the 2 types of markers but
also important discrepancies, underlining once more that
microsatellite-defined clusters cannot always be considered
monophyletic groups of chromosomes (Cruciani et al.
2006).
In the present study, we provide detailed population
data on the distribution of E-M78 binary subhaplogroups
defined by 10 UEPs (2 of which are here described for
the first time) in a sample of 6,501 Y chromosomes belonging to 81 populations mainly from Europe, western Asia,
and Africa. In order to obtain estimates of internal diversity
and coalescence age of E-M78 subhaplogroups and the associated human migrations and demographic expansions,
we also analyzed a set of 11 microsatellites. The same
set of microsatellites was also analyzed in a sample of Y
chromosomes belonging to the haplogroup J-M12, whose
geographic distribution in Europe strictly overlaps that of
a single E-M78 subhaplogroup. Our results not only provide a refinement of previous evolutionary hypotheses
based on microsatellites alone but also well-defined time
frames for different migratory events that led to the dispersal of these haplogroups and subhaplogroups in the
Old World.
Subjects and Methods
Subjects
The sample comprised 6,501 unrelated male subjects
belonging to 81 populations worldwide. Appropriate informed consent was obtained from all participants. Geographic origin and sample size for each population are
reported in table 1 and Supplementary figure 1 (Supplementary Material online).
Molecular Analysis
Samples were obtained from peripheral blood, cultured cells, hair roots, or buccal swabs, and DNA was extracted using appropriate procedures (either phenol–
chloroform extraction followed by ethanol precipitation
or purification by QlAamp kit from Qiagen, Milan, Italy).
In all, 6,501 Y chromosomes were analyzed for the
M78 marker (present study and Cruciani et al. 2002,
2004) by the method of Underhill et al. (2000). Among
them, 517 chromosomes carrying the M78-derived T allele
were further genotyped for 10 markers defining internal nodes, following a hierarchical approach. Typing methods for
8 of these markers (M148, M224, V12, V13, V19, V22,
V27, and V32) were previously described (Underhill
et al. 2000, 2001; Cruciani et al. 2006). Two polymorphic
markers (V36 and V65) are here reported for the first time.
The V36 polymorphism is a T to C transition at position 383
of a 449-bp polymerase chain reaction (PCR) fragment am-
plified using the primers V36 forward (5#-tcctctttccacttaccttcca) and V36 reverse (5#-caaatgcaaatcaccatttagg).
The V65 polymorphism is a G to T transversion at position
77 of a 349-bp PCR fragment amplified using the primers
V65 forward (5#-cctcaacctactaaatgtgaccatg) and V65 reverse (5#-atggccacacaattctccat). Both polymorphisms were
genotyped by denaturing high performance liquid chromatography. The M12 polymorphism (Underhill et al. 1997),
defining haplogroup J2b (Sengupta et al. 2006), has been analyzed as described in Cruciani et al. (2002).
In all, 483 of the 517 E-M78 subjects were further
typed for 4 polymorphic dinucleotide repeats (YCAII
and DYS413 duplicated loci) and 7 tetranucleotide repeats
(DYS19, DYS391, DYS393, DYS439, DYS460 [formerly
A7.1], DYS461 [formerly A7.2], and GATA A10) as previously reported (Cruciani et al. 2004). The same eleven
microsatellites were analyzed in a set of 43 European JM12 chromosomes. The DYS392 microsatellite was analyzed in 101 E-M78 chromosomes using primers reported
by Butler et al. (2002) and the method described by
Cruciani et al. (2002).
Data Analysis
For each haplogroup, phylogenetic relationships
among 11 microsatellite haplotypes were obtained by sequentially performing reduced-median and median-joining
procedures (Bandelt et al. 1995, 1999) through the use of
the network 4.1 program (Fluxus-engineering.com, http://
www.fluxus-engineering.com/sharenet.htm). In order to reduce reticulations in the network, microsatellites were
weighted proportionally to the inverse of the repeat variance observed in each haplogroup.
To estimate the time to the most recent common ancestor (TMRCA) of haplogroups, we used the 7 tetranucleotide loci and applied the average square distance
(ASD) method (Goldstein et al. 1995), where the ancestral
haplotype was assumed to be the haplotype carrying the
most frequent allele at each microsatellite locus. We employed a microsatellite evolutionarily effective mutation
rate (Zhivotovsky et al. 2004). However, because the loci
used here and those used by Zhivotovsky et al. (2004) do
not overlap completely, we calculated the microsatellite
mutation rate as follows: we obtained the mean and standard deviation of the father-to-son mutation rates reported
by Gusmão et al. (2005) for the same loci here used, and
reduced them by a factor 3.6 (i.e., the discrepancy between
the rate estimate obtained from population data and that obtained from father-to-son transmissions [Zhivotovsky et al.
2004]). This resulted in an evolutionarily effective rate x 5
7.9 104 (SD 5 5.7 104), a figure that was also used
in recalculating the E-M215 coalescence age (data from
Cruciani et al. 2004). Recently, Zhivotovsky et al.
(2006) showed that reduced loss of diversity in an expanding population brings the evolutionarily effective rate closer
to the germ line rate than in constant-size populations.
Thus, in the case of expanding populations, we used a correction of the 7.9 104 value, that was calculated as follows. With reference to figure 2 in Zhivotovsky et al.
(2006), the values of accumulated variance in 200–300 generations for the scenarios of 1) a single rate for exponential
1302 Cruciani et al.
Table 1
Frequencies (%) of the Y-Chromosome E-M78 Subhaplogroups in the 81 Populations Analyzed
Population
Number
Frequency of Haplogroup (%)
Region and Population
N
E-M78
E-M78*
E-V12*
E-V13
E-V22
E-V32
E-V65
50
49
56
90
62
55
16
225
28
35
77
40
268
24
104
94
356
141
153
374
74
40
82
92
11
77
106
265
99
147
215
71
204
96
4.00
4.08
—
10.00
3.23
—
6.25
4.44
—
2.86
3.90
2.50
4.85
8.33
2.88
7.45
7.87
10.64
13.07
3.48
4.05
—
3.66
2.17
9.09
7.79
9.43
7.55
18.18
19.05
6.51
16.90
16.67
32.29
—
—
—
—
—
—
—
—
—
—
—
—
—
—
—
—
—
—
—
0.27
—
—
—
—
—
—
—
—
—
—
—
—
—
—
—
—
—
—
—
—
6.25
0.44
—
—
—
—
—
—
—
—
0.28
0.71
0.65
0.27
—
—
—
—
—
—
—
—
—
—
0.93
—
0.49
—
4.00
4.08
—
5.56
—
—
—
4.00
—
2.86
3.90
2.50
4.85
8.33
2.88
5.32
5.34
8.51
7.19
1.07
4.05
—
3.66
2.17
9.09
7.79
9.43
7.17
17.17
17.69
5.58
15.49
16.18
32.29
—
—
—
4.44
3.23
—
—
—
—
—
—
—
—
—
—
2.13
1.97
1.42
4.58
0.80
—
—
—
—
—
—
—
0.38
1.01
0.68
—
1.41
—
—
—
—
—
—
—
—
—
—
—
—
—
—
—
—
—
—
—
—
—
—
—
—
—
—
—
—
—
—
—
—
—
—
—
—
—
—
—
—
—
—
—
—
—
—
—
—
—
—
—
—
0.28
—
0.65
1.07
—
—
—
—
—
—
—
—
—
0.68
—
—
—
—
1
2
3
4
5
6
7
8
9
10
11
12
13
14
15
16
17
18
19
20
21
22
23
24
25
26
27
28
29
30
31
32
33
34
Europe
Northern Portuguesea
Southern Portuguesea
Pasiegos from Cantabriaa
Asturiansa
Southern Spaniardsa
Spanish Basquesa
French Basquesa,b
Frencha,b
Englisha,b
Danisha
Germans
Polisha
Czechs
Slovaks
Slovenians
Northern Italiansa,b
Central Italiansa,b
Southern Italiansa
Siciliansc,d
Sardiniansa,b,e
Estoniansa
Belarusians
Northern Russiansa,b
Southern Russians
Ukrainians
Moldovians
Hungarians
Rumaniansa
Macedonians
Continental Greeks
Greeks from Crete
Greeks from Aegean Islands
Bulgariansa
Albaniansa
35
36
37
38
39
40
41
Northwestern Africa
Moroccan Arabsa
Asni Berbers
Bouhria Berbers
Moyen Atlas Berbersa
Marrakech Berbersa
Moroccan Jews
Mozabite Berbersa,b
55
54
67
69
29
50
20
40.00
3.70
1.49
10.14
6.90
12.00
—
3.64
—
—
—
—
—
—
—
—
—
—
3.45
2.00
—
—
—
1.49
—
—
2.00
—
7.27
3.70
—
—
3.45
8.00
—
—
—
—
—
—
—
—
29.09
—
—
10.14
—
—
—
42
43
44
45
46
47
48
Northeastern Africa
Libyan Jews
Libyan Arabs
Northern Egyptians (Delta)a
Egyptian Berbers
Egyptians from Baharia
Egyptians from Gurna Oasis
Southern Egyptiansa
25
10
72
93
41
34
79
8.00
20.00
23.61
6.45
41.46
17.65
50.63
—
—
—
—
—
5.88
—
—
—
5.56
2.15
14.63
8.82
44.30
4.00
—
1.39
—
2.44
—
1.27
—
—
13.89
—
21.95
—
3.80
—
—
2.78
—
—
2.94
—
4.00
20.00
—
4.30
2.44
—
1.27
49
50
51
52
53
54
55
56
57
58
59
Eastern Africa
Amharaa
Ethiopian Jewsa
Mixed Ethiopiansa
Borana/Oromo (Kenya/Ethiopia)a
Wolaytaa
Somalia
Nilotic from Kenyaa
Bantu from Kenyaa,b
Western Africaa,b,f
Central Africaa,b
Southern Africaa,b
34
22
12
32
12
23
18
28
123
150
105
8.82
9.09
33.33
40.63
16.67
52.17
11.11
3.57
0.81
0.67
—
—
—
—
—
—
—
—
—
—
—
—
—
—
—
—
—
—
—
—
0.81
0.67
—
—
—
—
—
—
—
—
—
—
—
—
—
—
25.00
—
8.33
4.35
11.11
—
—
—
—
8.82
9.09
8.33
40.63
8.33
47.83
—
3.57
—
—
—
—
—
—
—
—
—
—
—
—
—
—
60
61
Western Asia
Istanbul Turkisha
Southwestern Turkisha
35
40
8.57
2.50
—
—
—
—
2.86
2.50
5.71
—
—
—
—
—
E-M78 and J-M12 Y Haplogroups and Human Migrations 1303
Table 1
Continued
Frequency of Haplogroup (%)
Population
Number
Region and Population
a
62
63
64
65
66
67
68
69
70
71
72
73
74
75
76
77
78
79
80
Northeastern Turkish
Southeastern Turkisha
Erzurum Turkisha
Central Anatoliana
Turkish Cypriotsa
Sephardi Turkisha
Palestiniansa
Druze Arabsa
Bedouina
Syrians
Kurds from Iraq
Arabs from United Arab Emiratesa
Omanitea
Adygeia,b
Azeria
Southern Asiaa,b
Chinaa,b
Eastern Asiaa,b
Oceaniaa,b
81
Central and Southern America
Native Americana,b
Total
N
E-M78
E-M78*
E-V12*
E-V13
E-V22
E-V32
E-V65
41
24
25
61
46
19
29
28
28
100
20
40
106
18
97
300
206
41
21
—
4.17
4.00
6.56
13.04
—
10.34
10.71
3.57
2.00
—
2.50
0.94
—
2.06
1.00
—
—
—
—
—
—
—
—
—
—
—
—
—
—
—
—
—
—
—
—
—
—
—
—
4.00
1.64
—
—
—
—
—
—
—
—
—
—
—
—
—
—
—
—
4.17
—
4.92
10.87
—
3.45
10.71
—
—
—
—
—
—
2.06
—
—
—
—
—
—
—
—
2.17
—
6.90
—
3.57
2.00
—
2.50
0.94
—
—
1.00
—
—
—
—
—
—
—
—
—
—
—
—
—
—
—
—
—
—
—
—
—
—
—
—
—
—
—
—
—
—
—
—
—
—
—
—
—
—
—
—
—
43
6,501
—
—
—
—
—
—
—
7.95
0.08
1.00
4.45
1.29
0.54
0.60
a
This sample, or a subset of it, was previously typed for the M78 marker (Cruciani et al. 2004).
Sample (or a subset of it) from the Human Genome Diversity Project/CEPH DNA panel (Cann et al. 2002).
c
43 subjects from Sicily (Trapani) analyzed by Cruciani et al. (2004) are included on the sample.
d
One E-V13 subject also carries the V27 mutation.
e
Two E-V22 subjects also carry the V19 mutation.
f
106 subjects from Burkina Faso analyzed by Cruciani et al. (2002) are included on the sample.
b
population growth and 2) growth with 4 distinct consecutive rates were compared with the amount accumulated in
constant-size populations. This resulted in evolutionarily
effective mutation rates decreased of factors 2.4 and 2.8,
respectively (instead of 3.6), that is, 11.9 104 (SD 5
8.5 104) and 10.2 104 (SD 5 7.3 104), which
were applied to haplogroups E-V13 and J-M12 found in
Europe. Confidence intervals (CIs) for the ASD (and
TMRCA) were obtained as follows: Mutations on the microsatellite genealogy were simulated using a Poisson process, in which the total number of mutational events was
calculated based on branch length and assuming that mutations at each microsatellite were gamma-distributed with
mean and standard deviation calculated as above. Each mutation increased or decreased allele length by one step (each
with probability 0.5). ASD was then evaluated for the simulated data and the whole process repeated 1,000 times to
quote the central 95% of values. This method represents
a refinement of that by Thomas et al. (1998) and Scozzari
et al. (2001), as it also takes into account heterogeneity of
mutation rates across loci. An independent dating method
(q statistics; Forster et al. 1996; Saillard et al. 2000) was
also used to assay how robust the time obtained is to choice
of method.
Both dating procedures rely on the appropriate choice
of a haplotype to be considered ancestral, which remains an
uncontrolled source of uncertainty. We observe that the qbased ages are slightly younger than the ASD-based ones
(fig. 1). The difference is significant only for the root of the
entire haplogroup, this being attributable to the relevant
departure from a star-like structure because of repeated
founder effects (Saillard et al. 2000). Only values obtained
from ASD are quoted in the text.
Haplogroup diversity and its sampling variance were
estimated as in Arlequin 3.0 (Excoffier et al. 2005).
Frequency and variance maps were depicted on a grid
of 44 60 lines using the Kriging procedure (Cressie 1991)
through the use of the program Surfer 6.0 (Golden Software, Inc., Golden, CO). The map of microsatellite variances was obtained after pooling data from locations with less
than 3 observations and assigning the resulting figures to
the centroid of the pooled locations. These points are plotted in figure 5.
Results and Discussion
Molecular Dissection of E-M78 Haplogroup
By analyzing a worldwide sample of 6,501 male subjects, we have identified 517 chromosomes belonging to haplogroup E-M78, more than twice the number found in
a previous study (Cruciani et al. 2004). These chromosomes
have been further analyzed for the biallelic markers M148
(Underhill et al. 2000), M224 (Underhill et al. 2001), V12,
V13, V19, V22, V27, V32 (Cruciani et al. 2006), V36,
and V65 (present study). Only 2 of the markers analyzed
(V13 and V36) were phylogenetically equivalent, leading
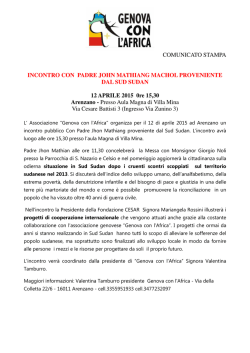
to the identification of a total of 10 distinct haplogroups/paragroups (fig. 1), with only 5 chromosomes remaining in the
paragroup E-M78*. Four subhaplogroups were either rare
(1 and 2 subjects for E-V27 and E-V19, respectively) or absent (E-M148 and E-M224) in the global sample, whereas the
1304 Cruciani et al.
Fig. 1.—Maximum parsimony phylogeny of haplogroup E-M78. Coalescent estimates for the haplogroup E-M78 and major subhaplogroups are
shown on the right. The ASD-based estimates are reported with their 95% CIs (in parentheses); the q-based estimates are reported with their SD (in
parentheses). For haplogroup E-V13, the value obtained on the subset of western Asian samples is reported as this is free from the effect of the
population expansion recorded in Europe (see text). Haplogroup nomenclature as cited in the text is reported at the bottom; n.a. —not available (rare
haplogroups).
other haplogroups/paragroups were relatively common (table 1 and fig. 2). The E-M78 subhaplogroup identified by
the new mutation V65 includes all but 2 of the chromosomes
previously included in the cluster b and 1 chromosome from
cluster c of the E-M78 microsatellite network (Cruciani et al.
2004), once again underlining the strong but not perfect
correspondence between microsatellite-defined clusters
and UEP-defined haplogroups (Cruciani et al. 2006).
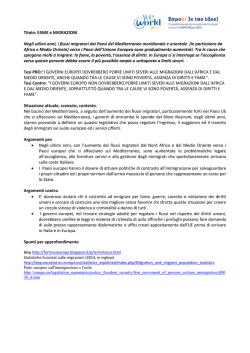
Fig. 2.—Maps of the observed haplogroup/paragroup frequencies. (A) E-M78; (B) E-V12*; (C) E-V32; (D) E-V13; (E) E-V22; and (F) E-V65.
E-M78 and J-M12 Y Haplogroups and Human Migrations 1305
The subdivision of E-M78 in the six common major
clades revealed a pronounced geographic structuring (table
1 and fig. 2): Haplogroup E-V65 and the paragroups EM78* and E-V12* were observed mainly in northern
Africa, haplogroup E-V13 was found at high frequencies
in Europe, and haplogroup E-V32 was observed at high
frequencies only in eastern Africa. The only haplogroup
showing a wide geographic distribution was E-V22, relatively common not only in northeastern and eastern Africa
but also found in Europe and western Asia, up to southern
Asia (table 1, fig. 2).
Locating the Origin of Haplogroup E-M78
An eastern African origin for this haplogroup was
hypothesized on the basis of the exclusive presence in that
area of a putative ancestral 12-repeat allele at the
DYS392 microsatellite, found in association with E-M78
chromosomes (Semino et al. 2004). Northeastern African
populations were not represented in that study. In order
to test this hypothesis, we analyzed for DYS392, a geographically widespread subset of the E-M78 chromosomes
here identified. We observed that the DYS392 12-repeat allele is associated with the majority of the chromosomes belonging to the northeastern African E-V12* (15 out of 18)
and to the eastern African E-V32 (21 out of 23), with about
half (9 out of 21) of the E-V22 chromosomes (both in eastern and northeastern Africa), with a few of the European EV13 (2 out of 23), and with some north-African E-V65 (3
out of 16) chromosomes. These findings show that the
DYS392 12-repeat allele is common in different regions
characterized by high frequencies of E-M78 and suggest
that it was most likely generated by multiple mutational
events occurring in different UEP-defined subhaplogroups.
Thus, the DYS392 allele distribution is not informative to
infer the place of origin of E-M78 chromosomes.
An eastern African origin for haplogroup E-M78 was
also hypothesized on the basis of the frequency distribution
and microsatellite diversity (Cruciani et al. 2004). We may
now test this hypothesis by exploiting the new information
provided by internal biallelic markers and the extensive resampling in which northeastern Africa is covered by a robust group of 90 E-M78 chromosomes. The frequencies
of E-M78 in northeastern Africa and eastern Africa are not
significantly different (0.25 ± 0.03 and 0.22 ± 0.02,
respectively). As far as the microsatellite diversity is
concerned, the highest mean variances across 7 tetranucleotide loci are those observed in eastern Africa and northeastern Africa (0.50 and 0.46, respectively), but an examination
of the variances at individual loci reveals that in eastern
Africa there is a disproportionate contribution of DYS19
to the mean variance (1.87). This is likely due to a multirepeat deletion associated with the common eastern African
E-V32 haplogroup (Cruciani et al. 2006 and supplementary
table 1). When this locus is removed from the analysis, we
obtain mean variances across 6 loci of 0.41 and 0.27 for
northeastern and eastern Africa, respectively. Variances
at the 6 individual loci are always higher in the former region, and this difference is statistically significant for the
microsatellite locus DYS461 (F test for equality of varian-
ces P , 0.05). Finally, a greater diversity of E-M78 binary
subhaplogroups can be observed in northeastern Africa
(0.61 ± 0.04), where all the E-M78 major branches are present, than in eastern Africa (0.30 ± 0.08), where only subhaplogroups E-V22 and E-V32 are found. E-V22 is
observed at high frequencies in both northeastern and eastern Africa, with microsatellite variances of 0.46 and 0.35,
respectively. The other common eastern African subhaplogroup, E-V32, that represents about 82% of the eastern
African E-M78 chromosomes, is a relatively recent terminal branch of E-V12 (8.5 ky, fig. 1), the remaining E-V12
chromosomes being found almost exclusively in northeastern Africa as paragroup E-V12*. The haplogroups E-V13
and E-V65 are also found in northeastern Africa. Although
an origin for E-V13 outside the region is likely (see below),
E-V65 probably originated in situ as inferred on the basis
of its nearly exclusive presence and diversity. It is also
worth noting that the rare paragroup E-M78* has not been
observed in eastern Africa; moreover, the 2 northwestern
African E-M78* chromosomes are well differentiated
from the 2 northeastern African E-M78* chromosomes
(supplementary table 1, Supplementary Material online)
adding a new argument for a higher haplogroup diversity
in northern Africa.
In conclusion, the peripheral geographic distribution
of the most derived subhaplogroups with respect to northeastern Africa, as well as the results of quantitative analysis
of UEP and microsatellite diversity are strongly suggestive
of a northeastern rather than an eastern African origin of
E-M78. Northeastern Africa thus seems to be the place from
where E-M78 chromosomes started to disperse to other
African regions and outside Africa.
A Corridor for Bidirectional Migrations between
Northeastern and Eastern Africa
The evolutionary processes that determined the wide
dispersal of the E-M78 lineages from northeastern Africa to
other regions can now be addressed.
E-M78 belongs to clade E3b (E-M215). On the basis
of robust phylogeographic considerations, an eastern
African origin has been proposed for E-M215 (Underhill
et al. 2001; Cruciani et al. 2004), with a coalescence time
of 22.4 ky (95% CI 20.9–23.9 ky; recalculated from
Cruciani et al. [2004], see Subjects and Methods). A northeastern African origin for haplogroup E-M78 implies that
E-M215 chromosomes were introduced in northeastern
Africa from eastern Africa in the Upper Paleolithic, between 23.9 ky ago (the upper bound for E-M215 TMRCA
in eastern Africa) and 17.3 ky ago (the lower bound for EM78 TMRCA here estimated, fig. 1). In turn, the presence
of E-M78 chromosomes in eastern Africa can be only explained through a back migration of chromosomes that had
acquired the M78 mutation in northeastern Africa. The
nested arrangement of haplogroups E-V12 and E-V32 defines an upper and lower bound for this episode, that is, 18.0
ky and 5.9 ky, respectively. These were probably not massive migrations, because the present high frequencies of EV12 chromosomes in eastern Africa are entirely accounted
for by E-V32, which most likely underwent subsequent
1306 Cruciani et al.
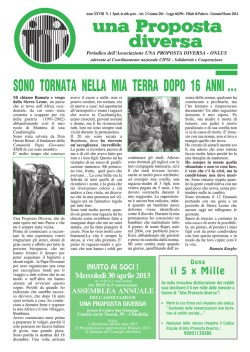
Fig. 3.—Microsatellite networks of haplogroups E-V12 (A); E-V22 (B); and E-V65 (C). In network (A), a dotted circle includes all of the E-V12
chromosomes carrying the V32 mutation. Branch lengths are proportional to the number of one-repeat mutations separating 2 haplotypes. Each circle
area is proportional to the frequency of the sampled haplotype.
geographically restricted demographic expansions involving well differentiated molecular types (fig. 3A). Conversely, the absence of E-V12* chromosomes in eastern
Africa is compatible with loss by drift. Possible more recent
episodes of gene flow are associated with the less common
E-V22 subhaplogroup, also present in both northeastern
and eastern Africa, but without a clear pattern of microsatellite molecular differentiation (fig. 3B). It is conceivable
that the Nile river valley has acted as a genetic corridor for
human migrations between northeastern and eastern Africa,
a scenario that is also supported by mtDNA analysis both at
HV1 (Krings et al. 1999) and entire molecule sequence
(Olivieri et al. 2006). There are also other Y-chromosome
haplogroups shared by northeastern and eastern African
populations, that is, E-M123, J-M267, and K-M70
(Underhill et al. 2000, Cruciani et al. 2004; Luis et al.
2004; Semino et al. 2004; Sanchez et al. 2005). However,
unlike E-V12 and E-V22, these haplogroups are also
common in western Asia, where they probably originated
(Cruciani et al. 2004; Luis et al. 2004; Semino et al. 2004).
Thus, it is unclear whether their present geographic distribution in Africa is the consequence of the same evolutionary events that involved the E-M78 chromosomes or
whether they have been introduced independently from
western Asia in eastern and northeastern Africa. Only the
molecular dissection of haplogroups E-M123, J-M267,
and K-M70 along with an extensive sampling of populations
from these regions will help in answering this question.
Direct Northern African Contribution to the European
Gene Pool
Previous studies on the Y-chromosome phylogeography have revealed that central and western Asia were the
main sources of Paleolithic and Neolithic migrations contributing to the peopling of Europe (Underhill et al. 2000;
Wells et al. 2001). Only sporadic traces of northern African
Y chromosomes were found in the European gene pool,
mainly linked to the presence at low frequencies of the
E-M81 haplogroup in Mediterranean coastal populations
(Bosch et al. 2001; Scozzari et al. 2001; Cruciani et al.
2004; Goncxalves et al. 2005). The molecular dissection
of E-M78 contributes to the understanding of the genetic
relationships between northern Africa and Europe. Several
lines of evidence suggest that E-M78 subhaplogroups E-V12,
E-V22, and E-V65 have been involved in trans-Mediterranean
E-M78 and J-M12 Y Haplogroups and Human Migrations 1307
migrations directly from Africa. These haplogroups are common in northern Africa, where they likely originated, and are
observed almost exclusively in Mediterranean Europe, as opposed to central and eastern Europe (table 1 and fig. 2). Also,
among the Mediterranean populations, they are more common
in Iberia and south-central Europe than in the Balkans, the natural entry-point for chromosomes coming from the Levant.
Such findings are hardly compatible with a southeastern entry
of E-V12, E-V22, and E-V65 haplogroups into Europe. Upper
limits for the introduction of each of these haplogroups in Europe are given by their estimated ages (fig. 1), whereas lower
bounds should be close to the present times, given the lack of
internal geographic structuring (fig. 3A–C; Cruciani et al.
2004; Semino et al. 2004). Considering both these E-M78 subhaplogroups (present study) and the E-M81 haplogroup
(Cruciani et al. 2004), the contribution of northern African lineages to the entire male gene pool of Iberia (barring Pasiegos),
continental Italy, and Sicily can be estimated as 5.6%, 3.6%,
and 6.6%, respectively. Whether lineages E-M123, J-M267,
G-M201, and K-M70, commonly found in both northern
Africa and Europe (Bosch et al. 2001; Arredi et al. 2004;
Cruciani et al. 2004; Semino et al. 2004), were involved in
the same population movements remains to be ascertained due
to the poor phylogeographic resolution of these haplogroups.
The Haplogroup E-V13: Migrations and Demographic
Expansions in Western Eurasia
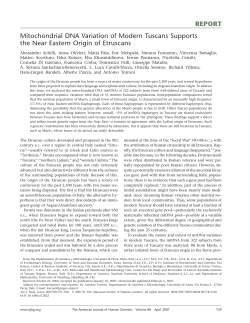
Fig. 4.—Microsatellite networks of haplogroups E-V13 in Europe
(A), E-V13 in western Asia (B), and J-M12 in Europe (C).
Haplogroup E-V13 is the only E-M78 lineage that reaches the highest frequencies out of Africa. In fact, it represents about 85% of the European E-M78 chromosomes
with a clinal pattern of frequency distribution from the
southern Balkan peninsula (19.6%) to western Europe
(2.5%). The same haplogroup is also present at lower frequencies in Anatolia (3.8%), the Near East (2.0%), and the
Caucasus (1.8%). In Africa, haplogroup E-V13 is rare, being observed only in northern Africa at a low frequency
(0.9%). The European E-V13 microsatellite haplotypes
are related to each other to form a nearly perfect star-like
network (fig. 4A), a likely consequence of a rapid demographic expansion (Jobling et al. 2004). The TMRCA of
the European E-V13 chromosomes turns out to be 4.0–
4.7 ky (under 2 different demographic expansion scenarios,
see Subjects and Methods; 95% CI 3.5–4.6 ky and 4.1–5.3
ky, respectively). On the other hand, when only E-V13
chromosomes from western Asia are considered, the resulting network (fig. 4B) does not show such a star-like shape,
and a much earlier TMRCA of 11.5 ky (95% CI 6.8–17.0;
fig. 1) is obtained. These results open the possibility of recognizing time windows for 1) population movements from
the E-M78 homeland in northeastern Africa to Eurasia and
2) population movements from western Asia into Europe
and later within Europe.
The low E-V13 frequency (0.9%) and microsatellite
variance (0.13) in northern Africa do not support an antiquity greater than in western Asia. Thus, the most parsimonious and plausible scenario is that E-V13 originated in
western Asia about 11 ky ago, and its presence in northern
Africa is the result of a more recent introgression. Under
this hypothesis, E-V13 chromosomes sampled in western
Asia and their coalescence estimate detect a likely Paleo-
lithic exit out of Africa of E-M78 chromosomes devoid
of the V13 mutation, which later occurred somewhere in
the Near East/Anatolia. The refinement of location for
the source area of such movements and associated chronologies here attained may be relevant to controversies on the
spread of cultures (and languages) between Africa and Asia
in the corresponding time frames (Bellwood 2004; Ehret
et al. 2004, and references therein).
As to a western Asia–Europe connection, our data suggest that western Asians carrying E-V13 may have reached
the Balkans anytime after 17.0 ky ago, but expanded into
Europe not earlier than 5.3 ky ago. Accordingly, the allele
frequency peak is located in Europe, whereas the distribution of microsatellite allele variance shows a maximum in
western Asia (fig. 5). Based on previously published data
(Scozzari et al. 2001; Di Giacomo et al. 2004; Semino et al.
2004; Marjanovic et al. 2005), we observed that another
haplogroup, J-M12, shows a frequency distribution within
Europe similar to that observed for E-V13. In order to evaluate whether the present distribution of these 2 haplogroups
can be the consequence of the same expansion/dispersal microevolutionary event, we first compared the 2 frequency
distributions in Europe (J-M12 frequencies obtained from
both published and new data; supplementary table 2,
Supplementary Material online). We observed a high and
statistically significant correspondence between the
frequencies of the 2 haplogroups (r 5 0.84, 95% CI
0.70–0.92). A similar result (r 5 0.85, 95% CI 0.70–0.93)
was obtained when the series was enlarged with the J-M12
data from Bosnia, Croatia, and Serbia (Marjanovic et al.
2005) matched with the frequencies of E-M78 cluster a
(Peričić et al. 2005) as a proxy for haplogroup E-V13
1308 Cruciani et al.
(Cruciani et al. 2006). We then constructed a microsatellite
network of 43 European J-M12 chromosomes (supplementary table 3, Supplementary Material online) and found a clear
star-like structure (fig. 4C), a further feature shared with EV13. This similarity was mirrored by a unimodal distribution
of haplotype pairwise differences for both haplogroups (not
shown). Finally, we used tetranucleotide microsatellite data
in order to obtain a coalescence estimate for the J-M12 haplogroup in Europe. By taking into consideration 2 different
demographic expansion models (see Subjects and Methods),
we obtained TMRCA estimates very close to those of E-V13,
that is, 4.1 ky (95% CI 2.8–5.4 ky) and 4.7 ky (95% CI 3.3–6.4
ky), respectively. Thus, the congruence between frequency
distributions, shape of the networks, pairwise haplotypic differences, and coalescent estimates points to a single evolutionary event at the basis of the distribution of
haplogroups E-V13 and J-M12 within Europe, a finding
never appreciated before. These 2 haplogroups account for
more than one-fourth of the chromosomes currently found
in the southern Balkans, underlining the strong demographic
impact of the expansion in the area.
Either environmental or cultural transitions are usually
considered to be at the basis of dramatic changes of the size
of human populations (Jobling et al. 2004). At least 4 major
demographic events have been envisioned for this geographic area, that is, the post-Last Glacial Maximum expansion (about 20 kya) (Taberlet et al. 1998; Hewitt 2000), the
Younger Dryas–Holocene reexpansion (about 12 kya), the
population growth associated with the introduction of
agricultural practices (about 8 kya) (Ammerman and
Cavalli-Sforza, 1984), and the development of Bronze technology (about 5 kya) (Childe 1957; Piggott 1965; Renfrew
1979; Kristiansen 1998). Though large, the CI for the coalescence of both haplogroups E-V13 and J-M12 in Europe
exclude the expansions following the Last Glacial Maximum or the Younger Dryas. Our estimated coalescence
age of about 4.5 ky for haplogroups E-V13 and J-M12
in Europe (and their CIs) would also exclude a demographic
expansion associated with the introduction of agriculture
from Anatolia and would place this event at the beginning
of the Balkan Bronze Age, a period that saw strong
demographic changes as clearly testified from archeological
records (Childe 1957; Piggott 1965; Kristiansen 1998).
The arrangement of E-V13 (fig. 2D) and J-M12 (not shown)
frequency surfaces appears to fit the expectations for a range
expansion in an already populated territory (Klopfstein
et al. 2006). Moreover, similarly to the results reported
by Peričić et al. (2005) for E-M78 network a, the dispersion
of E-V13 and J-M12 haplogroups seems to have mainly
followed the river waterways connecting the southern
Balkans to north-central Europe, a route that had already
hastened by a factor 4-6 the spread of the Neolithic to
the rest of the continent (Tringham 2000; Davison et al.
2006). This axis also served as a major route for the following millennia, enabling cultural and material (and possibly
genetic) exchanges to and from central Europe (Childe
1957; Piggott 1965; Kristiansen 1998). Thus, the present
work discloses a further level of complexity in the interpretation of the genetic landscape of southeastern Europe,
this being to a large extent the consequence of a recent
population increase in situ rather than the result of a
Fig. 5.—Mean variance spatial distribution of the Y-chromosome
haplogroup E-V13 after pooling data from locations with ,3 observations (see Subjects and Methods).
mere flow of western Asian migrants in the early Neolithic.
Indeed, Y-chromosomal data from regions to the north
(Kasperavičiut_e et al. 2004), northwest (Luca et al.
2007), and west (Di Giacomo et al. 2004) to the Balkans
show signatures of demographic events that match archeologically documented changes in the population size in the
1st millennia BC.
Concluding Remarks
The buildup of the present day male-specific Y-chromosome (MSY) diversity can be viewed as an increase of
complexity due to the repeated addition of new variation to
the preexisting background by 2 main mechanisms: immigration of differentiated MSY copies from outer regions
and accumulation of novel MSY variants generated by
new mutations in loco. The question is whether a DNA
polymorphism, which is able to mark a specific episode indeed exists and is known. Recently, Sengupta et al. (2006)
pointed out that combining high resolved phylogenetic hierarchy, haplogroup internal diversification, geography,
and expansion time estimates can lead to the appropriate
diachronic partition of the MSY pool. The DNA content
of the MSY ensures that abundant diversity exists to proceed a long way in this process of phylogeographic refinement eventually leading to a level of resolution for human
history comparable with, or even greater, than that achieved
by mitochondrial DNA (Torroni et al. 2006).
Supplementary Material
Supplementary figure 1 and tables 1–3 are available
at Molecular Biology and Evolution online (http://
www.mbe.oxfordjournals.org/).
Acknowledgments
We are grateful to all the donors for providing DNA
samples and to the people that contributed to the sample
E-M78 and J-M12 Y Haplogroups and Human Migrations 1309
collection. In particular, we thank João Lavinha (for
the Portuguese samples); Farha El Chennawi, Anne
Cambon-Thomsen, M.S. Issad, Eric Crubézy, Abdellatif
Baali, Mohammed Cherkaoui, and Mohammed Melhaoui
for their help in the collection of the Moroccan, Algerian,
and Egyptian Berbers samples; and the National Laboratory
for the Genetics of Israeli Populations. The useful comments and suggestions of 2 anonymous reviewers are
gratefully acknowledged. This research received support
from Grandi Progetti Ateneo, Sapienza Università di Roma
(to R.S.), and the Italian Ministry of the University (Progetti
di Ricerca di Interesse Nazionale 2005 to R.S. and Fondo
Integrativo Speciale Ricerca 1999 to G.B. and R.S.). Russian samples were collected in the frame of an Italian-Russian scientific-technological project (3.RB3). The sampling
of the Berbers was made within the framework of the Inserm ÆÆRéseau Nord/Sudææ N490NS1 (Mozabite Berbers),
‘‘The Origin of Man, Language and Languages’’, EUROCORES Programme and benefited from funding by the Région Midi-Pyrénées (Toulouse, France), the CNRS, and the
E.C. Sixth Framework Programme under Contract
ERASCT-2003-980409.
Literature Cited
Alonso S, Flores C, Cabrera V, Alonso A, Martı́n P, Albarrán C,
Izagirre N, de la Rúa C, Garcı́a O. 2005. The place of the
Basques in the European Y-chromosome diversity landscape.
Eur J Hum Genet. 13:1293–1302.
Ammerman AJ, Cavalli-Sforza LL. 1984. The neolithic transition
and the genetics of populations in Europe. Princeton:
Princeton University Press.
Arredi B, Poloni ES, Paracchini S, Zerjal T, Fathallah DM,
Makrelouf M, Pascali VL, Novelletto A, Tyler-Smith C. 2004.
A predominantly neolithic origin for Y-chromosomal DNA
variation in North Africa. Am J Hum Genet. 75:338–345.
Bandelt H-J, Forster P, Röhl A. 1999. Median-joining networks for
inferring intraspecific phylogenies. Mol Biol Evol. 16:37–48.
Bandelt H-J, Forster P, Sykes BC, Richards MB. 1995.
Mitochondrial portraits of human populations using median
networks. Genetics. 141:743–753.
Behar DM, Garrigan D, Kaplan ME, Mobasher Z,
Rosengarten D, Karafet TM, Quintana-Murci L, Ostrer H,
Skorecki K, Hammer MF. 2004. Contrasting patterns of
Y chromosome variation in Ashkenazi Jewish and host nonJewish European populations. Hum Genet. 114:354–365.
Bellwood P. 2004. The origins of Afroasiatic. Science 306:1681.
Bosch E, Calafell F, Comas D, Oefner PJ, Underhill PA,
Bertranpetit J. 2001. High-resolution analysis of human Ychromosome variation shows a sharp discontinuity and
limited gene flow between northwestern Africa and the
Iberian Peninsula. Am J Hum Genet. 68:1019–1029.
Bosch E, Calafell F, González-Neira A, et al. (13 co-authors).
2006. Paternal and maternal lineages in the Balkans show
a homogeneous landscape over linguistic barriers, except for
the isolated Aromuns. Ann Hum Genet. 70:459–487.
Butler JM, Schoske R, Vallone PM, Kline MC, Redd AJ,
Hammer MF. 2002. A novel multiplex for simultaneous
amplification of 20 Y chromosome STR markers. Forensic Sci
Int. 129:10–24.
Cann HM, de Toma C, Cazes L, et al. (41 co-authors). 2002. A
human genome diversity cell line panel. Science. 296:261–262.
Childe VG. 1957. The dawn of European civilization. London:
Routledge and Kegan Paul.
Cinnioğlu C, King R, Kivisild T, et al. (15 co-authors). 2004.
Excavating Y-chromosome haplotype strata in Anatolia. Hum
Genet. 114:127–148.
Cressie NAC. 1991. Statistics for spatial data. New York: John
Wiley and Sons Inc.
Cruciani F, La Fratta R, Santolamazza P, et al. (19 co-authors).
2004. Phylogeographic analysis of haplogroup E3b (E-M215)
Y chromosomes reveals multiple migratory events within and
out of Africa. Am J Hum Genet. 74:1014–1022.
Cruciani F, La Fratta R, Torroni A, Underhill PA, Scozzari R.
2006. Molecular dissection of the Y chromosome haplogroup
E-M78 (E3b1a): a posteriori evaluation of a microsatellitenetwork-based approach through six new biallelic markers.
Hum Mutat. 27:831–832.
Cruciani F, Santolamazza P, Shen P, et al. (16 co-authors). 2002.
A back migration from Asia to sub-Saharan Africa is
supported by high-resolution analysis of human Y-chromosome haplotypes. Am J Hum Genet. 70:1197–1214.
Davison K, Dolukhanov P, Sarson GR, Shukurov A. 2006. The
role of waterways in the spread of the Neolithic. J Archaeol
Sci. 33:641–652.
Di Giacomo F, Luca F, Popa LO, et al. (27 co-authors). 2004. Y
chromosomal haplogroup J as a signature of the post-neolithic
colonization of Europe. Hum Genet. 115:357–371.
Ehret C, Keita SOY, Newman P. 2004. The origins of
Afroasiatic. Science. 306:1680–1681.
Excoffier L, Laval G, Schneider S. 2005. Arlequin (version 3.0):
an integrated software package for population genetics data
analysis. Evol Bioinform Online. 1:47–50.
Flores C, Maca-Meyer N, González AM, Oefner PJ, Shen P,
Pérez JA, Rojas A, Larruga JM, Underhill PA. 2004. Reduced
genetic structure of the Iberian peninsula revealed by Ychromosome analysis: implications for population demography. Eur J Hum Genet. 12:855–863.
Flores C, Maca-Meyer N, Larruga JM, Cabrera VM,
Karadsheh N, Gonzalez AM. 2005. Isolates in a corridor of
migrations: a high-resolution analysis of Y-chromosome
variation in Jordan. J Hum Genet. 50:435–441.
Forster P, Harding R, Torroni A, Bandelt H-J. 1996. Origin and
evolution of Native American mtDNA variation: a reappraisal.
Am J Hum Genet. 59:935–945.
Goldstein DB, Ruiz Linares A, Cavalli-Sforza LL, Feldman MW.
1995. Genetic absolute dating based on microsatellites and the
origin of modern humans. Proc Natl Acad Sci USA.
92:6723–6727.
Goncxalves R, Freitas A, Branco M, Rosa A, Fernandes AT,
Zhivotovsky LA, Underhill PA, Kivisild T, Brehm A. 2005.
Y-chromosome lineages from Portugal, Madeira and Acxores
record elements of Sephardim and Berber ancestry. Ann Hum
Genet. 69:443–454.
Gusmão L, Sánchez-Diz P, Calafell F, et al. (42 co-authors).
2005. Mutation rates at Y chromosome specific microsatellites. Hum Mutat. 26:520–528.
Hammer MF, Blackmer F, Garrigan D, Nachman MW,
Wilder JA. 2003. Human population structure and its effects
on sampling Y chromosome sequence variation. Genetics.
164:1495–1509.
Hewitt G. 2000. The genetic legacy of the Quaternary ice ages.
Nature. 405:907–913.
Jobling MA, Hurles ME, Tyler-Smith C. 2004. Human
evolutionary genetics. New York: Garland Science.
Jobling MA, Tyler-Smith C. 2003. The human Y chromosome:
an evolutionary marker comes of age. Nat Rev Genet.
4:598–612.
Kasperaviči
ut_e D, Kučinskas V, Stoneking M. 2004. Y
chromosome and mitochondrial DNA variation in Lithuanians. Ann Hum Genet. 68:438–452.
1310 Cruciani et al.
Kayser M, Brauer S, Cordaux R, et al. (15 co-authors). 2006.
Melanesian and Asian origins of Polynesians: mtDNA and Y
chromosome gradients across the Pacific. Mol Biol Evol.
23:2234–2244.
Klopfstein S, Currat M, Excoffier L. 2006. The fate of mutations
surfing on the wave of a range expansion. Mol Biol Evol.
23:482–490.
Krings M, Salem AEH, Bauer K, et al. (13 co-authors). 1999.
mtDNA analysis of Nile River Valley populations: a genetic
corridor or a barrier to migration? Am J Hum Genet.
64:1166–1176.
Kristiansen K. 1998. Europe before history. Cambridge: Cambridge
University Press.
Luca F, Di Giacomo F, Benincasa T, Popa LO, Banyko J,
Kracmarova A, Malaspina P, Novelletto A, Brdicka R. 2007.
Y-chromosomal variation in the Czech Republic. Am J Phys
Anthropol. 132:132–139.
Luis JR, Rowold DJ, Regueiro M, Caeiro B, Cinnioğlu C,
Roseman C, Underhill PA, Cavalli-Sforza LL, Herrera RJ.
2004. The Levant versus the Horn of Africa: evidence for
bidirectional corridors of human migrations. Am J Hum
Genet. 74:532–544.
Malaspina P, Cruciani F, Ciminelli BM, et al. (24 co-authors).
1998. Network analyses of Y-chromosomal types in Europe,
northern Africa, and western Asia reveal specific patterns of
geographic distribution. Am J Hum Genet. 63:847–860.
Malaspina P, Cruciani F, Santolamazza P, et al. (24 co-authors).
2000. Patterns of male-specific inter-population divergence in
Europe, West Asia and North Africa. Ann Hum Genet 64:
395–412.
Marjanovic D, Fornarino S, Montagna S, et al. (14 co-authors).
2005. The peopling of modern Bosnia-Herzegovina: Ychromosome haplogroups in the three main ethnic groups.
Ann Hum Genet. 69:757–763.
Mohyuddin A, Ayub Q, Underhill PA, Tyler-Smith C,
Mehdi SQ. 2006. Detection of novel Y SNPs provides further
insights into Y chromosomal variation in Pakistan. J Hum
Genet. 51:375–378.
Olivieri A, Achilli A, Pala M, et al. (15 co-authors). 2006. The
mtDNA legacy of the Levantine early Upper Palaeolithic in
Africa. Science. 314:1767–1770.
Peričić M, Barać Lauc L, Martinović Klarić I, et al. (18 coauthors). 2005. High-resolution phylogenetic analysis of
southeastern Europe traces major episodes of paternal gene
flow among Slavic populations. Mol Biol Evol. 22:1964–1975.
Piggott S. 1965. Ancient Europe from the beginnings of agriculture
to classical antiquity. Edinburgh, UK: Edinburgh University Press.
Regueiro M, Cadenas AM, Gayden T, Underhill PA, Herrera RJ.
2006. Iran: tricontinental nexus for Y-chromosome driven
migration. Hum Hered. 61:132–143.
Renfrew C. 1979. Before civilization. The radiocarbon revolution
and prehistoric Europe. Cambridge: Cambridge University Press.
Rootsi S, Magri C, Kivisild T, et al. (45 co-authors). 2004.
Phylogeography of Y-chromosome haplogroup I reveals
distinct domains of prehistoric gene flow in Europe. Am J
Hum Genet. 75:128–137.
Saillard J, Forster P, Lynnerup N, Bandelt H-J, Nørby S. 2000.
mtDNA variation among Greenland Eskimos: the edge of the
Beringian expansion. Am J Hum Genet. 67:718–726.
Sanchez JJ, Hallenberg C, Børsting C, Hernandez A, Morling N.
2005. High frequencies of Y chromosome lineages characterized by E3b1, DYS19-11, DYS392-12 in Somali males.
Eur J Hum Genet. 13:856–866.
Scozzari R, Cruciani F, Pangrazio A, et al. (17 co-authors). 2001.
Human Y-chromosome variation in the western Mediterranean area: implications for the peopling of the region. Hum
Immunol. 62:871–884.
Scozzari R, Cruciani F, Santolamazza P, et al. (17 co-authors).
1999. Combined use of biallelic and microsatellite Ychromosome polymorphisms to infer affinities among African
populations. Am J Hum Genet. 65:829–846.
Semino O, Magri C, Benuzzi G, et al. (16 co-authors). 2004.
Origin, diffusion, and differentiation of Y-chromosome
haplogroups E and J: inferences on the neolithization of
Europe and later migratory events in the Mediterranean area.
Am J Hum Genet. 74:1023–1034.
Semino O, Santachiara-Benerecetti AS, Falaschi F, CavalliSforza LL, Underhill PA. 2002. Ethiopians and Khoisan share
the deepest clades of the human Y-chromosome phylogeny.
Am J Hum Genet. 70:265–268.
Sengupta S, Zhivotovsky LA, King R, et al. (15 co-authors).
2006. Polarity and temporality of high-resolution Y-chromosome distributions in India identify both indigenous and
exogenous expansions and reveal minor genetic influence of
central Asian pastoralists. Am J Hum Genet. 78:202–221.
Shen P, Lavi T, Kivisild T, et al. (11 co-authors). 2004.
Reconstruction of patrilineages and matrilineages of Samaritans and other Israeli populations from Y-chromosome and
mitochondrial DNA sequence variation. Hum Mutat.
24:248–260.
Shen P, Wang F, Underhill PA, et al. (13 co-authors). 2000.
Population genetic implications from sequence variation in
four Y chromosome genes. Proc Natl Acad Sci USA.
97:7354–7359.
Sims LM, Garvey D, Ballantyne J. 2007. Sub-populations within
the major European and African derived haplogroups R1b3
and E3a are differentiated by previously phylogenetically
undefined Y-SNPs. Hum Mutat. 28:97.
Taberlet P, Fumagalli L, Wust-Saucy A-G, Cosson J-F. 1998.
Comparative phylogeography and postglacial colonization
routes in Europe. Mol Ecol. 7:453–464.
The Y Chromosome Consortium. 2002. A nomenclature system
for the tree of human Y-chromosomal binary haplogroups.
Genome Res. 12:339–348.
Thomas MG, Skorecki K, Ben-Ami H, Parfitt T, Bradman N,
Goldstein DB. 1998. Origins of Old Testament priests.
Nature. 394:138–140.
Torroni A, Achilli A, Macaulay V, Richards M, Bandelt H-J.
2006. Harvesting the fruit of the human mtDNA tree. Trends
Genet. 22:339–345.
Tringham R. 2000. Southeastern Europe in the transition to
agriculture in Europe: bridge, buffer, or mosaic. In: Price TD,
editor. Europe’s first farmers. Cambridge: Cambridge University Press. p. 19–56.
Underhill PA, Jin L, Lin AA, Mehdi SQ, Jenkins T, Vollrath D,
Davis RW, Cavalli-Sforza LL, Oefner PJ. 1997. Detection of
numerous Y chromosome biallelic polymorphisms by denaturing high-performance liquid chromatography. Genome
Res. 7:996–1005.
Underhill PA, Passarino G, Lin AA, Shen P, Mirazón Lahr M,
Foley RA, Oefner PJ, Cavalli-Sforza LL. 2001. The phylogeography of Y chromosome binary haplotypes and the origins
of modern human populations. Ann Hum Genet. 65:43–62.
Underhill PA, Shen P, Lin AA, et al. (21 co-authors). 2000. Y
chromosome sequence variation and the history of human
populations. Nat Genet. 26:358–361.
Wells RS, Yuldasheva N, Ruzibakiev R, et al. (27 co-authors). 2001.
The Eurasian heartland: a continental perspective on Y-chromosome diversity. Proc Natl Acad Sci USA. 98:10244–10249.
Wilder JA, Kingan SB, Mobasher Z, Pilkington MM,
Hammer MF. 2004. Global patterns of human mitochondrial
DNA and Y-chromosome structure are not influenced by
higher migration rates of females versus males. Nat Genet.
36:1122–1125.
E-M78 and J-M12 Y Haplogroups and Human Migrations 1311
Wood ET, Stover DA, Ehret C, et al. (11 co-authors). 2005.
Contrasting patterns of Y chromosome and mtDNA variation
in Africa: evidence for sex-biased demographic processes. Eur
J Hum Genet. 13:867–876.
Zhivotovsky LA, Underhill PA, Cinnioğlu C, et al. (17 coauthors). 2004. The effective mutation rate at Y chromosome
short tandem repeats, with application to human populationdivergence time. Am J Hum Genet. 74:50–61.
Zhivotovsky LA, Underhill PA, Feldman MW. 2006. Difference
between evolutionarily effective and germ-line mutation rate
due to stochastically varying haplogroup size. Mol Biol Evol.
23:2268–2270.
Sarah Tishkoff, Associate Editor
Accepted March 4, 2007
© Copyright 2026 Paperzz