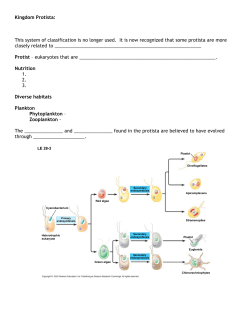
Session: Section: Class Location: Days / Time: Instructor: Biology 110 – Survey of Biology Laboratory Report Summer 2015 67163 4 Units NVC 2030 MTWTh 12:20 PM – 4:20 PM RIDDELL Student Author Name: Anyone Somebody Team Members Name(s): Student Author ID #: 1 2 3 4 5 6 Team Members ID #’(s): Lab Assignment #: 1 Team Name: Lab Assignment Title: Survey of Cell Size Date: 150618 Background / Introduction Cells are microscopic and important part of understanding Biology. Purposes / Objective(s): 1. 2. 3. Learn techniques of microscopy Observe different types of cells Measure cell size Hypothesis: Cells may differ in size by type and species Specimen(s): 1. 2. 3. Cheek Cells from Self Prepared MS Slides A. Onion Root B. Amoeba C. Paramecium D. Euglena Drop of pond Water included several species of microorganisms Materials: 1. 2. 3. 4. MS Slides and Cover Slips Concave MS Slides Methylene Blue Methyl Cellulose Methods / Tools / Instrumentation / Procedures: 1. 2. Light Microscope [Exhibit 1] A. Nikon Eclipse E 200 B. Equipped with 4X, 10X, 40X and 100X Objective Lenses C. All estimates were based on a magnification of 400X On Line Cell Size Calculator [See Exhibit 2] Page 1 of 6 BIO 110 SM 2015 67163 Lab 1 Survey of Cell Size A Somebdy 150618.1 Biology 110 – Survey of Biology Laboratory Report Session: Section: Class Location: Days / Time: Instructor: Summer 2015 67163 4 Units NVC 2030 MTWTh 12:20 PM – 4:20 PM RIDDELL Results: 1. 2. 3. 4. Photography of various cells. Table 1 summarizes Cell Counts and Cell Sizes; Estimates are based on the CS Calculator A. Counts ranged from 1 to 21 B. Cell Size ranged from approx. 2 microns for Euglena to 350 microns for a species of Paramecium Chart 1 shows Cell Counts Chart 2 shows compares Cell Size . Analysis / Discussion: It appears that the CS Calculator shows an indirect relationship between Cell Count and Cell Size This relationship is a result of using the same magnification for all cell count measurements Determining Cell Count at a specific magnification allows an estimate of cell size. The hypothesis is validated. Cells do differ in size based on species. Conclusions / Further Considerations: essay question “so what, now, what?” Page 2 of 6 BIO 110 SM 2015 67163 Lab 1 Survey of Cell Size A Somebdy 150618.1 Session: Section: Class Location: Days / Time: Instructor: Biology 110 – Survey of Biology Laboratory Report Summer 2015 67163 4 Units NVC 2030 MTWTh 12:20 PM – 4:20 PM RIDDELL ATTACHMENTS Results Table 1 Cell Count and Size Specimen Mean Cell Count Mean Microns Cheek Cell 14.4 24.3 White Fish Blastula 19.3 18.1 Onion Root Tip 21.0 16.7 Amoeba 10.0 35.0 Paramecium 1.0 350.0 Euglena 9.0 9.0 Average All Specimens Page 3 of 6 12.46 75.51 BIO 110 SM 2015 67163 Lab 1 Survey of Cell Size A Somebdy 150618.1 Session: Section: Class Location: Days / Time: Instructor: Biology 110 – Survey of Biology Laboratory Report Summer 2015 67163 4 Units NVC 2030 MTWTh 12:20 PM – 4:20 PM RIDDELL Chart 1 Cell Count Mean Cell Count 25.0 20.0 15.0 Mean Cell Count 10.0 5.0 0.0 Cheek Cell White Fish Blastula Onion Root Tip Page 4 of 6 Amoeba Paramecium Euglena Average All Specimens BIO 110 SM 2015 67163 Lab 1 Survey of Cell Size A Somebdy 150618.1 Session: Section: Class Location: Days / Time: Instructor: Biology 110 – Survey of Biology Laboratory Report Summer 2015 67163 4 Units NVC 2030 MTWTh 12:20 PM – 4:20 PM RIDDELL Chart 2 Cell Size Mean Microns 350.0 300.0 250.0 Cheek Cell White Fish Blastula 200.0 Onion Root Tip Amoeba Paramecium 150.0 Euglena Average All Specimens 100.0 50.0 0.0 Cheek Cell White Fish Blastula Onion Root Tip Page 5 of 6 Amoeba Paramecium Euglena Average All Specimens BIO 110 SM 2015 67163 Lab 1 Survey of Cell Size A Somebdy 150618.1 Session: Section: Class Location: Days / Time: Instructor: Biology 110 – Survey of Biology Laboratory Report Summer 2015 67163 4 Units NVC 2030 MTWTh 12:20 PM – 4:20 PM RIDDELL EXHIBITS Exhibit 1 Nikon Microscope Exhibit 2 Online CS Calculator * Estimated Count of specimens as if they were lined up single file, "shoulder to shoulde Calculator for Various Cell / MS Specimen Shapes ` FOV Field of View Check / Set Specimen Size Therefore OCULAR MAG Therefore The Field of View Diameter is Magnification Name your specimens here Therefore OBJECTIVE MAG TOTAL MAG 1,000 Specimen Estimated Count * Pi times radius Put your estimate here squared - How many specimens (S) could be placed "shoulder to shoulder?" in a straight line along the diameter of the FOV? The Specimen Diameter = FOV Area in μm squared FOV / Specimen units in mm 1,000,000 1 Set Ocular and Objective Powers here Count = Cheek Cell 10 4 40 3.50 3500 Cheek Cell 10 10 100 1.40 Cheek Cell 10 40 400 0.35 Cheek Cell 10 100 1000 385.0 AVERAGE For a Specimen with a Round Form Ratio The Field of View Area is FOV FOV Area in FOV Diameter Diameter in mm in μm mm squared Size for Round and Spherica 9.62 9,621,150 1400 1.54 1,539,384 14.4 350 0.10 96,212 14.4 0.14 140 0.02 15,394 1.3 1347.5 2.8 Page 6 of 6 2,818,035 0.069 14.4 0.1 units in microns 1,000 mm μm 0.02 24 0.0 24.3 BIO 110 SM 2015 67163 Lab 1 Survey of Cell Size A Somebdy 150618.1
© Copyright 2026 Paperzz