Annals of Botany 88: 843±849, 2001
doi:10.1006/anbo.2001.1521, available online at http://www.idealibrary.com on
Nuclear DNA C-values Complete Familial Representation in Gymnosperms
I L I A J . L E I TC H *{, LY N D A H A N SO N{, M A R K W I N F I E L D{, JO HN PA R KE R {
and M I C H A E L D. B E N N E T T {
{Jodrell Laboratory, Royal Botanic Gardens, Kew, Richmond, Surrey TW9 3DS, UK and {University Botanic Garden,
Cory Lodge, Bateman Street, Cambridge CB2 1JF, UK
Received: 8 June 2001 Returned for revision: 26 June 2001
Accepted: 7 July 2001
The gymnosperms are a monophyletic yet diverse group of woody trees with approx. 730 extant species in 17 families.
A recent survey showed that DNA C-values were available for approx. 16 % of species, but for only 12 of the 17
families. This paper completes familial representation reporting ®rst C-values for the ®ve remaining families:
Boweniaceae, Stangeriaceae, Welwitschiaceae, Cephalotaxaceae and Sciadopityaceae. C-values for nine Ephedra and
two Gnetum species are also reported. C-values are now available for 152 (21 %) species. Analysis con®rms that
gymnosperms are characterized by larger C-values than angiosperms (modal 1C of gymnosperms 15.8 pg compared
with 0.6 pg in angiosperms) although the range (1C 2.25±32.20 pg) is smaller than that in angiosperms (1C 0.05±
127.4 pg). Given complete familial coverage for C-values and increasing consensus in gymnosperm phylogeny, the
phylogenetic component of C-value variation was also investigated by comparing the two datasets. This analysis
revealed that ancestral gymnosperms (represented by cycads and/or Ginkgo; mean genome size 14.71 pg) probably
# 2001 Annals of Botany Company
had larger genomes than ancestral angiosperms.
Key words: Gymnosperm DNA amounts, C-values, phylogeny, ancestral genome size, Cycadales, Ginkgo, Gnetales,
conifers, Pinaceae.
I N T RO D U C T I O N
The gymnosperms are a diverse group of woody trees that
®rst appeared in the fossil record in the Upper Devonian
(approx. 350 million years ago). Combined molecular and
morphological data have recently indicated that gymnosperms represent a monophyletic clade sister to the
angiosperms with the cycads as the most basal group (e.g.
Qiu et al., 1999; Bowe et al., 2000; Chaw et al., 2000). This
well-supported phylogeny has challenged the more
traditional view that placed Gnetales (Welwitschia, Gnetum
and Ephedra) as sister group to the angiosperms (the
`anthophyte' hypothesis; Donoghue, 1994) and the remaining gymnosperms as paraphyletic. These new insights into
phylogenetic relationships within gymnosperms suggest
that an evaluation of the evolutionary signi®cance of
DNA C-value variation in this group is timely.
Extant gymnosperms comprise approx. 730 species
arranged into 17 families. A survey of DNA C-values by
Murray (1998) revealed that data were available for approx.
16 % of gymnosperm species (i.e. 117 taxa). Thus gymnosperms are much better represented than other groups of
land plants [data are available for approx. 1.4 % of
angiosperms (Bennett et al., 2000a), approx. 0.42 % of
pteridophytes (Bennett and Leitch, 2001), and approx.
0.1 % of bryophytes (Voglmayr, 2000)]. Analysis showed
that gymnosperms have larger genomes than angiosperms
(modal 1C value of gymnosperms 15.8 pg compared
with 0.7 pg in the angiosperms; Leitch et al., 1998),
* For correspondence: Fax 44(0)20 8332 5310, e-mail i.leitch@
rbgkew.org.uk
0305-7364/01/110843+07 $35.00/00
although the overall range of C-values of approx. 14-fold
(1C 2.25±31.75 pg) was noted to be smaller than the
approx. 1000-fold range that has been reported in angiosperms (Bennett et al., 2000a, b).
Despite good species representation of C-values, Murray
(1998) noted that C-values were available for only 12 of the
17 gymnosperm families and that the Gnetales (comprising
the Gnetaceae, Welwitschiaceae and Ephedraceae) were a
group `where more measurements of genome size are
needed if any meaningful phylogenetic relationship in
genome size is to be revealed'. To address this need and
to complete phylogenetic coverage of the gymnosperm
families, this paper provides C-value data for the ®ve
hitherto unrepresented families and also adds further
C-value data for species in the Gnetales.
M AT E R I A L S A N D M E T H O D S
Plant material
Table 1 lists the 15 species of gymnosperms studied in the
present work. Material was obtained either from the Living
Collections Department at the Royal Botanic Gardens,
Kew, UK (RBG, Kew), or the University Botanic Garden,
Cambridge, UK (source indicated in Table 1). When cones
are produced vouchers will be prepared and deposited in
the Herbarium of RBG Kew (KEW).
Estimation of nuclear DNA C-values
DNA C-values were estimated using Feulgen microdensitometry except those for Gnetum costatum and G. gnemon.
# 2001 Annals of Botany Company
Sciadopitys verticillata (Thun.) Sieb. & Zucc.
Cephalotaxus harringtonii K.Koch var. nana
Ephedra americana Hunb. & Bonpl. ssp. andina
Ephedra americana Hunb. & Bonpl.
Ephedra distachya ssp. helvetica
Ephedra fragilis Desf. ssp. fragilis
Ephedra fragilis Desf. ssp. fragilis
Ephedra gerardiana Wall. ex Stapf.
Ephedra likiangensis Florin
Ephedra monosperma C.C. Gmel. ex C.A.Mey.
Ephedra viridis Coville
Gnetum costatum K.Schum
Gnetum gnemon L.
Welwitschia mirabilis Hook. f
Bowenia serrulata Chamberlain
Stangeria eriopus (Kunze) Nash
Coniferales
1
2
Gnetales
3
4
5
6a
6b
7
8
9
10
11
12
13
Cycadales
14
15
Boweniaceae
Stangeriaceae
Ephedraceae
Ephedraceae
Ephedraceae
Ephedraceae
Ephedraceae
Ephedraceae
Ephedraceae
Ephedraceae
Ephedraceae
Gnetaceae
Gnetaceae
Welwitschiaceae
Sciadopityaceae
Cephalotaxaceae
Family
1995±2359
1995±2092
575±97 CAMB
1998±503
425.97 CAMB
1998±504
941/97 CAMB
1998±505
1998±500
1998±499
1998±498
1964±47701
1998±514
1997±5119
2000±3565
1996±4743
18*
16*
28
28
28
28
28
28
28
28
28
44*
44*
42*
20*
24*
2nb
2
2
4
4
4
4
4
4
4
4
4
2
2
2
2
2
Ploidy level
(x)
12520
14524
17853
17140
18088
16667
18044
15621
14867
15719
15656
3940
3822
7056
17192
22168
1C (Mbp)c
12.78
14.82
18.22
17.49
18.46
17.01
18.41
15.94
15.17
16.04
15.98
4.02
3.90
7.20
17.54
22.62
1C ( pg)
25.55
29.64
36.44
34.98
36.92
34.02
36.83
31.88
30.34
32.08
31.95
8.04
7.79
14.40
35.09
45.24
2C ( pg)
DNA amount
51.10 + 2.10
59.28 + 10.40e
72.87 + 2.10
69.96 + 4.00e
73.83 + 2.35
68.03 + 3.22
73.65 + 2.65
63.75 + 3.16
60.69 + 2.92
64.16 + 2.74
63.90 + 3.19
16.07 + 0.45
15.58 + 1.06
28.80 + 1.76
70.17 + 2.54
90.48 + 2.59
4C + s.d.d ( pg)
b
Accession numbers followed by CAMB indicate material obtained from the University Botanic Garden, Cambridge. All other material was from the RBG Kew.
Chromosome numbers followed by * are taken from the literature.
c 1 pg 980 Mb (Cavalier-Smith, 1985).
d DNA content and standard deviation were calculated from measurements of 30 cells unless otherwise stated.
e The large standard deviations in these species were due to diculties in preparing the material such that only 17 (Stangeria) or 20 (Ephedra) cells could be found that were suitable for
measuring.
a
Taxon
Entry no.
Accession
numbera
T A B L E 1. Accession number, chromosome number (2n), ploidy level (x) and nuclear DNA amount for 15 gymnosperm species in ®ve previously unrepresented families
844
Leitch et al.ÐNuclear DNA Amounts in Gymnosperms
Leitch et al.ÐNuclear DNA Amounts in Gymnosperms
Root tips from the test species and the calibration standard
Allium cepa `Ailsa Craig' (4C 67.00 pg) were ®xed in 4 %
formaldehyde in SoÈrensens buer pH 7.0 and stored in
96 % ethanol as outlined in RoÈser et al. (1997). Feulgen
microdensitometry was carried out as described in Hanson
et al. (2001) and measurements were made using a Vickers
M85a microdensitometer.
For the two Gnetum species, ¯ow cytometry was used to
estimate DNA C-values. Leaf tissue from Gnetum and the
calibration standard Pisum sativum `Minerva Maple'
(4C 19.46 pg) was prepared and stained with propidium
iodide (PI), as described in Obermayer and Greilhuber
(1999). Samples were analysed on a Partec PA II ¯ow
cytometer, using distilled water as the sheath ¯uid, a 100 W
high-pressure mercury lamp, a quartz air objective
(50 0.82 N.A.) and a high-quality red sensitive photomultiplier. The ®lter combination used was KG1, BG38,
FM, EM520, TK560 (to/from objective), FM, 2 3
(diaphragm), TK560 and RG. For each Gnetum species
analysed, six preparations of unknown and standard
material were made and each preparation was analysed at
least three times, with 5000 nuclei per run.
Chromosome counts
Chromosome counts of Ephedra species were made to
determine the ploidy level of the material studied. Root tips
were prepared using a standard Feulgen-stained squash
technique as described in Hanson et al. (2001). Roots were
pretreated using a-bromonapthalene for 24 h at 4 8C prior
to ®xation, and hydrolysed in 1 M HCl at 60 8C for 8 min
before staining.
C-value data from other sources
To interpret C-value data for the 15 species estimated in
this work in the context of C-values known for other
gymnosperms, the data were pooled with C-values for 137
other species [115 species collated by Murray (1998), 21
Pinus species published in Hall et al. (2000) and Joyner et
al. (2001), and Wollemia nobilis by Hanson (2001)] to give
DNA amounts for a total of 152 species (see Murray et al.,
2001). [NB Where more than one C-value for a species was
listed by Murray (1998), one was identi®ed as the `preferred
estimate' and was assigned as the `a' value. The `a' values in
Murray (1998) were taken for the present analysis. C-values
for Pinus aurescens and P. koraiensis listed by Murray were
excluded from the present analysis as they were considered
to be unreliable (Murray, 1998)].
R E S U LT S A N D D I S C U S S I O N
Table 1 gives DNA amounts for the 15 dierent gymnosperm species studied. The data were combined with
previously published C-values for 137 gymnosperm species,
thus C-values for 152 species corresponding to 21 % of all
gymnosperm species are now available. The combined data
are summarized in Table 2 and are compared with
equivalent data for angiosperms. C-values estimated in
the present work ranged from 1C 3.90 pg in Gnetum
845
T A B L E 2. Comparison of nuclear DNA C-value data for 152
gymnosperm species and 3493 angiosperm species listed in
the Angiosperm DNA C-values database (Bennett et al.,
2000b)
Number in sample
Mean ( pg)
Standard deviation
Median ( pg)
Mode ( pg)
Minimum ( pg)
Maximum ( pg)
Gymnosperms
Angiosperms
152
17.56
7.02
17.37
15.80
2.25
32.20
3493
6.32
9.81
2.90
0.60
0.05
127.40
gnemon to 22.62 pg in Cephalotaxus harringtonii var. nana
and thus fall within the approx. 14-fold range of known
gymnosperm C-values, from 2.25 pg for Gnetum ula to
32.20 pg in Pinus nelsonii.
Analysis of the new data
Analysis of molecular and other data (Bowe et al., 2000;
Chaw et al., 2000) shows that gymnosperms are divided into
®ve dierent groups: (1) Cycadales (cycads); (2) Ginkgoales;
(3) Gnetales; (4) Pinaceae; and (5) Coniferales II (comprising all conifer families except Pinaceae). Families whose
C-values were estimated in the present work fall into three of
these groups: Gnetales, Cycadales and Coniferales II.
Cycadales. The ®rst C-values estimated for the two
Cycadales families Boweniaceae (Bowenia serrulata,
1C 12.78 pg) and Stangeriaceae (Stangeria eriopus,
1C 14.82 pg) fall within the range reported for the two
other Cycadales families (Cycadaceae and Zamiaceae:
12.05±21.10 pg).
Gnetales. The Gnetales comprise three families:
Gnetaceae, Welwitschiaceae and Ephedraceae. Previously,
C-values were known for only two species in this group:
Gnetum ula (Gnetaceae, 1C 2.25 pg) and diploid Ephedra
tweediana (Ephedraceae, 1C 8.90 pg). This paper reports
®rst C-values for a further 12 species, namely two Gnetum
species (G. costatum, 1C 4.02 pg and G. gnemon,
1C 3.90 pg),
nine
tetraploid
Ephedra
species
(1C 15.17±18.46 pg), and Welwitschia mirabilis, the
only species in Welwitschiaceae (1C 7.20 pg). The range
of C-values known for Gnetales has thus increased to 2.25±
18.46 pg.
Coniferales II. Prior to the current work, C-values for six
of the eight families that comprise Coniferales II (see
Table 3) ranged from 6.50 to 20.00 pg. The ®rst C-value for
Sciadopityaceae (Sciadopitys verticillata, 1C 17.54 pg)
falls within this range. By contrast, the ®rst C-value for
Cephalotaxaceae (Cephalotaxus harringtonii var. nana,
1C 22.62 pg) is larger than the 1C value of 20.00 pg for
Libocedrus plumosa in Cupressaceae. Thus the range for
Coniferales II (now 6.50±22.62 pg) is increased.
846
Leitch et al.ÐNuclear DNA Amounts in Gymnosperms
T A B L E 3. Mean, minimum (min.), maximum (max.) and ratio of 1C nuclear DNA amounts for the ®ve groups and all 17
families of gymnosperms for which C-value data are available, together with % of species in each family or higher group with
C-value data
Higher group
Family
Cycadales
All families
Boweniaceae
Cycadaceae
Stangeriaceae
Zamiaceae
No species with
C-values
No species in
family/group
%
Representation
6
1
2
1
2
145
2
17
1
125
4
50
12
100
2
1C nuclear DNA amount ( pg)
Mean
Min.
Max.
Ratio
(max./min.)
14.71
12.78
13.75
14.82
16.58
12.05
12.78
12.75
14.82
12.05
21.10
12.78
14.75
14.82
21.10
1.8
1.0
1.2
1.0
1.8
Ginkgoales
Ginkgoaceae
1
1
100
9.95
9.95
9.95
1.0
Gnetales
All families
Ephedraceae
Gnetaceae
Welwitschiaceae
13
9
3
1
125
65
29
1
14
14
10
100
12.44
16.04
3.38
7.20
2.25
8.90
2.25
7.20
18.46
18.46
4.02
7.20
8.2
2.1
1.8
1.0
Pinaceae
Pinaceae
83
220
38
22.02
5.75
32.20
5.6
13
15
10
15
60
10
100
6
19
11.89
12.20
22.62
12.53
10.80
10.70
17.54
11.05
9.60
6.50
9.55
22.62
8.25
9.95
6.60
17.54
11.05
6.50
22.62
15.80
22.62
20.00
11.40
18.10
17.54
11.05
13.55
3.5
1.7
1.0
2.4
1.1
2.7
1.0
1.0
2.1
Coniferales II
All families
Araucariaceae
Cephalotaxaceae
Cupressaceae
Phyllocladaceae
Podocarpaceae
Sciadopityaceae
Taxaceae
Taxodiaceae
49
5
1
19
3
16
1
1
3
375
34
10
125
5
168
1
16
16
Number of species in each family taken from Mabberley (1997).
Analysis of C-values and genome sizes in dierent
gymnosperm groups
Combining these new data with previously published
C-values enables the mean, minimum, maximum and ratio
of C-values for each of the ®ve groups and 17 families to be
summarized (Table 3). A comparison of C-values in each of
the ®ve groups of gymnosperms shows that the minimum,
maximum and range of C-values dier considerably
between the dierent groups, with Gnetales being the most
variable. However, Gnetales is the only group examined to
date that contains polyploid species; the remaining 144
gymnosperms with known C-values have all been recorded
as diploid (see Murray, 1998; Hanson, 2001). Polyploidy in
gymnosperms is rare in all but Ephedraceae where approx.
40 % of species were estimated to be polyploid (Delevoryas,
1980). The ploidy level of the two other genera in Gnetales is
unclear. Both Gnetum and Welwitschia have high chromosome numbers relative to the majority of gymnosperms
(2n 44 and 42, respectively) but have been considered as
diploids by Khooshoo (1961) and in the present work
(Table 1). Interestingly, if a comparison is made of genome
size rather than C-value (by dividing the 2C-value by ploidy
level) then all members of Gnetales whose C-values have
been estimated are characterized by small genomes
(mean 7.23 pg) compared with the four other gymnosperm groups (Cycadales mean 14.71 pg; Ginkgoales 9.95 pg; Pinaceae mean 22.02 pg; Coniferales II
mean 11.89 pg). The Pinaceae now become the most
variable gymnosperm group in terms of genome size. (NB If
the ploidy level of Gnetum and Welwitschia is greater than
two then this would only strengthen the observation since
the range and mean of genome size in this group would be
reduced.)
Analysis of C-values in dierent gymnosperm families
With C-value data for all 17 gymnosperm families now
available, the mean, minimum, maximum and ratio of
C-values for each family can also be summarized (Table 3).
The most variable family is Pinaceae with a 5.6-fold range in
C-values, followed by Podocarpaceae (2.7-fold), Cupressaceae (2.4-fold) and Ephedraceae and Taxodiaceae (both 2.1fold). If, as above, genome sizes rather than 1C values are
compared, the Ephedraceae show only a 1.2-fold range and
become one of the least variable families with two or more
1C-value estimates (Fig. 1). Obviously more data are needed
to determine the full range of C-values in families with more
than one species. However, even in families in which
C-values are known for a good percentage of the species
(see Table 3), the range of C-values is considerably smaller
than that encountered in some angiosperm families (e.g. in
the Poaceae the range is 103.9-fold and in the Fabaceae 73.1fold; Leitch et al., 1998). As more data accumulate it will be
interesting to see if the relatively narrow range of C-values
noted so far in gymnosperm families is typical. However, the
constancy of chromosome number and structure found in
most gymnosperm families (e.g. Khoshoo, 1961; Murray,
1998) suggests that large variation in C-values, as found in
some angiosperm families, is unlikely.
Leitch et al.ÐNuclear DNA Amounts in Gymnosperms
12.53 (8.25 - 20.00)
Cupressaceae (19)
9.60 (6.50 - 13.55)
Taxodiaceae (3)
22.62
Cephalotaxaceae (1)
CII
11.05
Taxaceae (1)
17.54
Sciadopityaceae (1)
12.20 (9.55 - 15.80)
Araucariaceae (5)
10.70 (6.60 - 18.10)
Podocarpaceae (16)
10.80 (9.95 - 11.40)
Phyllocladaceae (3)
P
22.02 (5.75 - 32.20)
Pinaceae (83)
8.51 (7.59 - 9.21)
Ephedraceae (9)
Gn
7.20
Welwitschiaceae (1)
3.38 (2.25 - 4.02)
Gnetaceae (3)
Gi
9.95
Ginkgoaceae (1)
13.75 (12.75 - 14.75)
Cycadaceae (2)
16.58 (12.05 - 21.10)
Zamiaceae (2)
Cy
847
14.82
Strangeriaceae (1)
12.78
Boweniaceae (1)
0
5
10
15
20
25
30
35
Unreplicated genome size (pg)
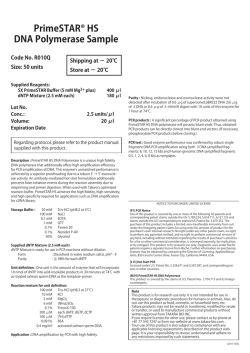
F I G . 1. Comparison of the mean and range (in parentheses) of genome sizes in all 17 gymnosperm families. Families are arranged into their higher
groups but within each group there is no phylogenetic order. Higher groups are indicated by the following abbreviations: Cy, Cycadales; Gi,
Ginkgoales; Gn, Gnetales; P, Pinaceae; and CII, Coniferales II. The number in parentheses following the family name gives the number of species
for which genome size data are available.
Phylogenetic signi®cance of DNA C-values in higher groups
of gymnosperms
It now seems clear that gymnosperms are a monophyletic
group (e.g. Qiu et al., 1999; Bowe et al., 2000; Chaw et al.,
2000). The exact evolutionary relationships between the
dierent gymnosperm families remain controversial but
recent molecular sequence data are increasingly resolving
these controversies. Combined molecular analysis of
mitochondrial, nuclear and chloroplast gene sequences by
Chaw et al. (2000) identi®ed cycads as the most basal group
of gymnosperms. Ginkgo was the next most-basal group
and sister to the remaining three groups (Pinaceae, Gnetales
and Coniferales II), and Coniferales II was sister to a
Gnetales Pinaceae clade. Bowe et al. (2000) reported
similar ®ndings despite sampling dierent taxa and genic
regions and using dierent methods of analysis.
Evaluating the phylogenetic component of genome size
variation encountered in the gymnosperms is essential for a
full understanding of its evolutionary signi®cance. Leitch
et al. (1998) superimposed angiosperm DNA C-values onto
a robust phylogenetic tree and concluded that the ancestral
angiosperms almost certainly had small genomes
(43.5 pg). In a similar way, superimposing the C-value
data for each of the ®ve groups of gymnosperms (Table 3,
Fig. 2) onto the gymnosperm phylogeny suggests that
ancestral gymnosperms (represented by cycads with a
848
Leitch et al.ÐNuclear DNA Amounts in Gymnosperms
11.89 (6.50 - 22.62)
Coniferales II (49)
22.02 (5.75 - 32.20)
Pinaceae (83)
7.23 (2.25 - 9.20)
Gnetales (13)
9.95
Ginkgoales (1)
14.71 (12.05 - 21.10)
Cycadales (6)
0
5
10
15
20
25
30
35
Unreplicated genome size (pg)
F I G . 2. Gymnosperm phylogeny (left-hand side, based on Bowe et al., 2000 and Chaw et al., 2000) and genome size data (right-hand side)
showing the mean followed by the range of genome size values encountered in each of the ®ve orders of gymnosperms. The number in parentheses
following the higher order group name is the number of species for which genome size data are available.
mean 1C 14.71 pg) were probably characterized by larger
C-values than ancestral angiosperms. More sampling,
particularly in the six remaining genera of Cycadales,
would help con®rm or refute this hypothesis, although
cytological analysis has already shown that many cycads
possess large chromosomes (e.g. Sax and Beal, 1934;
Marchant, 1968) and hence (by inference) large genomes.
The recent proposal that Gnetales arose from within the
conifers (`gnepines hypothesis') and perhaps even within
the Pinaceae (Bowe et al., 2000; Chaw et al., 2000) has
necessitated a major reinterpretation of the evolution of
conifers and Gnetales and the characters which de®ne these
groups. The extensive morphological divergence of Gnetales from the rest of the conifers (e.g. loss of narrowly
triangular, one-veined leaves, resin canals, and woody
ovuliferous cone scales) has been paralleled, perhaps coincidentally, by generally high rates of molecular evolution
(Bowe et al., 2000). If large genomes were ancestral in
gymnosperms, it seems likely that this morphological and
molecular evolution was accompanied by a reduction in
genome size, so the small Gnetales genomes are, most
probably, secondarily derived.
Both the above hypotheses (i.e. that ancestral genomes in
gymnosperms were large compared with those of angiosperms and that the small genomes in Gnetales were
secondarily derived) are based on the assumption that since
the gymnosperms ®rst evolved approx. 350 million years
ago there has been no further extensive evolution of genome
size. To accept or reject this requires knowledge of C-values
in the ancestral seed plants, although there are formidable
problems to be overcome before this assumption can be
con®rmed or refuted. For example, the recent combined
analysis of morphological and DNA sequence data for
representatives of all the main lineages of land plants shows
unambiguously that horsetails (Equisetum sp.) and ferns are
the closest extant relatives to seed plants (Pryer et al., 2001).
However, there is a lack of phylogenetic consensus within
the fern/horsetail clade. Since the 1C DNA amount data for
ferns and horsetails varies 165-fold from 0.44 to 72.67 pg
(Grime et al., 1988; Bennett and Leitch, 2001; Obermayer
et al. pers. comm.) and the ancestral groups within this
clade are unclear, inferences about the ancestral genome
size in this extant sister group are currently impossible.
There is a further problem in that the progymnosperms,
which are widely accepted as containing the ancestral group
of seed plants (Hilton, 1998), are now extinct so no direct
measurements of DNA amount can be made. One possible
solution to this is to examine fossil progymnosperms
(especially the Aneurophytalean group which is considered
to be the most likely to contain the ancestral seed plants) and
identify key cells (e.g. stomatal guard cells that do not
exhibit endopolyploidy) that can be used to track changes in
genome size based on the assumption that cell size is
correlated with DNA content. Such an approach has been
used in both plants and animals. In plants, Masterson
(1994) tracked changes in DNA amount in fossil angiosperms over 100 million years to look for evidence of
polyploidy. In animals, Conway Morris and Harper (1988)
used this approach to identify changes in genome size in
conodonts (Chordata) over 270 million years, and Thomson
(1972) examined changes in genome size in fossil lung®sh
over 400 million years. If such an approach is successful, the
results will shed light not only on the evolution of genome
size within the gymnosperms but within the spermatophytes
as a whole, and will perhaps provide insights into the origin
of the clear dierences in genome size observed between
angiosperms and gymnosperms.
L I T E R AT U R E C I T E D
Bennett MD, Leitch IJ. 2001. Nuclear DNA amounts in Pteridophytes.
Annals of Botany 87: 335±345.
Bennett MD, Bhandol P, Leitch IJ. 2000a. Nuclear DNA amounts in
angiosperms and their modern usesÐ807 new estimates. Annals of
Botany 86: 859±909.
Bennett MD, Cox AV, Leitch IJ. 2000b. Angiosperm DNA C-values
database. http://www.rbgkew.org.uk/cval/database1.html.
Leitch et al.ÐNuclear DNA Amounts in Gymnosperms
Bowe LM, Coat G, de Pamphilis CW. 2000. Phylogeny of seed plants
based on all three genomic compartments: Extant gymnosperms
are monophyletic and Gnetales' closest relatives are conifers.
Proceedings of the National Academy of Sciences of the USA 97:
4092±4097.
Cavalier-Smith T. 1985. The evolution of genome size. Chichester: John
Wiley and Sons.
Chaw S-M, Parkinson CL, Cheng Y, Vincent TM, Palmer JD. 2000.
Seed plant phylogeny inferred from all three plant genomes:
Monophyly of extant gymnosperms and origin of Gnetales from
conifers. Proceedings of the National Academy of Sciences of the
USA 97: 4086±4091.
Conway Morris S, Harper E. 1988. Genome size in Conodonts
(Chordata): inferred variation during 270 million years. Science
241: 1230±1232.
Delevoryas T. 1980. Polyploidy in gymnosperms. In: Lewis WH, ed.
Polyploidy: biological relevance. New York: Plenum Press,
215±218.
Donoghue MJ. 1994. Progress and prospects in reconstructing plant
phylogeny. Annals of the Missouri Botanical Garden 81: 405±418.
Grime JP, Hodgson JG, Hunt R. 1988. Comparative plant ecology.
London: Unwin Hyman Ltd.
Hall SE, Dvorak WS, Johnston JS, Price HJ, Williams CG. 2000. Flow
cytometric analysis of DNA content for tropical and temperate
New World pines. Annals of Botany 86: 1081±1086.
Hanson L. 2001. Chromosome number, karyotype and DNA C-value
of the Wollemi Pine (Wollemia nobilis, Araucariaceae). Botanical
Journal of the Linnean Society 135: 271±274.
Hanson L, McMahon KA, Johnson MAT, Bennett MD. 2001. First
nuclear DNA C-values in 25 angiosperm families. Annals of
Botany 87: 251±258.
Hilton J. 1998. Review of fossil evidence for the origin and earliest
evolution of the seed-plants. Acta Botanic Sinica 40: 981±987.
Joyner KL, Wang X-R, Johnston JS, Price HJ, Williams CG. 2001.
DNA content for Asian pines parallels New World relatives.
Canadian Journal of Botany 79: 192±196.
849
Khoshoo TN. 1961. Chromosome numbers in gymnosperms. Silvae
Genetica 10: 1±39.
Leitch IJ, Chase MW, Bennett MD. 1998. Phylogenetic analysis of
DNA C-values provides evidence for a small ancestral genome size
in ¯owering plants. Annals of Botany 82(Supplement A): 85±94.
Mabberley DJ. 1997. The plant-book. Cambridge: Cambridge
University Press.
Marchant CJ. 1968. Chromosome patterns and nuclear phenomena in
the cycad families Stangeriaceae and Zamiaceae. Chromosoma 24:
100±134.
Masterson J. 1994. Stomatal size in fossil plants: evidence for
polyploidy in majority of angiosperms. Science 264: 421±424.
Murray BG. 1998. Nuclear DNA amounts in gymnosperms. Annals of
Botany 82(Supplement A): 3±15.
Murray BG, Leitch IJ, Bennett MD. 2001. Gymnosperm DNA Cvalues database. http://www.rbgkew.org.uk/cval/homepage.html.
Obermayer R, Greilhuber J. 1999. Genome size in Chinese soybean
accessionsÐstable or variable?. Annals of Botany 84: 259±262.
Pryer KM, Schneider H, Smith AR, Cran®ll R, Wolf PG, Hunt JS,
Sipes SD. 2001. Horsetails and ferns are a monophyletic group
and the closest relatives to seed plants. Nature 409: 618±622.
Qiu Y-L, Lee J, Bernasconi-Quadroni F, Soltis DE, Soltis PS, Zanis M,
Zimmer EA, Chen Z, Savolainen V, Chase MW. 1999. The earliest
angiosperms: evidence from mitochondrial, plastid and nuclear
genomes. Nature 402: 404±407.
RoÈser M, Johnson MAT, Hanson L. 1997. Nuclear DNA amounts in
palms (Arecaceae). Botanica Acta 110: 79±89.
Sax K, Beal JM. 1934. Chromosomes of the Cycadales. Journal of the
Arnold Arboretum 15: 255±258.
Thomson KS. 1972. An attempt to reconstruct evolutionary changes in
the cellular DNA content of lung®sh. Journal of Experimental
Biology 180: 363±372.
Voglmayr H. 2000. Nuclear DNA amounts in mosses (Musci). Annals
of Botany 85: 531±546.
© Copyright 2026 Paperzz