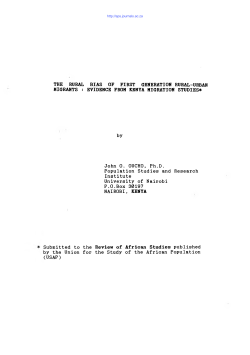
Isiolo County
Exploring Kenya’s Inequality
Published by
Kenya National Bureau of Statistics
Society for International Development – East Africa
P.O. Box 30266-00100 Nairobi, Kenya
P.O. Box 2404-00100 Nairobi, Kenya
Email: [email protected] Website: www.knbs.or.ke
Email: [email protected] | Website: www.sidint.net
© 2013 Kenya National Bureau of Statistics (KNBS) and Society for International Development (SID)
ISBN – 978 - 9966 - 029 - 18 - 8
With funding from DANIDA through Drivers of Accountability Programme
The publication, however, remains the sole responsibility of the Kenya National Bureau of Statistics (KNBS) and the Society
for International Development (SID).
Written by:Eston Ngugi
Data and tables generation:Samuel Kipruto
Paul Samoei
Maps generation:George Matheka Kamula
Technical Input and Editing:Katindi Sivi-Njonjo
Jason Lakin
Copy Editing:Ali Nadim Zaidi
Leonard Wanyama
Design, Print and Publishing:
Ascent Limited
All rights reserved. No part of this publication may be reproduced, stored in a retrieval system or transmitted in any form, or
by any means electronic, mechanical, photocopying, recording or otherwise, without the prior express and written permission
of the publishers. Any part of this publication may be freely reviewed or quoted provided the source is duly acknowledged. It
may not be sold or used for commercial purposes or for profit.
ii
A PUBLICATION OF KNBS AND SID
Pulling Apart or Pooling Together?
Table of contents
Table of contentsiii
Forewordiv
Acknowledgementsv
Striking features on inter-county inequalities in Kenya
vi
List of Figuresviii
List Annex Tablesix
Abbreviationsxi
Introduction2
Isiolo County9
iii
Exploring Kenya’s Inequality
Foreword
Kenya, like all African countries, focused on poverty alleviation at independence, perhaps due to the level of
vulnerability of its populations but also as a result of the ‘trickle down’ economic discourses of the time, which
assumed that poverty rather than distribution mattered – in other words, that it was only necessary to concentrate
on economic growth because, as the country grew richer, this wealth would trickle down to benefit the poorest
sections of society. Inequality therefore had a very low profile in political, policy and scholarly discourses. In
recent years though, social dimensions such as levels of access to education, clean water and sanitation are
important in assessing people’s quality of life. Being deprived of these essential services deepens poverty and
reduces people’s well-being. Stark differences in accessing these essential services among different groups
make it difficult to reduce poverty even when economies are growing. According to the Economist (June 1, 2013),
a 1% increase in incomes in the most unequal countries produces a mere 0.6 percent reduction in poverty. In the
most equal countries, the same 1% growth yields a 4.3% reduction in poverty. Poverty and inequality are thus part
of the same problem, and there is a strong case to be made for both economic growth and redistributive policies.
From this perspective, Kenya’s quest in vision 2030 to grow by 10% per annum must also ensure that inequality
is reduced along the way and all people benefit equitably from development initiatives and resources allocated.
Since 2004, the Society for International Development (SID) and Kenya National Bureau of Statistics (KNBS) have
collaborated to spearhead inequality research in Kenya. Through their initial publications such as ‘Pulling Apart:
Facts and Figures on Inequality in Kenya,’ which sought to present simple facts about various manifestations
of inequality in Kenya, the understanding of Kenyans of the subject was deepened and a national debate on
the dynamics, causes and possible responses started. The report ‘Geographic Dimensions of Well-Being in
Kenya: Who and Where are the Poor?’ elevated the poverty and inequality discourse further while the publication
‘Readings on Inequality in Kenya: Sectoral Dynamics and Perspectives’ presented the causality, dynamics and
other technical aspects of inequality.
KNBS and SID in this publication go further to present monetary measures of inequality such as expenditure
patterns of groups and non-money metric measures of inequality in important livelihood parameters like
employment, education, energy, housing, water and sanitation to show the levels of vulnerability and patterns of
unequal access to essential social services at the national, county, constituency and ward levels.
We envisage that this work will be particularly helpful to county leaders who are tasked with the responsibility
of ensuring equitable social and economic development while addressing the needs of marginalized groups
and regions. We also hope that it will help in informing public engagement with the devolution process and
be instrumental in formulating strategies and actions to overcome exclusion of groups or individuals from the
benefits of growth and development in Kenya.
It is therefore our great pleasure to present ‘Exploring Kenya’s inequality: Pulling apart or pooling together?’
Ali Hersi
Society for International Development (SID)
Regional Director
iv
A PUBLICATION OF KNBS AND SID
Pulling Apart or Pooling Together?
Acknowledgements
Kenya National Bureau of Statistics (KNBS) and Society for International Development (SID) are grateful
to all the individuals directly involved in the publication of ‘Exploring Kenya’s Inequality: Pulling Apart or
Pulling Together?’ books. Special mention goes to Zachary Mwangi (KNBS, Ag. Director General) and
Ali Hersi (SID, Regional Director) for their institutional leadership; Katindi Sivi-Njonjo (SID, Progrmme
Director) and Paul Samoei (KNBS) for the effective management of the project; Eston Ngugi; Tabitha
Wambui Mwangi; Joshua Musyimi; Samuel Kipruto; George Kamula; Jason Lakin; Ali Zaidi; Leonard
Wanyama; and Irene Omari for the different roles played in the completion of these publications.
KNBS and SID would like to thank Bernadette Wanjala (KIPPRA), Mwende Mwendwa (KIPPRA), Raphael
Munavu (CRA), Moses Sichei (CRA), Calvin Muga (TISA), Chrispine Oduor (IEA), John T. Mukui, Awuor
Ponge (IPAR, Kenya), Othieno Nyanjom, Mary Muyonga (SID), Prof. John Oucho (AMADPOC), Ms. Ada
Mwangola (Vision 2030 Secretariat), Kilian Nyambu (NCIC), Charles Warria (DAP), Wanjiru Gikonyo
(TISA) and Martin Napisa (NTA), for attending the peer review meetings held on 3rd October 2012 and
Thursday, 28th Feb 2013 and for making invaluable comments that went into the initial production and
the finalisation of the books. Special mention goes to Arthur Muliro, Wambui Gathathi, Con Omore,
Andiwo Obondoh, Peter Gunja, Calleb Okoyo, Dennis Mutabazi, Leah Thuku, Jackson Kitololo, Yvonne
Omwodo and Maureen Bwisa for their institutional support and administrative assistance throughout the
project. The support of DANIDA through the Drivers of Accountability Project in Kenya is also gratefully
acknowledged.
Stefano Prato
Managing Director,
SID
v
Exploring Kenya’s Inequality
Striking Features on Intra-County Inequality
in Kenya
Inequalities within counties in all the variables are extreme. In many cases, Kenyans living within a
single county have completely different lifestyles and access to services.
Income/expenditure inequalities
1. The five counties with the worst income inequality (measured as a ratio of the top to the bottom
decile) are in Coast. The ratio of expenditure by the wealthiest to the poorest is 20 to one and above
in Lamu, Tana River, Kwale, and Kilifi. This means that those in the top decile have 20 times as much
expenditure as those in the bottom decile. This is compared to an average for the whole country of
nine to one.
2. Another way to look at income inequality is to compare the mean expenditure per adult across
wards within a county. In 44 of the 47 counties, the mean expenditure in the poorest wards is less
than 40 percent the mean expenditure in the wealthiest wards within the county. In both Kilifi and
Kwale, the mean expenditure in the poorest wards (Garashi and Ndavaya, respectively) is less than
13 percent of expenditure in the wealthiest ward in the county.
3. Of the five poorest counties in terms of mean expenditure, four are in the North (Mandera, Wajir,
Turkana and Marsabit) and the last is in Coast (Tana River). However, of the five most unequal
counties, only one (Marsabit County) is in the North (looking at ratio of mean expenditure in richest
to poorest ward). The other four most unequal counties by this measure are: Kilifi, Kwale, Kajiado
and Kitui.
4. If we look at Gini coefficients for the whole county, the most unequal counties are also in Coast:
Tana River (.631), Kwale (.604), and Kilifi (.570).
5. The most equal counties by income measure (ratio of top decile to bottom) are: Narok, West Pokot,
Bomet, Nandi and Nairobi. Using the ratio of average income in top to bottom ward, the five most
equal counties are: Kirinyaga, Samburu, Siaya, Nyandarua, Narok.
Access to Education
6. Major urban areas in Kenya have high education levels but very large disparities. Mombasa, Nairobi
and Kisumu all have gaps between highest and lowest wards of nearly 50 percentage points in
share of residents with secondary school education or higher levels.
7. In the 5 most rural counties (Baringo, Siaya, Pokot, Narok and Tharaka Nithi), education levels
are lower but the gap, while still large, is somewhat lower than that espoused in urban areas. On
average, the gap in these 5 counties between wards with highest share of residents with secondary
school or higher and those with the lowest share is about 26 percentage points.
8. The most extreme difference in secondary school education and above is in Kajiado County where
the top ward (Ongata Rongai) has nearly 59 percent of the population with secondary education
plus, while the bottom ward (Mosiro) has only 2 percent.
9. One way to think about inequality in education is to compare the number of people with no education
vi
A PUBLICATION OF KNBS AND SID
Pulling Apart or Pooling Together?
to those with some education. A more unequal county is one that has large numbers of both. Isiolo
is the most unequal county in Kenya by this measure, with 51 percent of the population having
no education, and 49 percent with some. This is followed by West Pokot at 55 percent with no
education and 45 percent with some, and Tana River at 56 percent with no education and 44 with
some.
Access to Improved Sanitation
10.Kajiado County has the highest gap between wards with access to improved sanitation. The best
performing ward (Ongata Rongai) has 89 percent of residents with access to improved sanitation
while the worst performing ward (Mosiro) has 2 percent of residents with access to improved
sanitation, a gap of nearly 87 percentage points.
11.There are 9 counties where the gap in access to improved sanitation between the best and worst
performing wards is over 80 percentage points. These are Baringo, Garissa, Kajiado, Kericho, Kilifi,
Machakos, Marsabit, Nyandarua and West Pokot.
Access to Improved Sources of Water
12.In all of the 47 counties, the highest gap in access to improved water sources between the county
with the best access to improved water sources and the least is over 45 percentage points. The
most severe gaps are in Mandera, Garissa, Marsabit, (over 99 percentage points), Kilifi (over 98
percentage points) and Wajir (over 97 percentage points).
Access to Improved Sources of Lighting
13.The gaps within counties in access to electricity for lighting are also enormous. In most counties
(29 out of 47), the gap between the ward with the most access to electricity and the least access
is more than 40 percentage points. The most severe disparities between wards are in Mombasa
(95 percentage point gap between highest and lowest ward), Garissa (92 percentage points), and
Nakuru (89 percentage points).
Access to Improved Housing
14.The highest extreme in this variable is found in Baringo County where all residents in Silale ward live
in grass huts while no one in Ravine ward in the same county lives in grass huts.
Overall ranking of the variables
15.Overall, the counties with the most income inequalities as measured by the gini coefficient are Tana
River, Kwale, Kilifi, Lamu, Migori and Busia. However, the counties that are consistently mentioned
among the most deprived hence have the lowest access to essential services compared to others
across the following nine variables i.e. poverty, mean household expenditure, education, work for
pay, water, sanitation, cooking fuel, access to electricity and improved housing are Mandera (8
variables), Wajir (8 variables), Turkana (7 variables) and Marsabit (7 variables).
vii
Pulling Apart or Pooling Together?
Abbreviations
AMADPOC
African Migration and Development Policy Centre
CRA
Commission on Revenue Allocation
DANIDA
Danish International Development Agency DAP Drivers of Accountability Programme
EAsEnumeration Areas
HDI
Human Development Index
IBP
International Budget Partnership
IEA
Institute of Economic Affairs
IPAR
Institute of Policy Analysis and Research
KIHBS Kenya Intergraded Household Budget Survey
KIPPRA Kenya Institute for Public Policy Research and Analysis
KNBS Kenya National Bureau of Statistics
LPG Liquefied Petroleum Gas
NCIC
National Cohesion and Integration Commission
NTA National Taxpayers Association
PCA
Principal Component Analysis
SAEs
Small Area Estimation
SID Society for International Development
TISA The Institute for Social Accountability
VIP latrine
Ventilated-Improved Pit latrine
VOCs
Volatile Organic Carbons
WDR
World Development Report
xi
Exploring Kenya’s Inequality
Introduction
Background
For more than half a century many people in the development sector in Kenya have worked at alleviating
extreme poverty so that the poorest people can access basic goods and services for survival like food,
safe drinking water, sanitation, shelter and education. However when the current national averages are
disaggregated there are individuals and groups that still lag too behind. As a result, the gap between
the rich and the poor, urban and rural areas, among ethnic groups or between genders reveal huge
disparities between those who are well endowed and those who are deprived.
According to the world inequality statistics, Kenya was ranked 103 out of 169 countries making it the
66th most unequal country in the world. Kenya’s Inequality is rooted in its history, politics, economics
and social organization and manifests itself in the lack of access to services, resources, power, voice
and agency. Inequality continues to be driven by various factors such as: social norms, behaviours and
practices that fuel discrimination and obstruct access at the local level and/ or at the larger societal
level; the fact that services are not reaching those who are most in need of them due to intentional or
unintentional barriers; the governance, accountability, policy or legislative issues that do not favor equal
opportunities for the disadvantaged; and economic forces i.e. the unequal control of productive assets
by the different socio-economic groups.
According to the 2005 report on the World Social Situation, sustained poverty reduction cannot be
achieved unless equality of opportunity and access to basic services is ensured. Reducing inequality
must therefore be explicitly incorporated in policies and programmes aimed at poverty reduction. In
addition, specific interventions may be required, such as: affirmative action; targeted public investments
in underserved areas and sectors; access to resources that are not conditional; and a conscious effort
to ensure that policies and programmes implemented have to provide equitable opportunities for all.
This chapter presents the basic concepts on inequality and poverty, methods used for analysis,
justification and choice of variables on inequality. The analysis is based on the 2009 Kenya housing
and population census while the 2006 Kenya integrated household budget survey is combined with
census to estimate poverty and inequality measures from the national to the ward level. Tabulation of
both money metric measures of inequality such as mean expenditure and non-money metric measures
of inequality in important livelihood parameters like, employment, education, energy, housing, water
and sanitation are presented. These variables were selected from the census data and analyzed in
detail and form the core of the inequality reports. Other variables such as migration or health indicators
like mortality, fertility etc. are analyzed and presented in several monographs by Kenya National Bureau
of Statistics and were therefore left out of this report.
Methodology
Gini-coefficient of inequality
This is the most commonly used measure of inequality. The coefficient varies between ‘0’, which reflects
complete equality and ‘1’ which indicates complete inequality. Graphically, the Gini coefficient can be
2
A PUBLICATION OF KNBS AND SID
Pulling Apart or Pooling Together?
easily represented by the area between the Lorenz curve and the line of equality. On the figure below,
the Lorenz curve maps the cumulative income share on the vertical axis against the distribution of the
population on the horizontal axis. The Gini coefficient is calculated as the area (A) divided by the sum
of areas (A and B) i.e. A/(A+B). If A=0 the Gini coefficient becomes 0 which means perfect equality,
whereas if B=0 the Gini coefficient becomes 1 which means complete inequality. Let xi be a point on
the X-axis, and yi a point on the Y-axis, the Gini coefficient formula is:
N
Gini = 1 − ∑ ( xi − xi −1 )( y i + y i −1 ) .
i =1
An Illustration of the Lorenz Curve
LORENZ CURVE
100
Cumulative % of Expenditure
90
80
70
60
50
40
A
30
B
20
10
0
0
10
20
30
40
50
60
70
80
90
100
Cumulative % of Population
Small Area Estimation (SAE)
The small area problem essentially concerns obtaining reliable estimates of quantities of interest —
totals or means of study variables, for example — for geographical regions, when the regional sample
sizes are small in the survey data set. In the context of small area estimation, an area or domain
becomes small when its sample size is too small for direct estimation of adequate precision. If the
regional estimates are to be obtained by the traditional direct survey estimators, based only on the
sample data from the area of interest itself, small sample sizes lead to undesirably large standard errors
for them. For instance, due to their low precision the estimates might not satisfy the generally accepted
publishing criteria in official statistics. It may even happen that there are no sample members at all from
some areas, making the direct estimation impossible. All this gives rise to the need of special small area
estimation methodology.
3
Exploring Kenya’s Inequality
Most of KNBS surveys were designed to provide statistically reliable, design-based estimates only at
the national, provincial and district levels such as the Kenya Intergraded Household Budget Survey
of 2005/06 (KIHBS). The sheer practical difficulties and cost of implementing and conducting sample
surveys that would provide reliable estimates at levels finer than the district were generally prohibitive,
both in terms of the increased sample size required and in terms of the added burden on providers of
survey data (respondents). However through SAE and using the census and other survey datasets,
accurate small area poverty estimates for 2009 for all the counties are obtainable.
The sample in the 2005/06 KIHBS, which was a representative subset of the population, collected
detailed information regarding consumption expenditures. The survey gives poverty estimate of urban
and rural poverty at the national level, the provincial level and, albeit with less precision, at the district
level. However, the sample sizes of such household surveys preclude estimation of meaningful poverty
measures for smaller areas such as divisions, locations or wards. Data collected through censuses
are sufficiently large to provide representative measurements below the district level such as divisions,
locations and sub-locations. However, this data does not contain the detailed information on consumption
expenditures required to estimate poverty indicators. In small area estimation methodology, the first step
of the analysis involves exploring the relationship between a set of characteristics of households and
the welfare level of the same households, which has detailed information about household expenditure
and consumption. A regression equation is then estimated to explain daily per capita consumption
and expenditure of a household using a number of socio-economic variables such as household size,
education levels, housing characteristics and access to basic services.
While the census does not contain household expenditure data, it does contain these socio-economic
variables. Therefore, it will be possible to statistically impute household expenditures for the census
households by applying the socio-economic variables from the census data on the estimated
relationship based on the survey data. This will give estimates of the welfare level of all households
in the census, which in turn allows for estimation of the proportion of households that are poor and
other poverty measures for relatively small geographic areas. To determine how many people are
poor in each area, the study would then utilize the 2005/06 monetary poverty lines for rural and urban
households respectively. In terms of actual process, the following steps were undertaken:
Cluster Matching: Matching of the KIHBS clusters, which were created using the 1999 Population and
Housing Census Enumeration Areas (EA) to 2009 Population and Housing Census EAs. The purpose
was to trace the KIBHS 2005/06 clusters to the 2009 Enumeration Areas.
Zero Stage: The first step of the analysis involved finding out comparable variables from the survey
(Kenya Integrated Household Budget 2005/06) and the census (Kenya 2009 Population and Housing
Census). This required the use of the survey and census questionnaires as well as their manuals.
First Stage (Consumption Model): This stage involved the use of regression analysis to explore the
relationship between an agreed set of characteristics in the household and the consumption levels of
the same households from the survey data. The regression equation was then used to estimate and
explain daily per capita consumption and expenditure of households using socio-economic variables
4
A PUBLICATION OF KNBS AND SID
Pulling Apart or Pooling Together?
such as household size, education levels, housing characteristics and access to basic services, and
other auxiliary variables. While the census did not contain household expenditure data, it did contain
these socio-economic variables.
Second Stage (Simulation): Analysis at this stage involved statistical imputation of household
expenditures for the census households, by applying the socio-economic variables from the census
data on the estimated relationship based on the survey data.
Identification of poor households Principal Component Analysis (PCA)
In order to attain the objective of the poverty targeting in this study, the household needed to be
established. There are three principal indicators of welfare; household income; household consumption
expenditures; and household wealth. Household income is the theoretical indicator of choice of welfare/
economic status. However, it is extremely difficult to measure accurately due to the fact that many
people do not remember all the sources of their income or better still would not want to divulge this
information. Measuring consumption expenditures has many drawbacks such as the fact that household
consumption expenditures typically are obtained from recall method usually for a period of not more
than four weeks. In all cases a well planned and large scale survey is needed, which is time consuming
and costly to collect. The estimation of wealth is a difficult concept due to both the quantitative as well
as the qualitative aspects of it. It can also be difficult to compute especially when wealth is looked at as
both tangible and intangible.
Given that the three main indicators of welfare cannot be determined in a shorter time, an alternative
method that is quick is needed. The alternative approach then in measuring welfare is generally through
the asset index. In measuring the asset index, multivariate statistical procedures such the factor analysis,
discriminate analysis, cluster analysis or the principal component analysis methods are used. Principal
components analysis transforms the original set of variables into a smaller set of linear combinations
that account for most of the variance in the original set. The purpose of PCA is to determine factors (i.e.,
principal components) in order to explain as much of the total variation in the data as possible.
In this project the principal component analysis was utilized in order to generate the asset (wealth)
index for each household in the study area. The PCA can be used as an exploratory tool to investigate
patterns in the data; in identify natural groupings of the population for further analysis and; to reduce
several dimensionalities in the number of known dimensions. In generating this index information from
the datasets such as the tenure status of main dwelling units; roof, wall, and floor materials of main
dwelling; main source of water; means of human waste disposal; cooking and lighting fuels; household
items such radio TV, fridge etc was required. The recent available dataset that contains this information
for the project area is the Kenya Population and Housing Census 2009.
There are four main approaches to handling multivariate data for the construction of the asset index
in surveys and censuses. The first three may be regarded as exploratory techniques leading to index
construction. These are graphical procedures and summary measures. The two popular multivariate
procedures - cluster analysis and principal component analysis (PCA) - are two of the key procedures
that have a useful preliminary role to play in index construction and lastly regression modeling approach.
5
Exploring Kenya’s Inequality
In the recent past there has been an increasing routine application of PCA to asset data in creating
welfare indices (Gwatkin et al. 2000, Filmer and Pritchett 2001 and McKenzie 2003).
Concepts and definitions
Inequality
Inequality is characterized by the existence of unequal opportunities or life chances and unequal
conditions such as incomes, goods and services. Inequality, usually structured and recurrent, results
into an unfair or unjust gap between individuals, groups or households relative to others within a
population. There are several methods of measuring inequality. In this study, we consider among
other methods, the Gini-coefficient, the difference in expenditure shares and access to important basic
services.
Equality and Equity
Although the two terms are sometimes used interchangeably, they are different concepts. Equality
requires all to have same/ equal resources, while equity requires all to have the same opportunity to
access same resources, survive, develop, and reach their full potential, without discrimination, bias, or
favoritism. Equity also accepts differences that are earned fairly.
Poverty
The poverty line is a threshold below which people are deemed poor. Statistics summarizing the bottom
of the consumption distribution (i.e. those that fall below the poverty line) are therefore provided. In
2005/06, the poverty line was estimated at Ksh1,562 and Ksh2,913 per adult equivalent1 per month
for rural and urban households respectively. Nationally, 45.2 percent of the population lives below the
poverty line (2009 estimates) down from 46 percent in 2005/06.
Spatial Dimensions
The reason poverty can be considered a spatial issue is two-fold. People of a similar socio-economic
background tend to live in the same areas because the amount of money a person makes usually, but
not always, influences their decision as to where to purchase or rent a home. At the same time, the area
in which a person is born or lives can determine the level of access to opportunities like education and
employment because income and education can influence settlement patterns and also be influenced
by settlement patterns. They can therefore be considered causes and effects of spatial inequality and
poverty.
Employment
Access to jobs is essential for overcoming inequality and reducing poverty. People who cannot access
productive work are unable to generate an income sufficient to cover their basic needs and those of
their families, or to accumulate savings to protect their households from the vicissitudes of the economy.
1
This is basically the idea that every person needs different levels of consumption because of their age, gender, height,
weight, etc. and therefore we take this into account to create an adult equivalent based on the average needs of the different
populations
6
A PUBLICATION OF KNBS AND SID
Pulling Apart or Pooling Together?
The unemployed are therefore among the most vulnerable in society and are prone to poverty. Levels
and patterns of employment and wages are also significant in determining degrees of poverty and
inequality. Macroeconomic policy needs to emphasize the need for increasing regular good quality
‘work for pay’ that is covered by basic labour protection. The population and housing census 2009
included questions on labour and employment for the population aged 15-64.
The census, not being a labour survey, only had few categories of occupation which included work
for pay, family business, family agricultural holdings, intern/volunteer, retired/home maker, full time
student, incapacitated and no work. The tabulation was nested with education- for none, primary and
secondary level.
Education
Education is typically seen as a means of improving people’s welfare. Studies indicate that inequality
declines as the average level of educational attainment increases, with secondary education producing
the greatest payoff, especially for women (Cornia and Court, 2001). There is considerable evidence
that even in settings where people are deprived of other essential services like sanitation or clean
water, children of educated mothers have much better prospects of survival than do the children of
uneducated mothers. Education is therefore typically viewed as a powerful factor in leveling the field of
opportunity as it provides individuals with the capacity to obtain a higher income and standard of living.
By learning to read and write and acquiring technical or professional skills, people increase their chances
of obtaining decent, better-paying jobs. Education however can also represent a medium through
which the worst forms of social stratification and segmentation are created. Inequalities in quality and
access to education often translate into differentials in employment, occupation, income, residence and
social class. These disparities are prevalent and tend to be determined by socio-economic and family
background. Because such disparities are typically transmitted from generation to generation, access
to educational and employment opportunities are to a certain degree inherited, with segments of the
population systematically suffering exclusion. The importance of equal access to a well-functioning
education system, particularly in relation to reducing inequalities, cannot be overemphasized.
Water
According to UNICEF (2008), over 1.1 billion people lack access to an improved water source and over
three million people, mostly children, die annually from water-related diseases. Water quality refers
to the basic and physical characteristics of water that determines its suitability for life or for human
uses. The quality of water has tremendous effects on human health both in the short term and in the
long term. As indicated in this report, slightly over half of Kenya’s population has access to improved
sources of water.
Sanitation
Sanitation refers to the principles and practices relating to the collection, removal or disposal of human
excreta, household waste, water and refuse as they impact upon people and the environment. Decent
sanitation includes appropriate hygiene awareness and behavior as well as acceptable, affordable and
7
Exploring Kenya’s Inequality
sustainable sanitation services which is crucial for the health and wellbeing of people. Lack of access
to safe human waste disposal facilities leads to higher costs to the community through pollution of
rivers, ground water and higher incidence of air and water borne diseases. Other costs include reduced
incomes as a result of disease and lower educational outcomes.
Nationally, 61 percent of the population has access to improved methods of waste disposal. A sizeable
population i.e. 39 percent of the population is disadvantaged. Investments made in the provision of
safe water supplies need to be commensurate with investments in safe waste disposal and hygiene
promotion to have significant impact.
Housing Conditions (Roof, Wall and Floor)
Housing conditions are an indicator of the degree to which people live in humane conditions. Materials
used in the construction of the floor, roof and wall materials of a dwelling unit are also indicative of the
extent to which they protect occupants from the elements and other environmental hazards. Housing
conditions have implications for provision of other services such as connections to water supply,
electricity, and waste disposal. They also determine the safety, health and well being of the occupants.
Low provision of these essential services leads to higher incidence of diseases, fewer opportunities
for business services and lack of a conducive environment for learning. It is important to note that
availability of materials, costs, weather and cultural conditions have a major influence on the type of
materials used.
Energy fuel for cooking and lighting
Lack of access to clean sources of energy is a major impediment to development through health related
complications such as increased respiratory infections and air pollution. The type of cooking fuel or
lighting fuel used by households is related to the socio-economic status of households. High level
energy sources are cleaner but cost more and are used by households with higher levels of income
compared with primitive sources of fuel like firewood which are mainly used by households with a lower
socio-economic profile. Globally about 2.5 billion people rely on biomass such as fuel-wood, charcoal,
agricultural waste and animal dung to meet their energy needs for cooking.
8
A PUBLICATION OF KNBS AND SID
Pulling Apart or Pooling Together?
Isiolo County
9
Exploring Kenya’s Inequality
Isiolo County
Figure 9.1: Isiolo Population Pyramid
Isiolo
65+
60-64
55-59
50-54
45-49
40-44
35-39
30-34
25-29
20-24
15-19
10-14
5-9
0-4
20
15
10
5
0
Female
5
10
15
20
Male
Population
Isiolo County has a child rich population, where 0-14 year olds constitute 45% of the total population. This is due
to high fertility rates among women as shown by the highest percentage size of 4-6 members at 40%.
Employment
The 2009 population and housing census covered in brief the labour status as tabulated below. The main variable
of interest for inequality discussed in the text is work for pay by level of education. The other variables, notably
family business, family agricultural holdings, intern/volunteer, retired/homemaker, fulltime student, incapacitated
and no work are tabulated and presented in the annex table 9.3 up to ward level.
Table 9: Overall Employment by Education Levels in Isiolo County
Education Level
Work for
pay
Family
Business
Family Agricultural Holding
Intern/
Volunteer
Retired/ Homemaker
Fulltime
Student
Incapacitated
No work
Number of
Individuals
Total
16.6
16.3
33.0
1.0
12.0
10.7
0.5
10.0
71,260
None
7.3
17.2
50.4
0.8
15.8
0.2
0.7
7.5
34,723
Primary
16.8
16.9
22.4
1.1
10.7
19.0
0.3
12.8
20,740
Secondary+
36.5
13.8
8.7
1.3
5.1
22.9
0.1
11.7
15,797
In Isiolo County, 7% of the residents with no formal education, 17% of those with a primary level of education
and 37% of those with a secondary level of education or above are working for pay. Work for pay is highest in
Nairobi at 49%; this is 12 percentage points above the level in Isiolo for those with a secondary level of education
or above.
10
A PUBLICATION OF KNBS AND SID
Pulling Apart or Pooling Together?
Gini Coefficient
In this report, the Gini index measures the extent to which the distribution of consumption expenditure among
individuals or households within an economy deviates from a perfectly equal distribution. A Gini index of ‘0’ represents perfect equality, while an index of ‘1’ implies perfect inequality. Isiolo County’s Gini index is 0.431 compared with Turkana County, which has the least inequality nationally (0.283).
Figure 9.2: Isiolo County-Gini Coefficient by Ward
Isiolo County:Gini Coefficient by Ward
Location of Isiolo
County in Kenya
CHERAB
CHARI
SERICHO
NGARE MARA
OLDONYIRO
GARBATULLA
BURAT
KINNA
WABERA
BULA PESA
Legend
County Boundary
Gini Coefficient
0.60 - 0.72
0.48 - 0.59
0.36 - 0.47
0
12.5
25
50 Kilometers
0.24 - 0.35
³
0.11 - 0.23
11
Exploring Kenya’s Inequality
Education
Figure 9.3: Isiolo County-Percentage of Population by Education attainment by Ward
Percentage of Population by Education
Attainment - Ward Level - Isiolo County
Location of Isiolo
County in Kenya
CHERAB
CHARI
SERICHO
OLDONYIRO
NGARE MARA
BURAT
KINNA
GARBATULLA
Legend
County Boundary
None
Primary
Secondary and above
Water Bodies
³
0
12.5
25
50 Kilometers
Only 13% of Isiolo County residents have a secondary level of education or above. Isiolo North constituency has
the highest share of residents with a secondary level of education or above at 16%. This is twice Isiolo South
constituency, which has the lowest share of residents with a secondary level of education or above. Isiolo North
constituency is 3 percentage points above the county average. Two wards, Wabera and Bula Pesa, have the highest share of residents with a secondary level of education or above at 29% each. This is almost 10 times Oldonyiro
ward, which has the lowest share of residents with a secondary level of education or above. Wabera and Bula
Pesa are 16 percentage points above the county average.
A total of 36% of Isiolo County residents have a primary level of education only. Isiolo North constituency has the
highest share of residents with a primary level of education only at 37%. This is 4 percentage points above Isiolo
South constituency, which has the lowest share of residents with a primary level of education only. Isiolo North
constituency is 1 percentage point above the county average. Bula Pesa ward has the highest share of residents
with a primary level of education at 47%. This is three times Oldonyiro ward, which has the lowest share of residents with primary only. Bula Pesa ward is 11 percentage points above the county average.
A total of 51% of Isiolo county residents have no formal education. Isiolo South constituency has the highest
share of residents with no formal education at 60%.This is 13 percentage points above Isiolo North constituency,
which has the lowest share of residents with no formal education. Isiolo South constituency is 9 percentage points
above the county average. Oldonyiro ward has the highest percentage of residents with no formal education at
83%. This is almost four times Bula Pesa ward, which has the lowest percentage of residents with no formal education. Oldonyiro ward is 32 percentage points above the county average.
12
A PUBLICATION OF KNBS AND SID
Pulling Apart or Pooling Together?
Energy
Cooking Fuel
Figure 9.4: Percentage Distribution of Households by Source of Cooking Fuel in Isiolo County
Figure 9.4: Percentage Distribution of Households by Source of Cooking Fuel in Isiolo County
Percentage
70.0
60.0
50.0
40.0
30.0
20.0
10.0
-
64.9
29.1
0.5
2.7
2.1
0.4
Electricity
Paraffin
LPG
Biogas
Firewood
Charcoal
0.1
0.3
Solar
Other
Only 2% of residents in Isiolo County use liquefied petroleum gas (LPG), while 3% use paraffin, 65% use firewood
and 29% use charcoal. Firewood is the most common cooking fuel by gender with 63% of male headed households and 67% of female headed households using it.
Isiolo South constituency has the highest level of firewood use in Isiolo County at 94%.This is 40 percentage
points above Isiolo North constituency, which has the lowest share at 54%. Isiolo South constituency is about 29
percentage points above the county average. Chari ward has the highest level of firewood use in Isiolo County at
98%.This is eight times Bula Pesa ward, which has the lowest share at 12%. Chari ward is 33 percentage points
above the county average.
Isiolo North constituency has the highest level of charcoal use in Isiolo County at 39%.This is almost eight times
Isiolo South constituency, which has the lowest share at 5%. Isiolo North constituency is about 10 percentage
points above the county average. Bula Pesa ward has the highest level of charcoal use in Isiolo County at 74%.
This is 72 percentage points more than Chari ward, which has the lowest share at 2%. Bula Pesa ward is 45 percentage points above the county average.
Lighting
Figure 9.5: Percentage Distribution of Households by Source of Lighting Fuel in Isiolo County
Figure 9.5:Percentage Distribution of Households by Source of Lighting Fuel in Isiolo County
35.0
30.8
Percentage
30.0
25.0
20.0
23.3
19.6
18.7
15.0
10.0
5.0
2.5
0.5
0.0
Electricity
Pressure Lamp
Lantern
Tin Lamp
Gas Lamp
1.4
Fuelwood
Solar
3.3
Other
A total of 19% of residents in Isiolo County use electricity as their main source of lighting. A further 31% use lanterns, 20% use tin lamps, and 23% use fuel wood. Electricity use is more common in male headed households at
20% as compared with female headed households at 16%.
13
Exploring Kenya’s Inequality
Isiolo North constituency has the highest level of electricity use at 26%. This is 25 percentage points above Isiolo
South constituency, which has the lowest level of electricity use. Isiolo North is 7 percentage points above the
county average. Wabera ward has the highest level of electricity use at 54%. That is 54 percentage points above
Chari ward, which has the lowest level of electricity use. Wabera ward is 35 percentage points above the county
average.
Housing
Flooring
Figure 9.6: Percentage Distribution of Households by Floor Material in Isiolo County
Percentage
Figure 9.6: Percentage Distribution of Households by Floor Material in Isiolo County
80.0
70.0
60.0
50.0
40.0
30.0
20.0
10.0
-
69.9
29.0
Cement
0.5
0.4
Tiles
Wood
0.2
Earth
Other
In Isiolo County, 29% of residents have homes with cement floors, while 70% have earth floors. Less than 1% has
wood and just 1% has tile floors. Isiolo North constituency has the highest share of cement floors at 38%. This
is six times Isiolo South constituency, which has the lowest share of cement floors. Isiolo North constituency is
9 percentage points above the county average. Bula Pesa ward has the highest share of cement floors at 74%.
This is 73 percentage points above Chari ward, which has the lowest share of cement floors. Bula Pesa ward is
45 percentage points above the county average.
Roofing
Figure 9.7: Percentage Distribution of Households by Roof Material in Isiolo County
Percentage
Figure 9.7: Percentage Distribution of Households by Roof Material in Isiolo County
70.0
60.0
50.0
40.0
30.0
20.0
10.0
0.0
60.6
20.8
Corrugated
Iron Sheets
0.7
0.3
1.5
Tiles
Concrete
Asbestos
sheets
5.9
Grass
Makuti
1.8
3.4
5.1
Tin
Mud/Dung
Other
In Isiolo County, less than 1% of residents have homes with concrete roofs, while 61% has corrugated iron roofs.
Grass and makuti roofs cover 27% of homes, and 3% have mud/dung roofs.
Isiolo North constituency has the highest share of corrugated iron sheet roofs at 66%. This is 20 percentage points
above Isiolo South constituency, which has the lowest share of corrugated iron sheet roofs. Isiolo North is 5 percentage points above the county average. Bula Pesa ward has the highest share of corrugated iron sheet roofs
at 96%. This is almost 11 times Oldonyiro ward, which has the lowest share of corrugated iron sheet roofs. Bula
Pesa ward is 35 percentage points above the county average.
14
A PUBLICATION OF KNBS AND SID
Pulling Apart or Pooling Together?
Isiolo South constituency has the highest share of grass/makuti roofs at 52%. That is three times Isiolo North
constituency, which has the lowest share of grass/makuti roofs. Isiolo South constituency is 25 percentage points
above the county average. Garbatula ward has the highest share of grass/makuti roofs at 63%. This is 63 percentage points above Bula Pesa ward, which has the lowest share. Garbatula ward is 36 percentage points above the
county average.
Walls
Figure 9.8: Percentage Distribution of Households by Wall Material in Isiolo County
Percentage
Figure 9.8: Percentage Distribution of Households by Wall Material in Isiolo County
35.0
30.0
25.0
20.0
15.0
10.0
5.0
0.0
31.1
22.3
10.3
Stone
6.7
3.7
Brick/Block Mud/Wood Mud/Cement Wood only
17.7
1.2
Coorugated Grass/Reeds
Iron Sheets
4.9
Tin
2.1
Other
In Isiolo County, 17% of homes have either brick or stone walls, 35% have mud/wood or mud/cement walls, 22%
have wood walls and 1% has corrugated iron walls. Another 18% have grass/thatched walls, while 7% have tin or
other walls.
Isiolo North constituency has the highest share of brick/stone walls at 23%. That is seven times Isiolo South constituency, which has the lowest share of brick/stone walls. Isiolo North constituency is 6 percentage points above
the county average. Bula Pesa ward has the highest share of brick/stone walls at 44%. This is 43 percentage
points above Chari ward, which has the lowest share of brick/stone walls. Bula Pesa ward is 27 percentage points
above the county average.
Isiolo South constituency has the highest share of mud with wood/cement walls at 47%. This is 17 percentage
points above Isiolo North constituency, which has the lowest share of mud with wood/cement. Isiolo South constituency is12 percentage points above the county average. Sericho ward has the highest share of mud with
wood/cement walls at 66%. That is almost 17 times Wabera ward, which has the lowest share of mud with wood/
cement walls. Sericho ward is 31 percentage points above the county average.
15
Exploring Kenya’s Inequality
Water
Improved sources of water comprise protected spring, protected well, borehole, piped into dwelling, piped and
rain water collection while unimproved sources include pond, dam, lake, stream/river, unprotected spring, unprotected well, jabia, water vendor and others.
In Isiolo County, 59% of residents use improved sources of water, with the rest relying on unimproved sources.
There is no significant gender differential in use of improved sources with male headed households at 59% in
comparison with 60% in female headed households.
Isiolo North constituency has the highest share of residents using improved sources of water at 60%.This is 2 percentage points above Isiolo South constituency, which has the lowest share of residents using improved sources
of water. Isiolo North constituency is 1 percentage point above the county average. Wabera ward has the highest
share of residents using improved sources of water at 88% each. This is 18 times Oldonyiro ward, which has the
lowest share using improved sources of water. Wabera ward is 29 percentage points above the county average.
Figure 9.9: Isiolo County-Percentage of Households with Improved and Unimproved Sources of
Water by Ward
Percentage of Households with Improved and Unimproved
Source of Water - Ward Level - Isiolo County
Location of Isiolo
County in Kenya
CHERAB
CHARI
SERICHO
OLDONYIRO
NGARE MARA
GARBATULLA
BURAT
Legend
County Boundary
Unimproved Source of Water
Improved Source of water
KINNA
³
Water Bodies
0
12.5
25
50 Kilometers
Sanitation
While 40% of residents in Isiolo county use improved sanitation, the rest use unimproved sanitation. There is no
significant gender differential as 40% of male headed households and 41% of female headed households use
improved sanitation.
Isiolo North constituency has the highest share of residents using improved sanitation at 43%. This is 9 percentage points above Isiolo South constituency, which has the lowest share of residents using improved sanitation.
Isiolo North constituency is 3 percentage points above the county average. Bula Pesa ward has the highest share
of residents using improved sanitation at 81%. This is almost 41 times Oldonyiro ward, which has the lowest share
of using improved sanitation. Bula Pesa ward is 41 percentage points above the county average.
16
A PUBLICATION OF KNBS AND SID
Pulling Apart or Pooling Together?
Figure 9.10: Isiolo County –Percentage of Households with Improved and Unimproved Sanitation
by Ward
Percentage of Households with Improved and Unimproved
Sanitation - Ward Level - Isiolo County
Location of Isiolo
County in Kenya
CHERAB
CHARI
SERICHO
OLDONYIRO
NGARE MARA
GARBATULLA
KINNA
WABERA
BURAT
Legend
County Boundary
0
12.5
25
50 Kilometers
Improved Sanitation
Unimproved Sanitation
Water Bodies
³
Isiolo County Annex Tables
17
18
A PUBLICATION OF KNBS AND SID
96,699
16,264
22,203
4,773
15,475
4,862
17,916
15,206
42,697
16,120
14,551
12,026
Isiolo North
Constituency
Wabera
BulaPesa
Chari
Cherab
Ngare Mara
Burat
Oldonyiro
Isiolo South
Constituency
Garbatulla
Kinna
Sericho
11,844,452
Urban
139,396
26,075,195
Rural
Isiolo County
37,919,647
Total Pop
Kenya
/Wards
Constituency
County
6,448
8,078
8,421
22,947
7,416
8,774
2,493
7,707
2,410
10,759
7,908
47,467
70,414
5,918,664
12,869,034
18,787,698
Male
Gender
5,578
6,473
7,699
19,750
7,790
9,142
2,369
7,768
2,363
11,444
8,356
49,232
68,982
5,925,788
13,206,161
19,131,949
Female
2,237
2,612
3,154
8,003
3,525
4,045
1,099
3,183
1,090
3,841
2,957
19,740
27,743
1,976,155
5,059,515
7,035,670
0-5 yrs
5,387
5,987
7,459
18,833
7,765
8,746
2,363
7,423
2,353
8,569
6,891
44,110
62,943
4,321,641
12,024,773
16,346,414
0-14 yrs
3,105
3,254
3,817
10,176
3,386
4,197
1,021
3,906
1,081
4,469
3,870
21,930
32,106
2,158,477
6,134,730
8,293,207
10-18 yrs
4,122
4,989
5,222
14,333
4,676
5,642
1,487
4,765
1,331
8,777
6,009
32,687
47,020
5,026,710
8,303,007
13,329,717
15-34 yrs
Age group
6,172
7,883
8,051
22,106
6,948
8,450
2,333
7,405
2,162
12,981
8,875
49,154
71,260
7,265,012
12,984,788
20,249,800
15-64 yrs
467
681
610
1,758
493
720
166
647
258
653
498
3,435
5,193
257,799
1,065,634
1,323,433
65+ yrs
Table 9.1: Gender, Age group, Demographic Indicators and Households Size by County Constituency and Wards
9. Isiolo
1.156
1.248
1.094
1.162
0.952
0.960
1.052
0.992
1.020
0.940
0.946
0.964
1.021
0.999
0.974
0.982
sex
Ratio
0.948
0.846
1.002
0.931
1.189
1.120
1.084
1.090
1.208
0.710
0.833
0.967
0.956
0.630
1.008
0.873
0.873
0.759
0.926
0.852
1.118
1.035
1.013
1.002
1.088
0.660
0.776
0.897
0.883
0.595
0.926
0.807
Child dependency
Ratio
0.076
0.086
0.076
0.080
0.071
0.085
0.071
0.087
0.119
0.050
0.056
0.070
0.073
0.035
0.082
0.065
ratio
aged
dependency
Demographic indicators
Total
dependency
Ratio
30.7
31.3
35.6
32.9
31.6
35.7
48.5
33.1
34.7
55.5
43.5
42.1
39.5
54.8
33.2
41.5
0-3
41.8
43.0
44.1
43.1
46.0
42.9
34.4
44.4
44.9
33.1
35.2
39.2
40.3
33.7
41.3
38.4
27.5
25.7
20.3
24.0
22.4
21.5
17.1
22.5
20.4
11.3
21.3
18.6
20.2
11.5
25.4
20.1
7+
total
2347
2908
3473
8728
3122
3822
1133
3256
1024
6145
3647
22149
30,877
3,253,501
5,239,879
8,493,380
Portion of HH Members:
4-6
Exploring Kenya’s Inequality
Pulling Apart or Pooling Together?
Table 9.2: Employment by County, Constituency and Wards
County/Constituency
Work for
pay
Family Business
Family
Agricultural
Holding
Intern/
Volunteer
Retired/
Homemaker
Fulltime
Student
Kenya
23.7
13.1
32.0
1.1
9.2
12.8
0.5
7.7
20,249,800
Rural
15.6
11.2
43.5
1.0
8.8
13.0
0.5
6.3
12,984,788
0.3
/Wards
Incapacitated No work
No. of Individuals
Urban
38.1
16.4
11.4
1.3
9.9
12.2
10.2
7,265,012
Isiolo County
16.6
16.3
33.0
1.0
12.0
10.7
0.5
10.0
71,260
Isiolo North Constituency
19.9
13.7
29.9
1.1
13.2
11.7
0.4
10.0
49,154
Wabera
30.9
12.2
11.4
1.9
11.0
18.1
0.5
14.1
8,875
BulaPesa
30.3
21.5
10.3
0.9
8.3
12.9
0.4
15.4
12,981
Chari
6.2
17.3
24.2
1.5
31.5
14.2
0.8
4.4
2,162
Cherab
9.0
15.5
35.4
0.7
16.3
13.4
0.6
9.1
7,405
Ngare Mara
23.9
7.1
50.9
1.2
9.1
4.8
0.2
2.9
2,333
Burat
16.4
12.0
38.2
1.6
11.9
10.9
0.4
8.7
8,450
Oldonyiro
5.1
2.0
69.3
0.3
19.4
2.3
0.1
1.5
6,948
Isiolo South Constituency
9.2
22.3
39.8
0.8
9.1
8.4
0.5
9.8
22,106
Garbatulla
7.4
20.6
37.4
1.2
16.0
6.5
0.3
10.5
8,051
13.8
29.7
33.6
0.4
6.7
7.6
0.7
7.5
7,883
5.8
15.2
50.8
0.8
3.3
11.9
0.7
11.6
6,172
Kinna
Sericho
Table 9.3: Employment and Education Levels by County, Constituency and Wards
County / constituency/
Wards
Education
Total level
Work for
pay
Family
Business
Family
Agricultural
Holding
Intern/
Volunteer
Retired/
Homemaker
Fulltime
Student
Incapacitated
No
work
No. of Individuals
Kenya
Total
23.7
13.1
32.0
1.1
9.2
12.8
0.5
7.7
20,249,800
Kenya
None
11.1
14.0
44.4
1.7
14.7
0.8
1.2
12.1
3,154,356
Kenya
Primary
20.7
12.6
37.3
0.8
9.6
12.1
0.4
6.5
9,528,270
Kenya
Secondary+
32.7
13.3
20.2
1.2
6.6
18.6
0.2
7.3
7,567,174
Rural
Total
15.6
11.2
43.5
1.0
8.8
13.0
0.5
6.3
12,984,788
Rural
None
8.5
13.6
50.0
1.4
13.9
0.7
1.2
10.7
2,614,951
Rural
Primary
15.5
10.8
45.9
0.8
8.4
13.2
0.5
5.0
6,785,745
Rural
Secondary+
21.0
10.1
34.3
1.0
5.9
21.9
0.3
5.5
3,584,092
Urban
Total
38.1
16.4
11.4
1.3
9.9
12.2
0.3
10.2
7,265,012
Urban
None
23.5
15.8
17.1
3.1
18.7
1.5
1.6
18.8
539,405
19
Exploring Kenya’s Inequality
Urban
Primary
33.6
16.9
16.0
1.0
12.3
9.5
0.4
10.2
2,742,525
Urban
Secondary+
43.2
16.1
7.5
1.3
7.1
15.6
0.2
9.0
3,983,082
Isiolo
Total
16.6
16.3
33.0
1.0
12.0
10.7
0.5
10.0
71,260
Isiolo
None
7.3
17.2
50.4
0.8
15.8
0.2
0.7
7.5
34,723
Isiolo
Primary
16.8
16.9
22.4
1.1
10.7
19.0
0.3
12.8
20,740
Isiolo
Secondary+
36.5
13.8
8.7
1.3
5.1
22.9
0.1
11.7
15,797
Isiolo North Constituency
Total
19.9
13.7
29.9
1.1
13.2
11.7
0.4
10.0
49,154
Isiolo North Constituency
None
8.0
11.7
51.3
1.1
19.5
0.3
0.7
7.4
20,955
Isiolo North Constituency
Primary
19.9
16.2
19.8
1.1
11.4
18.8
0.3
12.5
14,891
Isiolo North Constituency
Secondary+
38.5
13.9
7.7
1.2
5.4
21.9
0.1
11.4
13,308
Wabera Wards
Total
30.9
12.2
11.4
1.9
11.0
18.1
0.5
14.1
8,875
Wabera Wards
None
17.6
11.2
19.4
2.9
22.3
0.9
1.6
24.1
1,740
Wabera Wards
Primary
26.0
13.9
13.7
1.8
11.5
19.0
0.4
13.7
2,966
Wabera Wards
Secondary+
39.9
11.3
6.4
1.4
5.9
24.7
0.1
10.2
4,169
BulaPesa Wards
Total
30.3
21.5
10.3
0.9
8.3
12.9
0.4
15.4
12,981
BulaPesa Wards
None
18.6
21.0
19.1
0.8
19.4
0.9
1.5
18.6
2,164
BulaPesa Wards
Primary
25.9
23.6
11.8
0.9
7.8
12.6
0.4
17.0
5,091
BulaPesa Wards
Secondary+
38.6
19.8
5.5
0.9
4.5
17.7
0.1
12.9
5,726
Chari Wards
Total
6.2
17.3
24.2
1.5
31.5
14.2
0.8
4.4
2,162
Chari Wards
None
3.4
18.5
32.0
1.2
40.7
0.2
1.3
2.7
1,246
Chari Wards
Primary
5.6
17.8
15.8
1.7
22.5
31.1
0.2
5.5
659
Chari Wards
Secondary+
21.0
10.1
7.8
2.7
10.5
38.5
-
9.3
257
Cherab Wards
Total
9.0
15.5
35.4
0.7
16.3
13.4
0.6
9.1
7,405
Cherab Wards
None
5.1
17.3
48.7
0.8
20.0
0.1
0.9
7.2
4,259
Cherab Wards
Primary
8.4
15.1
22.6
0.7
13.9
29.4
0.4
9.7
2,173
Cherab Wards
Secondary+
27.5
8.7
6.2
0.4
5.2
35.9
0.1
15.9
973
Ngare Mara Wards
Total
23.9
7.1
50.9
1.2
9.1
4.8
0.2
2.9
2,333
Ngare Mara Wards
None
5.3
8.2
71.2
0.9
12.8
-
0.2
1.4
1,338
Ngare Mara Wards
Primary
27.1
7.4
35.7
0.8
6.6
16.5
0.2
5.8
502
Ngare Mara Wards
Secondary+
71.2
3.7
11.2
2.2
1.6
5.9
-
4.3
493
Burat Wards
Total
16.4
12.0
38.2
1.6
11.9
10.9
0.4
8.7
8,450
20
A PUBLICATION OF KNBS AND SID
Pulling Apart or Pooling Together?
Burat Wards
None
12.0
14.9
50.6
1.7
12.9
0.4
0.6
7.0
4,369
Burat Wards
Primary
16.4
10.1
29.4
1.1
12.6
19.7
0.3
10.5
2,827
Burat Wards
Secondary+
31.4
6.5
14.8
2.0
6.9
27.8
-
10.6
1,254
Oldonyiro Wards
Total
5.1
2.0
69.3
0.3
19.4
2.3
0.1
1.5
6,948
Oldonyiro Wards
None
1.9
1.3
74.8
0.3
20.3
0.0
0.1
1.2
5,839
Oldonyiro Wards
Primary
9.2
3.7
49.0
0.5
18.0
16.3
-
3.3
673
Oldonyiro Wards
Secondary+
40.6
8.0
27.1
0.5
9.4
11.0
-
3.4
436
Isiolo South Constituency
Total
9.2
22.3
39.8
0.8
9.1
8.4
0.5
9.8
22,106
Isiolo South Constituency
None
6.3
25.6
49.0
0.5
10.3
0.2
0.6
7.5
13,768
Isiolo South Constituency
Primary
8.9
18.6
29.2
1.2
8.9
19.5
0.4
13.4
5,849
Isiolo South Constituency
Secondary+
26.2
13.1
13.9
1.5
3.5
27.8
0.5
13.5
2,489
Garbatulla Wards
Total
7.4
20.6
37.4
1.2
16.0
6.5
0.3
10.5
8,051
Garbatulla Wards
None
3.6
22.6
47.1
0.7
17.7
0.2
0.4
7.7
5,473
Garbatulla Wards
Primary
8.9
18.6
20.1
2.1
15.2
17.3
0.3
17.5
1,800
Garbatulla Wards
Secondary+
30.7
11.4
9.3
2.7
5.8
25.5
0.1
14.5
778
Kinna Wards
Total
13.8
29.7
33.6
0.4
6.7
7.6
0.7
7.5
7,883
Kinna Wards
None
12.1
36.7
38.1
0.3
6.6
0.2
0.9
5.1
4,612
Kinna Wards
Primary
11.5
21.5
32.6
0.6
8.3
14.7
0.5
10.2
2,299
Kinna Wards
Secondary+
26.9
15.5
14.8
0.5
3.4
26.1
0.3
12.5
972
Sericho Wards
Total
5.8
15.2
50.8
0.8
3.3
11.9
0.7
11.6
6,172
Sericho Wards
None
2.9
16.1
65.5
0.5
3.8
0.1
0.8
10.4
3,683
Sericho Wards
Primary
5.5
14.9
33.9
1.1
3.1
28.0
0.2
13.2
1,750
Sericho Wards
Secondary+
20.7
11.5
17.6
1.4
1.4
32.5
1.1
13.9
739
Table 9.4: Employment and Education Levels in Male Headed Household by County, Constituency and Wards
County /constituency
Education
Level
reached
Work for
Pay
Family
Business
Family
Agricultural
holding
Internal/
Volunteer
Retired/
Homemaker
Fulltime
Student
Incapacitated
No
work
Population
(15-64)
Kenya National
Total
25.5
13.5
31.6
1.1
9.0
11.4
0.4
7.5
14,757,992
Kenya National
None
11.4
14.3
44.2
1.6
13.9
0.9
1.0
12.6
2,183,284
Kenya National
Primary
22.2
12.9
37.3
0.8
9.4
10.6
0.4
6.4
6,939,667
Kenya National
Secondary+
35.0
13.8
19.8
1.1
6.5
16.5
0.2
7.0
5,635,041
Rural Rural
Total
16.8
11.6
43.9
1.0
8.3
11.7
0.5
6.3
9,262,744
Rural Rural
None
8.6
14.1
49.8
1.4
13.0
0.8
1.0
11.4
1,823,487
Rural Rural
Primary
16.5
11.2
46.7
0.8
8.0
11.6
0.4
4.9
4,862,291
21
Exploring Kenya’s Inequality
Rural Rural
Secondary+
23.1
10.6
34.7
1.0
5.5
19.6
0.2
5.3
2,576,966
Urban Urban
Total
40.2
16.6
10.9
1.3
10.1
10.9
0.3
9.7
5,495,248
Urban Urban
None
25.8
15.5
16.1
3.0
18.2
1.4
1.3
18.7
359,797
Urban Urban
Primary
35.6
16.9
15.4
1.0
12.8
8.1
0.3
9.9
2,077,376
Urban Urban
Secondary+
45.1
16.6
7.3
1.2
7.4
13.8
0.1
8.5
3,058,075
Isiolo
Total
19.1
18.3
32.5
1.0
10.5
8.8
0.4
9.5
48,072
Isiolo
None
8.2
19.8
49.9
0.8
13.2
0.2
0.5
7.4
23,335
Isiolo
Primary
19.5
18.5
22.2
1.1
10.2
15.9
0.3
12.2
13,933
Isiolo
Secondary+
42.0
14.7
8.1
1.1
5.1
18.3
0.1
10.6
10,804
Isiolo North Constituency
Total
23.7
15.1
28.2
1.1
11.8
9.9
0.3
9.8
31,662
Isiolo North Constituency
None
9.4
13.2
50.5
1.1
17.2
0.2
0.6
7.8
12,723
Isiolo North Constituency
Primary
23.2
17.9
19.2
1.1
10.9
15.4
0.3
12.0
9,842
Isiolo North Constituency
Secondary+
44.2
14.7
7.0
1.0
5.3
17.4
0.0
10.3
9,097
Wabera Ward
Total
36.3
12.6
10.7
1.9
9.9
15.1
0.4
13.0
6,023
Wabera Ward
None
21.7
9.4
17.7
3.5
20.7
0.7
1.7
24.7
1,075
Wabera Ward
Primary
29.8
15.1
14.2
1.7
10.4
16.0
0.2
12.5
2,019
Wabera Ward
Secondary+
46.2
12.1
5.8
1.4
5.6
19.8
0.0
9.1
2,929
BulaPesa Ward
Total
33.7
22.5
9.9
0.8
7.8
10.5
0.4
14.3
8,711
BulaPesa Ward
None
22.4
22.3
18.0
0.8
16.2
0.8
1.4
18.2
1,283
BulaPesa Ward
Primary
28.3
24.8
11.9
0.8
8.0
9.9
0.4
15.9
3,489
BulaPesa Ward
Secondary+
42.3
20.6
5.5
0.8
4.9
14.3
0.1
11.6
3,939
Chari Ward
Total
6.1
19.6
27.4
1.4
28.9
11.2
0.6
4.8
1,451
Chari Ward
None
2.6
20.9
35.3
1.2
36.0
0.1
0.9
3.0
861
Chari Ward
Primary
5.9
20.5
18.6
1.4
21.7
25.0
0.2
6.6
424
Chari Ward
Secondary+
25.3
10.8
9.0
2.4
10.2
33.1
-
9.0
166
Cherab Ward
Total
10.6
18.5
36.4
0.8
13.7
10.7
0.5
8.8
5,026
Cherab Ward
None
5.9
20.3
49.4
0.8
15.9
0.1
0.6
7.1
2,990
Cherab Ward
Primary
10.0
18.4
23.0
0.9
12.8
25.5
0.4
9.1
1,416
Cherab Ward
Secondary+
34.8
10.0
4.5
0.3
5.8
28.2
0.2
16.1
Ngare Mara Ward
Total
34.2
6.7
45.6
1.0
6.2
4.0
-
2.3
1,443
Ngare Mara Ward
None
7.1
7.9
73.3
1.3
9.0
-
-
1.3
745
Ngare Mara Ward
Primary
40.9
8.6
26.5
0.3
4.8
13.7
-
5.1
313
22
A PUBLICATION OF KNBS AND SID
620
Pulling Apart or Pooling Together?
Ngare Mara Ward
Secondary+
81.3
2.9
7.5
0.8
1.8
3.9
-
1.8
385
Burat Ward
Total
19.1
12.1
38.1
1.5
11.0
8.9
0.2
9.0
5,299
Burat Ward
None
13.0
14.2
51.5
1.6
11.5
0.3
0.4
7.5
2,738
Burat Ward
Primary
20.0
11.1
28.6
1.4
12.3
16.0
0.1
10.5
1,788
Burat Ward
Secondary+
38.6
7.2
12.7
1.4
6.0
23.2
-
11.0
773
Oldonyiro Ward
Total
6.8
2.6
68.2
0.2
18.5
1.9
0.1
1.7
3,709
Oldonyiro Ward
None
2.4
1.7
74.7
0.2
19.5
-
0.1
1.3
3,031
Oldonyiro Ward
Primary
11.7
4.6
47.8
0.5
18.6
13.2
-
3.6
393
Oldonyiro Ward
Secondary+
46.7
8.4
26.7
0.4
8.1
6.7
-
3.2
285
Isiolo South Constituency
Total
10.2
24.5
40.6
0.8
7.9
6.7
0.4
8.9
16,410
Isiolo South Constituency
None
6.8
27.7
49.2
0.5
8.4
0.1
0.5
6.9
10,612
Isiolo South Constituency
Primary
10.7
20.1
29.5
1.2
8.6
16.9
0.3
12.6
4,091
Isiolo South Constituency
Secondary+
30.6
14.9
14.1
1.6
3.7
23.0
0.3
11.9
1,707
Garbatulla Ward
Total
7.5
22.9
40.2
1.1
13.5
4.8
0.2
9.9
6,035
Garbatulla Ward
None
3.5
24.8
49.7
0.6
14.0
0.1
0.2
7.1
4,240
Garbatulla Ward
Primary
9.6
20.4
20.8
2.1
15.1
14.1
0.2
17.7
1,268
Garbatulla Ward
Secondary+
34.5
13.7
10.1
2.7
5.1
20.3
-
13.7
527
Kinna Ward
Total
15.8
33.3
31.7
0.4
6.0
6.0
0.6
6.2
5,879
Kinna Ward
None
13.5
40.9
34.4
0.3
5.6
0.1
0.7
4.5
3,581
Kinna Ward
Primary
14.0
23.0
32.7
0.5
7.7
12.9
0.5
8.7
1,640
Kinna Ward
Secondary+
32.5
17.8
14.6
0.6
4.1
21.1
-
9.3
658
Sericho Ward
Total
6.6
15.1
52.9
0.8
3.0
10.0
0.5
11.0
4,496
Sericho Ward
None
3.0
15.3
67.4
0.5
3.3
0.1
0.6
9.8
2,791
Sericho Ward
Primary
7.2
15.9
34.4
1.2
2.9
25.5
0.3
12.7
1,183
Sericho Ward
Secondary+
24.1
12.5
17.4
1.7
1.7
28.2
1.0
13.4
522
Table 9.5: Employment and Education Levels in Female Headed Households by County, Constituency and Wards
Education Level
reached
Work for
Pay
Family
Business
Kenya National
Total
18.87
11.91
Family
Agricultural
holding
32.74
Internal/ Retired/
Volunteer Homemaker
1.20 9.85
Fulltime
Student
Incapacitated
No work
Population
(15-64)
16.66
0.69
8.08
5,518,645
Kenya National
None
10.34
13.04
44.55
1.90 16.45
0.80
1.76
11.17
Kenya National
Primary
16.74
11.75
37.10
0.89 9.82
16.23
0.59
6.89
974,824
2,589,877
23
Exploring Kenya’s Inequality
Kenya National
Secondary+
25.95
11.57
21.07
1.27 6.59
25.16
0.28
8.11
1,953,944
1,781,078
Rural Rural
Total
31.53
15.66
12.80
1.54 9.33
16.99
0.54
11.60
Rural Rural
None
8.36
12.26
50.31
1.60 15.77
0.59
1.67
9.44
794,993
Rural Rural
Primary
13.02
9.90
43.79
0.81 9.49
17.03
0.60
5.36
1,924,111
Rural Rural
Secondary+
15.97
8.87
33.03
1.06 6.80
27.95
0.34
5.98
1,018,463
3,737,567
Urban Urban
Total
12.83
10.12
42.24
1.04 10.09
16.51
0.76
6.40
Urban Urban
None
19.09
16.50
19.04
3.22 19.45
1.70
2.18
18.83
179,831
Urban Urban
Primary
27.49
17.07
17.79
1.13 10.76
13.93
0.55
11.29
665,766
Urban Urban
Secondary+
36.81
14.50
8.06
1.51 6.36
22.11
0.22
10.43
935,481
Isiolo
Total
11.9%
12.2%
33.9%
1.1% 14.9%
Isiolo
None
5.4%
11.9%
51.5%
.9% 21.3%
Isiolo
Primary
11.5%
13.3%
22.8%
Isiolo
Secondary+
26.7%
11.5%
Isiolo North Constituency
Total
13.7%
11.0%
Isiolo North Constituency
None
5.8%
9.4%
Isiolo North Constituency
Primary
13.9%
12.8%
Isiolo North Constituency
Secondary+
28.4%
Wabera Ward
Total
23.9%
Wabera Ward
None
Wabera Ward
14.5%
.6%
10.8%
23335
.4%
1.0%
7.6%
11386
1.1% 11.7%
25.2%
.4%
13.9%
6817
9.6%
1.5% 5.1%
31.7%
.2%
13.7%
5132
32.7%
1.1% 15.7%
14.9%
.6%
10.3%
17640
52.6%
1.0% 23.1%
.4%
.9%
6.8%
8230
20.8%
1.0% 12.5%
25.2%
.4%
13.5%
5060
11.9%
8.9%
1.5% 5.4%
30.6%
.1%
13.1%
4350
10.6%
12.1%
1.7% 12.6%
23.0%
.6%
15.5%
3021
11.1%
14.0%
22.2%
2.0% 24.9%
1.2%
1.4%
23.3%
666
Primary
20.2%
11.2%
12.3%
1.9% 13.4%
24.4%
.7%
15.8%
975
Wabera Ward
Secondary+
32.7%
8.6%
7.1%
1.4% 6.0%
32.6%
.1%
11.5%
1380
BulaPesa Ward
Total
23.1%
19.5%
11.0%
1.0% 9.5%
17.7%
.5%
17.8%
4247
BulaPesa Ward
None
13.0%
19.1%
20.8%
.9% 24.3%
1.0%
1.7%
19.1%
878
BulaPesa Ward
Primary
20.4%
21.1%
11.7%
.9% 7.6%
18.4%
.4%
19.4%
1585
BulaPesa Ward
Secondary+
30.4%
18.2%
5.5%
1.1% 3.8%
25.2%
.1%
15.6%
1784
Chari Ward
Total
6.2%
12.5%
17.6%
1.8% 37.0%
20.3%
1.1%
3.5%
711
Chari Ward
None
5.2%
13.2%
24.7%
1.3% 51.2%
.3%
2.1%
2.1%
385
Chari Ward
Primary
5.1%
12.8%
10.6%
2.1% 23.8%
42.1%
0.0%
3.4%
235
Chari Ward
Secondary+
13.2%
8.8%
5.5%
3.3% 11.0%
48.4%
0.0%
9.9%
91
Cherab Ward
Total
5.5%
9.2%
33.4%
.6% 21.5%
19.0%
1.0%
9.7%
2379
Cherab Ward
None
3.2%
10.2%
47.0%
.8% 29.7%
.2%
1.6%
7.5%
1269
Cherab Ward
Primary
5.3%
9.0%
21.9%
.3% 15.9%
36.6%
.4%
10.7%
757
Cherab Ward
Secondary+
14.7%
6.5%
9.1%
.6% 4.2%
49.3%
0.0%
15.6%
353
Ngare Mara Ward
Total
7.3%
7.6%
59.3%
1.5% 13.8%
6.1%
.4%
4.0%
892
Ngare Mara Ward
None
3.0%
8.6%
68.6%
.3% 17.5%
0.0%
.5%
1.3%
593
Ngare Mara Ward
Primary
4.2%
5.3%
50.8%
21.2%
.5%
6.9%
189
1.6% 9.5%
Ngare Mara Ward
Secondary+
35.5%
6.4%
23.6%
7.3% .9%
12.7%
0.0%
13.6%
Burat Ward
Total
11.7%
11.9%
38.2%
1.7% 13.5%
14.2%
.6%
8.2%
3151
Burat Ward
None
10.4%
15.9%
49.0%
2.0% 15.1%
.6%
.9%
6.1%
1631
Burat Ward
Primary
10.1%
8.5%
30.6%
.6% 13.2%
26.0%
.5%
10.6%
1039
Burat Ward
Secondary+
20.0%
5.4%
18.1%
35.1%
0.0%
10.0%
481
Oldonyiro Ward
Total
3.1%
1.3%
70.6%
.4% 20.4%
2.7%
.1%
1.4%
3239
Oldonyiro Ward
None
1.4%
.9%
74.9%
.4% 21.2%
.0%
.1%
1.1%
2808
Oldonyiro Ward
Primary
5.7%
2.5%
50.7%
.4% 17.1%
20.7%
0.0%
2.9%
280
Oldonyiro Ward
Secondary+
29.1%
7.3%
27.8%
.7% 11.9%
19.2%
0.0%
4.0%
Isiolo South Constituency
Total
6.3%
16.1%
37.5%
.9% 12.6%
13.3%
.9%
12.3%
5695
Isiolo South Constituency
None
4.5%
18.4%
48.5%
.7% 16.6%
.4%
1.1%
9.6%
3156
Isiolo South Constituency
Primary
4.8%
15.0%
28.3%
25.4%
.4%
15.1%
1757
24
A PUBLICATION OF KNBS AND SID
2.9% 8.5%
110
1.3% 9.6%
151
Pulling Apart or Pooling Together?
Isiolo South Constituency
Secondary+
16.8%
9.1%
13.6%
1.2% 3.2%
38.2%
.9%
17.1%
782
Garbatulla Ward
Total
7.0%
13.9%
29.3%
1.6% 23.7%
11.4%
.6%
12.5%
2015
Garbatulla Ward
None
3.8%
15.2%
38.4%
1.2% 30.5%
.5%
.7%
9.7%
1233
Garbatulla Ward
Primary
7.0%
14.1%
18.5%
2.1% 15.6%
25.0%
.6%
17.1%
531
Garbatulla Ward
Secondary+
22.7%
6.8%
7.6%
2.8% 7.2%
36.3%
.4%
16.3%
251
Kinna Ward
Total
7.9%
19.1%
39.3%
.5% 8.5%
12.3%
1.0%
11.3%
2004
Kinna Ward
None
7.3%
22.4%
51.1%
.3% 9.7%
.6%
1.5%
7.2%
1031
Kinna Ward
Primary
5.5%
17.8%
32.3%
.9% 9.9%
19.1%
.5%
14.1%
659
Kinna Ward
Secondary+
15.0%
10.8%
15.3%
.3% 1.9%
36.6%
1.0%
19.1%
314
Sericho Ward
Total
3.6%
15.2%
45.2%
.6% 4.2%
16.9%
1.0%
13.3%
1676
Sericho Ward
None
2.4%
18.3%
59.6%
.4% 5.5%
.2%
1.3%
12.2%
892
Sericho Ward
Primary
2.1%
12.7%
33.0%
.9% 3.7%
33.2%
.2%
14.3%
567
Sericho Ward
Secondary+
12.4%
9.2%
18.0%
.5% .5%
42.9%
1.4%
15.2%
217
Table 9.6: Gini Coefficient by county Constituency and Ward
County/Constituency/Wards
Pop. Share
Mean
Consump. Share
Gini
1
3,440
1
0.445
Kenya
Rural
0.688
2,270
0.454
0.361
Urban
0.312
6,010
0.546
0.368
Isiolo County
0.005
3,030
0.004
0.431
Isiolo North Constituency
0.004
3,440
0.0039
0.421
Wabera
0.001
4,100
0.0010
0.371
BulaPesa
0.001
5,150
0.0018
0.385
Chari
0.000
1,420
0.0001
0.247
Cherab
0.001
1,980
0.0003
0.279
Ngare Mara
0.000
2,910
0.0001
0.423
Burat
0.001
2,480
0.0005
0.316
Oldonyiro
0.000
1,620
0.0002
0.299
Isiolo South Constituency
0.001
1,620
0.0005
0.311
Garbatulla
0.000
1,610
0.0002
0.340
Kinna
0.000
1,880
0.0002
0.286
Sericho
0.000
1,320
0.0001
0.254
Table 9.7: Education by County, Constituency and Wards
County/Constituency /Wards
None
Primary
Secondary+
Total Pop
Kenya
25.2
52.0
22.8
34,024,396
Rural
29.5
54.7
15.9
23,314,262
Urban
15.8
46.2
38.0
10,710,134
Isiolo County
51.1
36.1
12.9
125,192
Isiolo North Constituency
47.1
37.3
15.7
86,578
Wabera
26.8
44.1
29.1
14,694
BulaPesa
24.3
46.8
29.0
20,127
Chari
52.9
40.9
6.2
4,244
Cherab
53.9
39.0
7.1
13,885
Ngare Mara
61.4
27.0
11.6
4,286
25
Exploring Kenya’s Inequality
Burat
53.0
38.9
8.1
15,884
Oldonyiro
82.8
13.9
3.3
13,458
Isiolo South Constituency
60.0
33.4
6.6
38,614
Garbatulla
67.7
26.9
5.4
14,575
Kinna
55.7
36.8
7.5
13,187
Sericho
54.7
38.2
7.0
10,852
Table 9.8: Education for Male and Female Headed Households by County, Constituency and Ward
County/Constituency/Wards
None
Primary
Secondary+
Total Pop
None
Primary
Male
Kenya
23.5
Rural
Secondary+
Total Pop
Female
51.8
24.7
16,819,031
26.8
52.2
21.0
17,205,365
27.7
54.9
17.4
11,472,394
31.2
54.4
14.4
11,841,868
Urban
14.4
45.2
40.4
5,346,637
17.2
47.2
35.6
5,363,497
Isiolo County
48.2
36.7
15.1
62,968
53.9
35.5
10.6
62,224
Isiolo North Constituency
43.1
38.5
18.4
42,147
50.8
36.0
13.1
44,431
Wabera
23.4
43.8
32.8
7,108
30.0
44.4
25.6
7,586
BulaPesa
21.3
46.7
32.0
9,654
27.0
46.8
26.2
10,473
Chari
49.6
42.3
8.2
2,111
56.2
39.6
4.3
2,133
Cherab
49.9
40.6
9.5
6,849
57.8
37.5
4.7
7,036
Ngare Mara
53.4
28.4
18.2
2,192
69.9
25.5
4.6
2,094
Burat
48.9
40.9
10.2
7,727
56.9
37.1
6.1
8,157
Oldonyiro
77.5
17.9
4.6
6,506
87.8
10.2
2.0
6,952
Isiolo South Constituency
58.5
33.0
8.5
20,821
61.7
34.0
4.4
17,793
Garbatulla
65.9
26.8
7.3
7,617
69.8
26.9
3.4
6,958
Kinna
55.2
35.4
9.4
7,379
56.4
38.5
5.1
5,808
Sericho
53.2
38.0
8.9
5,825
56.6
38.5
4.9
5,027
Table 9.9: Cooking Fuel by County, Constituency and Wards
County/Constituency/Wards
Electricity
Paraffin
LPG
Biogas
Firewood
Charcoal
Solar
Other
Kenya
0.8
11.7
5.1
0.7
64.4
17.0
0.1
0.3
Rural
0.2
1.4
0.6
0.3
90.3
7.1
0.1
0.1
Urban
1.8
28.3
12.3
1.4
22.7
32.8
0.0
0.6
Isiolo County
0.5
2.7
2.1
0.4
64.9
29.1
0.1
0.3
30,877
Isiolo North Constituency
0.6
3.5
2.8
0.5
53.5
38.6
0.1
0.3
22,149
Wabera
1.5
6.1
5.8
0.7
14.9
70.6
-
0.4
3,647
BulaPesa
0.6
7.8
3.3
0.9
12.4
74.4
0.0
0.5
6,145
-
-
0.1
0.1
97.8
1.6
-
0.5
1,024
Cherab
0.0
0.2
0.2
0.2
96.3
2.9
0.0
0.2
3,256
Ngare Mara
2.4
1.5
8.7
0.4
72.6
14.2
0.1
0.1
1,133
Chari
26
A PUBLICATION OF KNBS AND SID
Households
8,493,380
5,239,879
3,253,501
Pulling Apart or Pooling Together?
Burat
0.4
1.3
2.4
0.2
70.2
25.1
0.2
0.3
3,822
-
0.4
0.3
0.2
93.2
5.8
0.2
0.1
3,122
Isiolo South Constituency
0.0
0.5
0.3
0.1
93.9
4.9
0.1
0.2
8,728
Garbatulla
0.1
0.6
0.4
0.1
92.2
6.2
0.1
0.3
3,473
Kinna
0.1
0.5
0.1
0.1
95.5
3.5
0.2
0.1
2,908
-
0.2
0.3
0.1
94.5
4.7
0.0
0.2
2,347
Oldonyiro
Sericho
Table 9.10: Cooking Fuel for Male Headed Households by County, Constituency and Wards
County/Constituency/Wards
Electricity
Paraffin
LPG
Biogas
Firewood
Charcoal
Solar
Other
Households
Kenya
0.9
13.5
5.3
0.8
61.4
17.7
0.1
0.4
5,762,320
Rural
0.2
1.6
0.6
0.3
89.6
7.5
0.1
0.1
3,413,616
Urban
1.9
30.9
12.0
1.4
20.4
32.5
0.0
0.7
2,348,704
Isiolo County
0.6
3.4
2.5
0.4
63.4
29.3
0.1
0.3
19,020
Isiolo North Constituency
0.8
4.7
3.5
0.6
49.7
40.2
0.1
0.4
13,062
Wabera
1.8
8.4
6.4
0.8
14.3
67.8
0.0
0.5
2,333
BulaPesa
0.7
9.3
3.5
0.8
12.0
73.1
0.0
0.7
3,841
Chari
0.0
0.0
0.2
0.2
97.4
1.9
0.0
0.3
621
Cherab
0.1
0.3
0.3
0.4
95.3
3.6
0.0
0.2
1,951
Ngare Mara
3.6
2.1
12.3
0.7
60.6
20.4
0.1
0.1
673
Burat
0.4
1.7
3.4
0.3
68.9
24.7
0.2
0.3
2,206
Oldonyiro
0.0
0.7
0.4
0.3
91.1
7.3
0.1
0.1
1,437
Isiolo South Constituency
0.0
0.6
0.3
0.2
93.5
5.2
0.1
0.2
5,958
Garbatulla
0.0
0.9
0.4
0.2
91.8
6.2
0.2
0.4
2,397
Kinna
0.1
0.5
0.1
0.2
94.5
4.3
0.2
0.1
1,952
Sericho
0.0
0.2
0.2
0.1
94.6
4.7
0.0
0.1
1,609
Table 9.11: Cooking Fuel for Female Headed Households by County, Constituency and Wards
County/Constituency/Wards
Electricity
Paraffin
LPG
Biogas
Firewood
Charcoal
Solar
Other
Households
Kenya
0.6
7.9
4.6
0.7
70.6
15.5
0.0
0.1
2,731,060
Rural
0.1
1.0
0.5
0.3
91.5
6.5
0.0
0.1
1,826,263
Urban
1.6
21.7
13.0
1.5
28.5
33.6
0.0
0.3
904,797
Isiolo County
0.3
1.5
1.5
0.3
67.4
28.8
0.1
0.2
11,857
Isiolo North Constituency
0.4
1.8
1.8
0.4
59.0
36.3
0.1
0.2
9,087
Wabera
0.8
2.1
4.6
0.7
16.1
75.6
-
0.2
1,314
BulaPesa
0.6
5.3
3.0
1.1
13.0
76.7
0.0
0.2
2,304
Chari
-
-
-
-
98.3
1.0
-
0.7
403
Cherab
-
-
0.2
-
97.7
1.8
0.1
0.2
1,305
Ngare Mara
0.7
0.7
3.5
-
90.0
5.2
-
-
Burat
0.4
0.8
1.1
0.1
71.8
25.6
0.1
0.2
460
1,616
Oldonyiro
-
0.1
0.1
0.1
95.1
4.5
0.2
0.1
1,685
Isiolo South Constituency
0.1
0.2
0.3
0.0
94.8
4.3
0.1
0.1
2,770
Garbatulla
0.2
0.1
0.5
0.1
92.9
6.0
-
0.2
1,076
27
Exploring Kenya’s Inequality
Kinna
-
0.4
-
-
97.4
2.0
0.2
-
956
Sericho
-
0.1
0.5
-
94.2
4.7
0.1
0.3
738
Table 9.12: Lighting Fuel by County, Constituency and Wards
County/Constituency/Wards
Electricity
Pressure Lamp
Lantern
Tin Lamp
Gas Lamp
Fuelwood Solar
Other
Households
Kenya
22.9
0.6
30.6
38.5
0.9
4.3
1.6
0.6
5,762,320
Rural
5.2
0.4
34.7
49.0
1.0
6.7
2.2
0.7
3,413,616
Urban
51.4
0.8
23.9
21.6
0.6
0.4
0.7
0.6
2,348,704
Isiolo County
18.7
0.5
30.8
19.6
2.5
23.3
1.4
3.3 19,020
Isiolo North Constituency
25.7
0.5
24.8
22.0
2.7
21.2
1.3
1.8 13,062
Wabera
53.8
0.7
24.0
18.9
0.3
0.5
1.8
0.1 2,333
BulaPesa
49.5
0.3
26.3
22.5
0.2
0.0
0.9
0.2 3,841
Chari
0.1
0.2
32.4
39.4
4.4
12.7
1.3
9.6 621
Cherab
4.6
0.0
42.4
19.4
8.3
15.4
2.0
7.9 1,951
24.0
0.1
10.2
23.8
0.1
41.0
0.8
0.0 673
Burat
7.1
1.4
26.1
35.0
6.4
22.4
1.3
0.4 2,206
Oldonyiro
0.2
0.0
5.5
5.0
0.6
87.5
0.9
0.3 1,437
Isiolo South Constituency
0.7
0.6
46.2
13.4
2.0
28.5
1.5
7.0 5,958
Garbatulla
0.8
1.1
33.3
13.7
0.5
37.6
2.1
10.8 2,397
Kinna
1.0
0.3
43.9
21.4
4.3
25.4
1.1
2.5 1,952
Sericho
0.1
0.2
68.3
3.1
1.5
18.9
1.2
6.8 1,609
Ngare Mara
Table 9.13: Lighting Fuel for Male Headed Households by County, Constituency and Wards
County/Constituency/Wards
Electricity
Pressure Lamp
Lantern
Tin Lamp
Gas Lamp
Fuelwood
Solar
Other
Households
Kenya
24.6
0.6
30.4
36.8
0.9
4.2
1.7
0.7
5,762,320
Rural
5.6
0.5
35.3
47.5
1.1
6.8
2.4
0.7
3,413,616
Urban
52.4
0.9
23.3
21.2
0.6
0.4
0.7
0.7
2,348,704
Isiolo County
20.1
0.5
30.1
18.8
2.2
23.1
1.4
3.7 19,020
Isiolo North Constituency
29.0
0.5
24.6
22.0
2.4
18.0
1.3
2.2 13,062
Wabera
55.9
0.6
22.4
18.8
0.2
0.4
1.7
0.1 2,333
BulaPesa
51.0
0.4
24.9
22.2
0.2
0.0
0.9
0.3 3,841
28
A PUBLICATION OF KNBS AND SID
Pulling Apart or Pooling Together?
Chari
0.2
0.2
27.7
39.1
4.8
16.4
1.1
Cherab
4.8
0.0
40.7
17.9
7.0
17.5
2.2
9.8 1,951
36.3
0.1
12.3
20.4
0.0
30.2
0.7
0.0 673
Burat
8.1
1.5
25.9
34.7
5.9
22.1
1.3
0.6 2,206
Oldonyiro
0.2
0.0
7.4
5.8
0.8
84.1
1.3
0.5 1,437
Isiolo South Constituency
0.8
0.6
42.2
11.8
1.7
34.4
1.5
7.0 5,958
Garbatulla
1.0
1.2
28.6
12.5
0.5
43.6
2.0
10.7 2,397
Kinna
1.0
0.3
40.8
18.5
3.6
32.4
1.0
2.4 1,952
Sericho
0.1
0.2
64.2
2.7
1.4
23.1
1.2
7.2 1,609
Ngare Mara
10.5 621
Table 9.14: Lighting Fuel for Female Headed Households by County, Constituency and Wards
County/Constituency/Wards
Electricity
Pressure
Lamp
Lantern
Tin Lamp
Gas Lamp
Fuelwood
Solar
Other
Households
Kenya
19.2
0.5
31.0
42.1
0.8
4.5
1.4
0.5
2,731,060
Rural
4.5
0.4
33.7
51.8
0.8
6.5
1.8
0.5
1,826,263
Urban
48.8
0.8
25.4
22.6
0.7
0.6
0.6
0.5
904,797
Isiolo County
16.3
0.4
32.1
20.9
3.0
23.5
1.3
2.5
11,857
Isiolo North Constituency
21.1
0.4
25.1
22.1
3.1
25.8
1.2
1.2
9,087
Wabera
50.2
0.8
26.8
19.1
0.5
0.5
2.0
0.1
1,314
BulaPesa
46.9
0.2
28.6
23.1
0.2
-
0.9
0.1
2,304
Chari
-
0.2
39.7
39.7
3.7
6.9
1.5
8.2
403
Cherab
4.3
0.1
44.9
21.6
10.1
12.3
1.7
5.1
1,305
Ngare Mara
6.1
-
7.2
28.9
0.2
56.7
0.9
Burat
5.8
1.2
26.4
35.5
7.1
22.8
1.2
0.1
1,616
Oldonyiro
0.1
-
3.9
4.3
0.4
90.4
0.7
0.2
1,685
Isiolo South Constituency
0.6
0.5
54.9
16.9
2.7
16.0
1.6
6.8
2,770
Garbatulla
0.4
1.0
43.8
16.5
0.6
24.4
2.2
11.1
1,076
Kinna
1.2
0.2
50.2
27.2
5.9
11.3
1.4
2.7
956
Sericho
0.1
0.3
77.1
4.1
1.8
9.8
1.1
5.8
738
-
460
29
Exploring Kenya’s Inequality
Table 9.15: Main material of the Floor by County, Constituency and Wards
County/Constituency/ wards
Cement
Tiles
Wood
Earth
Other
Households
Kenya
41.2
1.6
0.7
56.0
0.5
8,493,380
Rural
22.1
0.3
0.7
76.5
0.4
5,239,879
Urban
71.8
3.5
0.9
23.0
0.8
3,253,501
Isiolo County
29.0
0.5
0.4
69.9
0.2
30,877
Isiolo North Constituency
37.9
0.7
0.4
60.7
0.2
22,149
Wabera
67.6
2.6
0.5
29.2
0.1
3,647
BulaPesa
73.8
0.7
0.7
24.8
0.1
6,145
Chari
1.3
-
0.6
97.8
0.4
1,024
Cherab
3.9
0.0
0.2
95.2
0.6
3,256
Ngare Mara
29.7
0.4
0.1
69.5
0.4
1,133
Burat
20.4
0.3
0.6
78.6
0.1
3,822
Oldonyiro
4.5
0.3
0.1
95.1
0.1
3,122
Isiolo South Constituency
6.3
0.1
0.3
93.0
0.3
8,728
Garbatulla
7.2
0.2
0.3
92.1
0.2
3,473
Kinna
7.1
0.0
0.2
92.1
0.6
2,908
Sericho
3.8
0.1
0.3
95.5
0.2
2,347
Table 9.16: Main Material of the Floor in Male and Female Headed Households by County, Constituency and Ward
County/Constituency/ wards
Cement
Tiles
Wood
Earth
Other
Households
Cement
Tiles
Kenya
42.8
1.6
0.8
54.2
0.6
5,762,320
37.7
1.4
0.7
59.8
0.5
2,731,060
Rural
22.1
0.3
0.7
76.4
0.4
3,413,616
22.2
0.3
0.6
76.6
0.3
1,826,263
Urban
72.9
3.5
0.9
21.9
0.8
2,348,704
69.0
3.6
0.9
25.8
0.8
904,797
Isiolo County
30.6
0.6
0.4
68.1
0.3
19,020
26.3
0.5
0.4
72.7
0.1
11,857
Isiolo North Constituency
41.8
0.8
0.5
56.7
0.3
13,062
32.3
0.6
0.4
66.6
0.1
9,087
Wabera
68.8
2.6
0.5
28.1
0.1
2,333
65.5
2.7
0.5
31.1
0.2
1,314
BulaPesa
75.4
0.8
0.7
23.1
0.1
3,841
71.1
0.5
0.7
27.7
0.1
2,304
Chari
1.3
-
0.8
97.3
0.6
621
1.2
-
0.2
98.5
-
403
Cherab
4.2
0.1
0.3
94.5
1.0
1,951
3.4
-
0.1
96.4
0.1
1,305
Ngare Mara
44.0
0.4
-
54.8
0.7
673
8.7
0.2
0.2
90.9
-
460
Burat
21.5
0.3
0.5
77.6
0.0
2,206
18.9
0.2
0.7
80.1
0.1
1,616
Oldonyiro
6.6
0.3
0.1
92.8
0.1
1,437
2.7
0.2
0.2
97.0
-
1,685
Isiolo South Constituency
6.2
0.1
0.3
93.1
0.3
5,958
6.5
0.2
0.2
92.8
0.3
2,770
Garbatulla
7.0
0.1
0.3
92.4
0.2
2,397
7.8
0.4
0.4
91.4
0.1
1,076
Kinna
6.8
-
0.3
92.4
0.5
1,952
7.6
0.1
0.1
91.4
0.7
956
Sericho
4.2
0.1
0.4
95.0
0.3
1,609
3.0
0.1
0.1
96.7
-
738
Male
30
A PUBLICATION OF KNBS AND SID
Wood
Earth Other
Households
Female
Pulling Apart or Pooling Together?
Table 9.17: Main Roofing Material by County Constituency and Wards
County/Constituency/Wards
Corrugated
Iron Sheets
Tiles
Concrete
Asbestos
sheets
Grass
Makuti
Tin
Mud/Dung
Other
Households
73.5
2.2
3.6
2.2
13.3
3.2
0.3
0.8
1.0
8,493,380
70.3
0.7
0.2
1.8
20.2
4.2
0.2
1.2
1.1
5,239,879
78.5
4.6
9.1
2.9
2.1
1.5
0.3
0.1
0.9
3,253,501
Isiolo County
60.6
0.7
0.3
1.5
20.8
5.9
1.8
3.4
5.1 30,877
Isiolo North Constituency
66.3
0.6
0.4
2.0
12.4
4.3
2.5
4.7
6.8 22,149
Wabera
92.4
2.5
1.6
2.6
0.7
0.0
0.1
0.0
0.1
3,647
BulaPesa
96.4
0.2
0.6
2.5
0.1
0.1
0.0
0.0
0.0
6,145
Chari
60.5
0.2
0.0
0.1
22.1
14.9
0.0
0.0
2.1
1,024
Cherab
55.3
0.2
0.0
0.3
25.4
12.3
0.0
0.0
6.4
3,256
Ngare Mara
28.0
0.4
0.1
8.6
41.0
1.5
0.2
8.6
11.6
1,133
Burat
62.3
0.5
0.0
1.8
25.0
1.5
1.3
3.4
4.2
3,822
8.6
0.0
0.1
0.6
7.5
10.3
15.7
25.9
31.3
3,122
Isiolo South Constituency
46.2
0.8
0.0
0.1
42.0
9.8
0.1
0.1
1.0 8,728
Garbatulla
33.9
1.4
0.0
0.0
51.4
11.9
0.1
0.1
1.2 3,473
Kinna
48.0
0.1
0.0
0.1
43.9
7.4
0.1
0.1
0.3 2,908
Sericho
61.9
0.8
0.0
0.3
25.9
9.6
0.0
0.0
1.4 2,347
Households
Kenya
Rural
Urban
Oldonyiro
Table 9.18: Main Roofing Material in Male Headed Households by County, Constituency and Wards
County/Constituency/ Wards
Kenya
Rural
Urban
Corrugated Iron
Sheets
73.0
69.2
78.5
Tiles
Concrete
Asbestos
sheets
Grass
Makuti
Tin
Mud/
Dung
Other
2.3
3.9
2.3
13.5
3.2
0.3
0.5
1.0
5,762,320
0.8
0.2
1.8
21.5
4.4
0.2
0.9
1.1
3,413,616
4.6
9.3
2.9
2.0
1.4
0.3
0.1
0.9
2,348,704
Isiolo County
60.4
0.8
0.3
1.7
22.2
5.9
1.4
2.5
4.7
19,020
Isiolo North Constituency
69.0
0.7
0.5
2.4
11.5
4.0
2.0
3.6
6.2
13,062
Wabera
92.8
2.6
1.7
2.3
0.4
0.0
0.0
-
0.1
2,333
BulaPesa
96.1
0.2
0.7
2.8
0.1
0.1
0.0
-
0.0
3,841
Chari
56.7
0.2
-
0.2
24.5
15.1
-
-
3.4
621
31
Exploring Kenya’s Inequality
Cherab
50.7
0.2
-
0.5
26.7
13.4
0.1
-
8.5
Ngare Mara
36.6
0.7
0.1
12.3
31.9
1.3
0.3
6.7
10.0
Burat
63.6
0.8
-
1.7
23.4
1.6
1.3
2.8
4.9
2,206
Oldonyiro
12.0
-
1.2
6.0
8.0
16.2
25.6
31.0
1,437
Isiolo South Constituency
41.5
0.8
-
0.2
45.7
10.3
0.1
0.0
1.3
5,958
Garbatulla
29.3
1.4
-
0.0
55.4
12.1
0.1
0.0
1.7
2,397
Kinna
43.3
0.2
-
0.2
48.7
7.2
0.2
-
0.4
1,952
Sericho
57.7
0.7
-
0.4
27.8
11.3
0.1
-
2.1
1,609
-
1,951
673
Table 9.19: Main Roofing Material in Female Headed Households by County, Constituency and Wards
County/Constituency/
Corrugated
Iron Sheets
Tiles
Concrete
Asbestos sheets
Grass
Makuti
Tin
Mud/
Dung
Other
Households
Wards
Kenya
74.5
2.0
3.0
2.2
1.8
12.7
3.9
0.3
1.8
1.0
2,731,060
1.1
1,826,263
0.9
904,797
72.5
0.7
0.1
Urban
78.6
4.5
8.7
Isiolo County
60.9
0.5
0.3
1.2
18.4
5.8
2.4
4.8
5.9
11,857
Isiolo North Constituency
62.3
0.5
0.4
1.5
13.6
4.9
3.1
6.2
7.6
9,087
Wabera
91.6
2.3
1.5
3.2
1.2
-
0.1
-
0.1
1,314
BulaPesa
97.0
0.2
0.5
2.1
0.1
0.1
0.0
-
-
2,304
Chari
66.5
0.2
-
-
18.4
14.6
-
-
0.2
403
Cherab
62.1
0.2
-
0.2
23.4
10.7
-
0.1
3.3
1,305
Ngare Mara
15.4
-
-
3.0
54.3
1.7
-
11.5
13.9
460
Burat
60.6
0.2
-
1.9
27.1
1.5
1.2
4.2
3.2
1,616
Oldonyiro
2.3
1.6
0.3
1.2
Rural
2.9
17.8
3.2
0.3
0.1
5.6
-
0.1
0.1
8.8
12.3
15.3
26.2
31.5
1,685
Isiolo South Constituency
56.1
0.7
-
0.0
34.1
8.7
-
0.3
0.1
2,770
Garbatulla
44.3
1.3
-
-
42.6
11.3
-
0.4
0.1
1,076
Kinna
57.7
-
-
-
34.1
7.8
-
0.2
0.1
956
Sericho
71.1
0.8
-
0.1
21.7
6.0
-
0.1
0.1
738
32
A PUBLICATION OF KNBS AND SID
Pulling Apart or Pooling Together?
Table 9.20: Main material of the wall by County, Constituency and Wards
County/Constituency/
Stone
Brick/Block
Wards
Mud/
Mud/
Wood
Cement
Wood
only
Corrugated
Iron Sheets
Grass/
Tin
Other
Households
Reeds
Kenya
16.7
16.9
36.5
7.7
11.1
6.7
3.0
0.3
1.2
8,493,380
Rural
5.7
13.8
50.0
7.6
14.4
2.5
4.4
0.3
1.4
5,239,879
Urban
34.5
21.9
14.8
7.8
5.8
13.3
0.8
0.3
0.9
3,253,501
Isiolo County
10.3
6.7
31.1
3.7
22.3
1.2
17.7
4.9
2.1
30,877
Isiolo North Constituency
14.2
8.3
28.1
2.1
29.6
1.5
6.8
6.8
2.7
22,149
Wabera
18.1
21.9
3.0
0.7
53.0
2.4
0.7
0.1
0.1
3,647
BulaPesa
35.3
8.4
6.4
0.6
47.6
1.5
0.1
0.1
0.1
6,145
Chari
0.3
0.6
61.1
1.9
3.8
0.3
26.7
0.1
5.3
1,024
Cherab
0.4
1.3
53.5
1.2
13.1
0.2
26.9
0.0
3.5
3,256
10.4
9.4
58.1
4.0
3.3
10.1
3.0
0.2
1.6
1,133
Burat
4.4
7.2
45.8
4.8
30.4
0.4
2.3
2.3
2.4
3,822
Oldonyiro
0.2
2.8
30.2
3.9
1.1
0.3
6.6
45.0
10.0
3,122
Isiolo South Constituency
0.5
2.6
38.8
7.7
3.8
0.6
45.2
0.1
0.7
8,728
Garbatulla
0.4
3.8
25.0
7.5
2.4
0.5
59.6
0.0
0.8
3,473
Kinna
0.4
2.1
42.7
5.1
3.7
0.8
44.8
0.1
0.3
2,908
Sericho
1.0
1.4
54.5
11.0
6.1
0.5
24.1
0.1
1.2
2,347
Ngare Mara
Table 9.21: Main Material of the Wall in Male Headed Households by County, Constituency and Ward
County/ Constituency/ Wards
Stone
Brick/
Mud/
Mud/
Block
Wood
Cement
Wood only
Corrugated Iron
Sheets
Grass
Tin
/Reeds
Other
Households
Kenya
17.5
16.6
34.7
7.6
11.4
7.4
3.4
0.3
1.2
5,762,320
Rural
5.8
13.1
48.9
7.3
15.4
2.6
5.2
0.3
1.4
3,413,616
Urban
34.6
21.6
14.0
7.9
5.6
14.4
0.7
0.3
0.9
2,348,704
Isiolo County
11.0
7.3
28.2
3.6
22.5
1.5
20.2
3.7
2.1
19,020
Isiolo North
Constituency
15.7
9.5
25.4
1.9
30.6
1.9
7.1
5.3
2.5
13,062
Wabera
18.6
23.4
3.3
0.6
50.8
2.7
0.5
0.0
0.0
2,333
BulaPesa
36.9
8.3
6.1
0.5
46.6
1.4
0.1
0.1
0.1
3,841
Chari
0.3
0.6
58.3
1.3
3.2
0.2
30.0
0.2
6.0
621
Cherab
0.4
1.6
48.4
1.2
15.1
0.2
29.1
-
4.2
1,951
14.6
14.0
44.6
3.0
3.6
15.6
2.2
0.3
2.2
673
4.1
8.3
44.2
4.8
30.4
0.5
2.6
2.2
2.8
2,206
Ngare Mara
Burat
33
Exploring Kenya’s Inequality
Oldonyiro
0.2
4.5
29.8
4.2
1.3
0.6
5.7
44.3
9.3
1,437
Isiolo South
Constituency
0.7
2.4
34.4
7.2
4.5
0.8
49.0
0.1
1.0
5,958
Garbatulla
0.5
3.3
21.1
6.4
3.0
0.7
63.9
0.0
1.0
2,397
Kinna
0.3
2.2
37.9
4.8
4.1
1.1
49.1
0.1
0.4
1,952
Sericho
1.4
1.4
49.9
11.1
7.2
0.6
26.7
0.1
1.7
1,609
Table 9.22: Main Material of the Wall in Female Headed Households by County, Constituency andWard
County/ Constituency
Stone
Kenya
15.0
Rural
Brick/Block
5.4
Urban
34.2
Isiolo County
9.2
Mud/Wood
Mud/Cement
Wood
only
Corrugated
Iron Sheets
Grass/
Reeds
Tin
Other
Households
17.5
40.4
7.9
10.5
5.1
2.1
0.3
1.2
2,731,060
14.9
52.1
8.0
12.6
2.4
2.8
0.4
1.4
1,826,263
22.6
16.9
7.6
6.2
10.5
0.8
0.3
0.9
904,797
5.6
35.8
3.9
22.1
0.7
13.6
6.8
2.3
11,857
Isiolo North Constituency
12.0
6.5
32.0
2.4
28.1
0.9
6.4
8.9
2.9
9,087
Wabera
17.2
19.3
2.5
0.9
56.8
1.9
1.1
0.1
0.1
1,314
BulaPesa
32.6
8.5
7.0
0.8
49.2
1.6
0.1
0.1
0.1
2,304
Chari
0.2
0.5
65.5
2.7
4.7
0.5
21.6
-
4.2
403
Cherab
0.5
0.8
61.1
1.1
10.1
0.2
23.8
-
2.5
1,305
Ngare Mara
4.3
2.8
77.8
5.4
2.8
2.0
4.1
-
0.7
460
Burat
4.9
5.7
47.9
4.7
30.4
0.3
1.9
2.4
1.9
1,616
Oldonyiro
0.2
1.3
30.6
3.6
1.0
0.1
7.3
45.5
10.5
1,685
Isiolo South Constituency
0.3
2.9
48.4
8.7
2.3
0.1
36.9
0.1
0.2
2,770
Garbatulla
0.2
4.8
33.6
9.9
0.9
0.2
50.1
-
0.3
1,076
Kinna
0.5
1.9
52.7
5.8
2.8
0.1
36.1
-
0.1
956
Sericho
0.3
1.4
64.6
10.8
3.8
0.1
18.6
0.3
0.1
738
34
A PUBLICATION OF KNBS AND SID
2.7
3.6
0.9
0.1
0.1
0.1
0.1
0.0
0.0
0.4
0.1
0.3
0.1
0.2
0.1
0.0
Rural
Urban
Isiolo County
Isiolo North
Constituency
Wabera
BulaPesa
Chari
Cherab
Ngare Mara
Burat
Oldonyiro
Isiolo South
Constituency
Garbatulla
Kinna
Sericho
Pond
Kenya
/Wards
County/Constituency
5.4
0.2
0.4
1.7
0.0
0.0
0.0
0.0
0.0
0.0
0.0
0.0
0.5
0.7
3.2
2.4
Dam
0.0
0.0
0.0
0.0
0.0
0.0
0.0
0.0
0.0
0.1
0.0
0.0
0.0
0.5
1.5
1.2
Lake
2.6
26.7
13.1
14.8
11.8
33.5
3.2
0.1
14.6
5.9
0.0
10.3
11.7
9.2
29.6
23.2
River
Stream/
Unprotected
Spring
0.8
3.3
3.6
2.7
1.4
5.8
6.9
0.3
0.0
0.1
0.1
1.7
2.0
1.9
6.4
5.0
2.9
8.7
6.9
40.8
1.9
23.8
21.1
81.5
9.9
16.1
47.4
3.9
0.0
0.6
23.3
22.7
Unprotected
well
Jabia
1.6
0.0
0.0
0.5
0.0
0.1
0.0
0.0
0.0
0.1
0.1
0.1
0.2
0.2
0.4
0.3
0.8
0.3
0.1
0.4
0.0
3.9
0.0
1.2
5.2
5.9
10.0
4.2
3.0
11.8
2.2
5.2
Water vendor
0.0
0.0
2.4
0.9
0.0
0.0
0.0
0.0
0.0
0.6
1.1
0.3
0.5
0.1
0.5
0.4
Other
Unimproved
Sources
Table 9.23: Main Material of the Wall in Female Headed Households by County, Constituency and Ward
52.0
32.5
43.5
42.2
95.2
53.4
26.7
49.0
23.7
12.8
12.0
40.2
40.8
28.3
56.0
47.4
0.1
0.1
0.1
0.1
0.0
0.7
7.3
0.1
0.2
0.2
0.0
0.6
0.4
4.0
9.2
7.6
Protected
Spring
0.7
0.0
3.8
1.6
0.7
0.2
17.5
0.4
0.0
0.0
0.0
1.1
1.3
6.8
8.1
7.7
Protected
Well
5.5
29.9
13.4
16.8
0.3
14.4
46.6
8.9
0.0
0.5
0.8
6.7
9.8
10.7
12.0
11.6
Borehole
1.2
1.1
2.0
1.5
0.0
5.3
0.1
3.5
0.1
10.5
25.9
8.3
6.2
14.7
1.8
5.9
Piped
into
Dwelling
40.5
36.3
37.2
37.8
3.8
25.9
1.7
38.1
76.0
75.9
61.2
43.1
41.5
34.9
12.1
19.2
Piped
0.0
0.0
0.0
0.0
0.0
0.1
0.0
0.1
0.0
0.0
0.1
0.0
0.0
0.5
0.8
0.7
Rain Water
Collection
48.0
67.5
56.5
57.8
4.8
46.6
73.3
51.0
76.3
87.2
88.0
59.8
59.2
71.7
44.0
52.6
Improved
Sources
12,026
14,551
16,120
42,697
15,206
17,916
4,862
15,475
4,773
22,203
16,264
96,699
139,396
11,844,452
26,075,195
37,919,647
No of Individuals
Pulling Apart or Pooling Together?
35
36
A PUBLICATION OF KNBS AND SID
0.1
0.1
0.1
Isiolo North Constituency
Wabera
BulaPesa
0.3
0.2
0.4
0.1
0.0
0.1
0.0
Ngare Mara
Burat
Oldonyiro
Isiolo South Constituency
Garbatulla
Kinna
Sericho
-
0.1
Isiolo County
Cherab
0.8
Urban
-
3.7
Rural
Chari
2.7
Pond
Kenya
County/Constituency/
Wards
4.8
0.1
0.4
1.5
-
-
-
0.1
-
0.1
-
0.0
0.5
0.6
3.1
2.3
Dam
-
-
-
-
-
0.0
-
-
-
-
-
0.0
0.0
0.5
1.4
1.1
Lake
3.0
30.5
15.4
16.9
11.4
34.6
3.5
0.1
16.0
5.9
0.0
10.3
12.5
8.5
29.1
1.1
3.6
4.1
3.1
1.1
5.8
6.7
0.3
-
0.1
0.1
1.6
2.1
1.8
6.3
4.8
Spring
River
22.4
Unprotected
Stream/
40.1
2.1
25.2
21.7
83.0
9.6
16.0
51.1
5.1
0.0
0.9
22.4
22.2
2.8
8.6
6.7
Unprotected
Well
1.3
-
-
0.4
-
0.2
-
-
-
0.1
0.0
0.1
0.2
0.2
0.4
0.4
Jabia
0.8
0.2
0.1
0.3
0.0
3.2
0.1
0.8
7.1
5.4
10.3
4.2
2.9
12.1
2.4
5.6
Water
vendor
Table 9.24: Source of Water of Male headed Household by County Constituency and Ward
-
-
2.2
0.8
-
-
-
-
-
0.6
1.0
0.3
0.5
0.1
0.5
0.4
Other
51.2
36.6
47.3
44.8
96.0
53.5
26.5
52.4
28.1
12.4
12.4
39.1
41.0
27.5
55.6
46.4
Unimproved
Sources
0.1
0.2
0.1
0.1
-
0.4
9.8
0.2
0.1
0.2
-
0.6
0.4
3.8
9.2
7.4
Protected
Spring
0.7
0.1
4.5
1.9
0.6
0.3
16.0
0.4
-
0.0
0.0
1.0
1.3
6.7
8.2
7.7
5.2
27.9
14.1
16.2
0.2
14.7
44.5
11.7
-
0.5
0.8
7.0
10.1
10.8
12.1
11.7
Protected Borehole
Well
1.1
0.8
1.6
1.2
-
5.6
0.3
3.4
-
11.6
27.1
9.2
6.5
14.9
1.9
6.2
Piped into
Dwelling
41.6
34.5
32.3
35.7
3.2
25.4
3.0
31.8
71.8
75.1
59.7
43.1
40.6
35.8
12.2
19.9
Piped
0.0
-
-
0.0
-
0.1
-
0.1
-
0.1
-
0.0
0.0
0.5
0.8
0.7
Rain
Water
Collection
48.8
63.4
52.7
55.2
4.0
46.5
73.5
47.6
71.9
87.6
87.6
60.9
59.0
72.5
44.4
53.6
Improved
Sources
8,558
10,164
11,633
30,355
7,680
10,741
2,695
9,911
3,018
14,314
10,330
58,689
89,044
8,738,595
18,016,471
26,755,066
No. of
Individuals
Exploring Kenya’s Inequality
0.1
BulaPesa
0.1
Sericho
0.5
Garbatulla
-
0.2
Isiolo South Constituency
Kinna
0.2
-
Oldonyiro
Burat
0.5
0.2
Wabera
Ngare Mara
0.1
Isiolo North Constituency
0.1
0.2
Isiolo County
Cherab
1.0
Urban
-
3.4
Rural
Chari
2.8
Pond
Kenya
Wards
County/Constituency/
Dam
6.8
0.3
0.5
2.2
-
-
-
-
-
-
-
-
0.5
0.8
3.5
2.7
Lake
-
-
-
-
-
-
-
-
-
0.2
-
0.0
0.0
0.6
1.6
1.3
River
1.5
18.1
7.2
9.5
12.3
31.8
2.9
-
12.1
5.8
0.0
10.4
10.2
11.1
30.6
25.2
Stream
Unprotected
Spring
0.1
2.6
2.3
1.8
1.8
5.8
7.2
0.2
-
0.1
0.0
1.9
1.9
2.3
6.5
5.3
42.5
1.5
20.1
19.8
79.9
10.3
16.2
40.8
1.9
-
0.1
24.8
23.5
3.4
8.9
7.4
Unprotected Well
Jabia
2.4
-
0.1
0.7
-
0.1
-
-
-
-
0.2
0.0
0.2
0.2
0.3
0.3
Table 9.25: Source of Water of Female headed Household by County, Constituency, and Ward
Water
vendor
0.7
0.6
-
0.4
0.1
5.0
-
1.8
2.1
6.7
9.5
4.2
3.2
11.1
1.8
4.4
Other
-
-
3.0
1.1
-
-
-
-
-
0.7
1.3
0.4
0.5
0.1
0.4
0.3
54.1
23.0
33.7
35.6
94.3
53.1
26.9
42.9
16.1
13.6
11.2
41.8
40.3
30.5
57.0
49.7
Unimproved
Sources
-
-
-
-
0.1
1.0
4.2
-
0.3
0.2
-
0.5
0.4
4.7
9.5
8.1
Protected
Spring
0.5
-
2.0
0.9
0.8
0.1
19.5
0.4
-
0.1
-
1.4
1.2
7.0
8.0
7.7
Protected Well
6.3
34.7
11.4
18.3
0.4
14.1
49.3
3.8
-
0.4
0.8
6.3
9.2
10.5
11.5
11.3
Borehole
1.3
1.7
3.2
2.1
-
4.8
-
3.7
0.2
8.4
23.9
6.9
5.8
14.2
1.6
5.1
Piped into
Dwelling
37.7
40.5
49.7
43.1
4.5
26.8
0.2
49.2
83.3
77.3
63.9
43.0
43.0
32.5
11.7
17.5
Piped
-
-
0.1
0.0
-
0.1
-
-
-
-
0.2
0.0
0.0
0.6
0.8
0.7
Rain
Water
Collection
45.9
77.0
66.3
64.4
5.7
46.9
73.1
57.1
83.9
86.4
88.8
58.2
59.7
69.5
43.0
50.3
Improved
Sources
3,468
4,387
4,487
12,342
7,526
7,175
2,167
5,564
1,755
7,889
5,934
38,010
50,352
3,105,857
8,058,724
11,164,581
No. of
Individuals
Pulling Apart or Pooling Together?
37
Exploring Kenya’s Inequality
Table 9.26: Human Waste Disposal by County, Constituency and Ward
County/ Constituency
Main Sewer
Septic
Tank
Cess
Pool
VIP
Latrine
Pit
Latrine
Improved
Sanitation
Pit Latrine
Uncovered
Bucket
Bush
Other
Unimproved
Sanitation
Number of HH
Memmbers
37,919,647
Kenya
5.91
2.76
0.27
4.57
47.62
61.14
20.87
0.27
17.58
0.14
38.86
Rural
0.14
0.37
0.08
3.97
48.91
53.47
22.32
0.07
24.01
0.13
46.53
26,075,195
Urban
18.61
8.01
0.70
5.90
44.80
78.02
17.67
0.71
3.42
0.18
21.98
11,844,452
4.14
1.26
0.05
2.63
32.02
40.11
12.91
0.11
46.52
0.36
59.89
139,396
Isiolo County
Isiolo North
Constituency
5.90
1.79
0.05
2.24
33.06
43.04
15.62
0.11
41.01
0.22
56.96
96,699
22.28
3.90
0.10
2.53
17.79
46.61
47.07
0.20
5.20
0.92
53.39
16,264
BulaPesa
8.73
2.51
0.08
2.77
66.60
80.69
17.06
0.20
1.98
0.07
19.31
22,203
Chari
0.04
0.04
0.10
1.47
38.93
40.58
11.86
0.08
47.22
0.25
59.42
4,773
Cherab
0.10
0.02
0.00
1.89
36.22
38.23
6.66
0.00
55.11
0.00
61.77
15,475
Ngare Mara
1.21
6.48
0.00
1.71
16.15
25.55
0.35
0.08
73.88
0.14
74.45
4,862
Burat
0.36
1.11
0.02
2.43
33.30
37.21
8.82
0.08
53.80
0.09
62.79
17,916
Oldonyiro
0.00
0.15
0.05
1.68
0.49
2.37
3.08
0.07
94.44
0.05
97.63
15,206
Isiolo South
Constituency
0.17
0.06
0.06
3.52
29.67
33.48
6.77
0.09
58.99
0.68
66.52
42,697
Garbatulla
0.00
0.15
0.11
5.33
21.25
26.84
2.35
0.02
70.79
0.00
73.16
16,120
Kinna
0.05
0.02
0.03
3.36
27.88
31.34
7.59
0.18
59.89
1.00
68.66
14,551
Sericho
0.53
0.00
0.04
1.27
43.11
44.95
11.69
0.07
42.08
1.20
55.05
12,026
Wabera
Table 9.27:Human Waste Disposal in Male Headed household by County, Constituency and Ward
County/ Constituency/
wards
Main
Sewer
Septic
Tank
Cess
Pool
VIP
Latrine
Pit
Latrine
Improved
Sanitation
Pit Latrine
Uncovered
Bucket
Bush
Other
Unimproved
Sanitation
Number
of HH
Memmbers
Kenya
6.30
2.98
0.29
4.60
47.65
61.81
20.65
0.28
17.12
0.14
38.19
26,755,066
Rural
0.15
0.40
0.08
3.97
49.08
53.68
22.22
0.07
23.91
0.12
46.32
18,016,471
Urban
18.98
8.29
0.73
5.89
44.69
78.58
17.41
0.70
3.13
0.18
21.42
8,738,595
Isiolo County
4.22
1.40
0.07
2.61
31.44
39.74
12.53
0.10
47.24
0.38
60.26
89,044
Isiolo North Constituency
6.31
2.09
0.06
2.34
33.67
44.48
16.00
0.12
39.18
0.21
55.52
58,689
Wabera
22.18
4.09
0.10
2.83
18.03
47.22
46.65
0.27
5.13
0.73
52.78
10,330
BulaPesa
9.12
2.61
0.08
2.49
66.27
80.56
17.38
0.18
1.77
0.10
19.44
14,314
Chari
0.00
0.07
0.17
2.15
36.35
38.73
9.05
0.00
51.82
0.40
61.27
3,018
Cherab
0.09
0.01
0.00
1.77
32.78
34.65
5.96
0.00
59.39
0.00
65.35
9,911
Ngare Mara
1.93
9.80
0.00
1.52
17.92
31.17
0.30
0.00
68.27
0.26
68.83
2,695
38
A PUBLICATION OF KNBS AND SID
Pulling Apart or Pooling Together?
Burat
0.43
1.40
0.04
2.60
33.05
37.51
8.73
0.12
53.49
0.15
62.49
10,741
Oldonyiro
0.00
0.21
0.09
2.17
0.42
2.89
3.59
0.05
93.46
0.00
97.11
7,680
Isiolo South Constituency
0.17
0.07
0.07
3.13
27.14
30.59
5.82
0.07
62.82
0.71
69.41
30,355
Garbatulla
0.00
0.15
0.15
4.70
18.29
23.30
2.14
0.02
74.55
0.00
76.70
11,633
Kinna
0.00
0.03
0.00
2.82
26.55
29.41
6.16
0.18
63.13
1.12
70.59
10,164
Sericho
0.62
0.00
0.06
1.37
39.86
41.90
10.41
0.00
46.51
1.18
58.10
8,558
Table 9.28: Human Waste Disposal in Female Headed Household by County, Constituency and Ward
County/ Constituency
Main
Sewer
Septic
Tank
Cess
Pool
VIP
Latrine
Pit Latrine
Improved
Sanitation
Pit
Latrine
Uncovered
Bucket
Bush
Other
Unimproved
Sanitation
Number
of HH
Memmbers
Kenya
5.0
2.2
0.2
4.5
47.6
59.5
21.4
0.3
18.7
0.2
40.5
11,164,581.0
Rural
0.1
0.3
0.1
4.0
48.5
53.0
22.6
0.1
24.2
0.1
47.0
8,058,724.0
Urban
17.6
7.2
0.6
5.9
45.1
76.4
18.4
0.7
4.3
0.2
23.6
3,105,857.0
Isiolo
4.0
1.0
0.0
2.7
33.0
40.8
13.6
0.1
45.2
0.3
59.2
50,352.0
Isiolo North
5.3
1.3
0.0
2.1
32.1
40.8
15.0
0.1
43.8
0.2
59.2
38,010.0
22.5
3.6
0.1
2.0
17.4
45.6
47.8
0.1
5.3
1.3
54.4
5,934.0
BulaPesa
8.0
2.3
0.1
3.3
67.2
80.9
16.5
0.2
2.3
0.0
19.1
7,889.0
Chari
0.1
0.0
0.0
0.3
43.4
43.8
16.7
0.2
39.3
0.0
56.2
1,755.0
Cherab
0.1
0.0
0.0
2.1
42.3
44.6
7.9
0.0
47.5
0.0
55.4
5,564.0
Ngare Mara
0.3
2.4
0.0
1.9
13.9
18.6
0.4
0.2
80.8
0.0
81.4
2,167.0
Burat
0.3
0.7
0.0
2.2
33.7
36.8
8.9
0.0
54.3
0.0
63.2
7,175.0
Oldonyiro
0.0
0.1
0.0
1.2
0.6
1.8
2.6
0.1
95.4
0.1
98.2
7,526.0
Isiolo South
0.2
0.0
0.0
4.5
35.9
40.6
9.1
0.1
49.6
0.6
59.4
12,342.0
Garbatulla
0.0
0.1
0.0
7.0
28.9
36.0
2.9
0.0
61.0
0.0
64.0
4,487.0
Kinna
0.2
0.0
0.1
4.6
31.0
35.8
10.9
0.2
52.4
0.7
64.2
4,387.0
Sericho
0.3
0.0
0.0
1.0
51.1
52.5
14.9
0.3
31.2
1.2
47.5
3,468.0
Wabera
39
© Copyright 2026 Paperzz