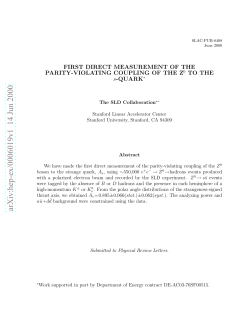
Atmospheric Environment 34 (2000) 2529 } 2537
Gas-particle partitioning of PCDD/Fs in daily air samples
Rainer Lohmann*, Robert G.M. Lee, Nicholas J.L. Green, Kevin C. Jones
Environmental Science Department, Institute of Environmental and Natural Sciences, Lancaster University, Lancaster LA1 4YQ, UK
Received 16 July 1999; received in revised form 25 October 1999; accepted 23 November 1999
Abstract
Eight short-term (24}48 h) air samples were taken at Lancaster, UK, to study the gas}particle partitioning of
PCDD/Fs. Sampling dates in autumn 1997 were selected with a view to minimising temperature #uctuation during the
sampling events. RCl DD/Fs (RTEQ) for the "rst 6 samples were 1.1}3.6 pg m\ (15}44 fg TEQ m\), typical of a rural
U
site; two other samples had &Cl DD/Fs of 18 and 7.9 pg m\, with 320 and 100 fg TEQ m\. The observed
U
gas}particle distributions varied from 0}34% particle-bound for Cl DD/Fs to '70% for Cl DD/Fs. Measured
U
particle-bound fractions were compared to theoretical estimates of their distribution based on the Junge}Pankow model
using three di!erent reported sets of vapour pressures. The best correlation was obtained using vapour pressures derived
from measured GC-retention time indices (Eitzer and Hites, 1988). Plotting log partition coe$cient (K ) versus log
sub-cooled liquid vapour pressure (p ) gave excellent correlations with slopes of roughly !1 for all homologue groups.
*
2, 3, 7, 8-substituted congeners showed slopes of !1 for the "rst "ve sampling events. It is proposed that kinetic factors
at the low ambient temperatures, coupled with additional emissions during the last sampling events resulted in
non-equilibrium partitioning. 2000 Elsevier Science Ltd. All rights reserved.
Keywords: Gas-particle partitioning; Junge}Pankow; Dioxins; Furans; Vapour pressure
1. Introduction
The fate of polychlorinated dibenzo-p-dioxins and
dibenzofurans (PCDD/Fs) in the atmosphere is primarily
governed by their gas}particle partitioning. Wet and dry
deposition, photolysis and reaction with OH radicals act
di!erently on gas- and particle-bound PCDD/Fs. Only
PCDD/Fs in the gaseous phase are believed to be depleted due to degradation reactions, while the particle
properties determine the transport of particulate-bound
PCDD/Fs away from sources.
There are few reported PCDD/F gas}particle distribution studies to date, probably because of the analytical
di$culties of determining the ultra-trace levels of
PCDD/Fs in ambient air. These very low levels have
meant that previous studies have taken air samples over
* Corresponding author. Tel.: #44-1524-593972; fax: #441524-593985.
E-mail address: [email protected] (R. Lohmann)
sampling periods of several days to weeks (Eitzer and
Hites, 1989; Hippelein et al., 1996; Kaupp and McLachlan, 1999; Lee and Jones, 1999), giving &averaged' partitioning data for di!erent temperatures, air mass origins,
etc. In this study we wanted to obtain partitioning data
for the full suite of di- to octa-CDD/Fs with a series of
short-term (24 or 48 h) samples at Lancaster, UK, in
autumn 1997. Sampling events were chosen to minimise
sampling artefacts, notably temperature #uctuation and
air mass origin during sampling. An adsorptive partitioning model developed by Junge}Pankow (Junge, 1977;
Pankow, 1987) is often used to calculate the theoretical
partitioning of semi-volatile organic compounds (e.g. van
Pul et al., 1998). However, a discrepancy between predicted and measured particle-bound fractions has been
observed, possibly due to uncertainties in the sub-cooled
liquid vapour pressure of PCDD/Fs (Lee and Jones,
1999). We therefore compared three di!erent reported
datasets of PCDD/F vapour pressures for our measured
gas}particle distributions of PCDD/Fs. The di!erent
vapour pressure data used were obtained by (i) the
gas-phase saturation method by Rordorf (1987);
1352-2310/00/$ - see front matter 2000 Elsevier Science Ltd. All rights reserved.
PII: S 1 3 5 2 - 2 3 1 0 ( 9 9 ) 0 0 5 1 5 - 4
2530
R. Lohmann et al. / Atmospheric Environment 34 (2000) 2529}2537
(ii) GC-retention index data by Eitzer and Hites (1988)
and (iii) a physico-chemical prediction model by Govers
and Krop, (1998). Vapour pressure data of the latter two
were used for log K !log p correlations.
*
In summary, the objectives of the study were to: (i) use
sensitive analytical procedures to quantify the full range
of PCDD/Fs in both the gas and particle phase of shortterm air samples; (ii) investigate their partitioning behaviour using the Junge}Pankow adsorption model. This
required us to compare the suitability of 3 separate
datasets reporting (sub-cooled liquid) vapour pressures;
(iii) consider the in#uence of various factors (temperature,
air mass origin, etc.) on the partitioning and (iv) comment
on the suitability/adequacy of the Junge}Pankow
adsorption approach for inclusion in atmospheric transport models.
2. Experimental section
ing followed by fractionation on basic alumina (see
Lohmann et al., 1999a for more details). The particulate fraction was put through an additional carbon
column clean-up step. The PUF plugs were spiked
with the 17 C -2, 3, 7, 8-substituted congeners and
3 C !Cl DD/F congeners prior to sampling. Be
fore extraction the GFFs were spiked with the 20 labelled
congeners described above. Analysis was performed by
HRGC-HRMS using a HP6890 GC connected to a Micromass Autospec Ultima, operated at a resolving power
of &10,000. Homologue groups were quanti"ed on
a 30 m DB5-column and congener-speci"c data was obtained using a 60 m SP-2331 column. Average recoveries
for the 2, 3, 7, 8-substituted congeners ranged from
70}95%; recoveries for C -2, 8-DiCDF, C -2, 7
DiCDD and C -2,3,7-TriCDD were between 45 and
60%. The total suspended particulate matter (TSP) was
measured with an additional particulate sampler; GFF
sheets were equilibrated in controlled humidity 24 h before and after sampling and weighed.
2.1. Air sampling
2.3. Quality control
Eight air samples (775}1252 m) were taken at Lancaster University's "eld station (5432N, 2345W) on the
northwest coast of the UK during November and December 1997. Sampling events were chosen to minimise
#uctuations in the ambient temperature (i.e. during
high-pressure systems) with sampling times kept as short
as possible to reduce sampling artefacts due to changes in
atmospheric conditions and PCDD/F concentrations.
2 or 3 hi-volume air samplers were run concurrently
through each sampling event to allow collection of su$cient air volumes for the eight separate samples. Graseby
hi-vols were used, equipped with a Whatman glass "bre
"lter (GFF, 10 cm diameter) and a polyurethane foam
plug (PUF, 5cm length, 6.25 cm diameter). Volumetric
sampling #ows were on average 0.22 m min\
(0.15}0.26 m min\). The samplers were calibrated at
the beginning and end of each sampling programme and
showed no variation in the air #ow over the sampling
period.
2.2. Analytical procedure
GFFs were combusted overnight and sealed in aluminium foil prior to use. PUF plugs were pre-extracted in
DCM for 16 h, vacuum-dried in dessicators and stored
in solvent-rinsed glass jars prior to usage. Sampling modules were assembled and taken apart immediately prior
and after deployment in the "eld. Each sample code
(A-H) consisted of PUFs/GFFs combined from 3 hi-vols
(except samples A and E - 2 hi-vols) employed concurrently; the combined PUFs and combined GFFs were
analysed separately. PUF plugs were extracted with
DCM for 16 h, GFFs were extracted with toluene for
16 h. The extracts were cleaned up by acid silica re#ux-
Field, laboratory blanks and reference soils were
routinely incorporated in the analytical procedure.
Method detection limits were 0.5 pg sample\ for
the 2, 3, 7, 8-substituted tetra- to hexa CDD/Fs, 1 pg
sample\ for the hepta-congeners and OCDF and 5 pg
sample\ for OCDD. Detection limits were derived from
the blanks and quanti"ed as the sum of the baseline of the
noise or as the mean concentration in the blank plus
three times the standard deviation of the mean concentration. In the summer of 1997, "ve air samplers (each
taking &700 m) were employed concurrently at the
Lancaster site. The relative standard deviations of
R2, 3, 7, 8-substituted congeners and homologue groups
were 10 and 11%, respectively (Lohmann et al., 1999a).
Combined daily samples B#C and G#H were compared to additional, simultaneously sampled two-day
samples: di!erences for 2,3,7,8-substituted congeners and
Cl DD/Fs averaged 10%. Breakthrough from the "rst
U
PUF to a second PUF plug was investigated in summer
samples with &1000 m and (10% of any congener
found on the second PUF.
2.4. Sampling artefacts
For hi-vol air sampling, gas and particulate phase are
operationally de"ned: the compounds retained by the
GFF as &particulate-bound' and compounds trapped by
the PUF as vapour phase. Known hi-vol sampling artefacts include: (i) particle blow-o! from the GFF, (ii)
adsorption to the GFF (iii) &stripping' of compounds
from the particle phase onto the PUF. Pankow and
Bidleman (1992) noted that changes in the analytes' ambient air concentration and/or temperature during the
3}4.12
808
1.5$2.5
88%
*
26
Scotl.}Scand.
320
2}3.12
830
!0.3$2.5
100%
0.3
29
Scotl.
32
22}24.11
1252
7$2.5
90%
3.8
22
France}S-Engl.
44
21}22.11
971
7$3.5
89%
*
33
S-Engl.
44
G
F
E
D
C
20}21.11
1127
7.3$2.5
78%
*
30
Ireland}Germ.
33
Kutz et al. (1990).
Sampling dates, air volumes, meteorological parameters, TSP-levels, air mass origins and RTEQ-values
are given in Table 1. Samples A}F showed low RTEQ
(I-TEQ, Kutz et al., 1990) concentrations, typical for
a rural site, with 15}44 fg TEQ m\. Samples G and
17}19.11
1184
12.5$3
87%
2.5
22
France}S-Engl.
15
3.1. Air concentrations
Sampling date
Air volume (m)
Temperature (3C)
Rel. humidity
Rain (mm)
TSP (lg m\)
Air mass origin
RTEQ (fg m\)
3. Results and discussion
B
p "p ;exp(!*H/R;(1/¹!1/¹3)
(2)
*
*
where R is the universal gas constant (8.3143
J\ mol K\) and *H the enthalpy of vaporisation (in
J\ mol). *H was calculated based on work by Govers et
al. (1995). Homologue group vapour pressures were calculated by averaging the available congener speci"c data
for each homologue group.
A
ln (p /p )"6.8(¹ !¹)/¹,
(1)
* 1
where ¹ is the compounds' melting point (K). However,
it is recognised that there is uncertainty over how appropriate the conversion factor of 6.8 is for PCDD/Fs
(Hinckley et al., 1990). Eitzer and Hites (1988) developed
a formula relating retention time indices (RI) for
PCDD/Fs on a non-polar GC-column to measured vapour pressures. We took the RIs of Donelly et al. (1987)
and Hale et al. (1985) and applied the equation by Eitzer
and Hites (1988) to generate the p values. Govers and
*
Krop (1998) used a predictive model (SOFA) based on
a few physico-chemical properties to derive a full suite of
properties for all individual PCDD/Fs, including p3 .
*
Govers and Krop p -values were temperature-corrected
*
according to the integrated Clausius}Clapeyron equation:
Sample code
Data for PCDD/Fs have been determined by Rordorf
(1987,1989), Eitzer and Hites (1988) (corrected in 1998),
and Govers and Krop (1998) and were corrected for the
mean sampling temperature. Rordorf (1987,1989) reported a series of vapour pressures of the solid phase, p ,
1
based on the gas saturation method. We converted these
data to sub-cooled liquid vapour pressure, p , at the
*
ambient temperature, ¹ (K), according to an empirical
relationship based on work by Mackay et al. (1982):
Table 1
Sampling dates, meteorological parameters, TSP-levels, air mass origins and the &TEQ of the gas}particle distribution study at Lancaster, UK
2.5. Vapour pressure
19}20.11
885
10.5$1.5
82%
6.3
40
France}S-Engl.
18
H
sampling period, both leading to adsorption to or desorption of particulate-bound analytes trapped on the
GFF, could result in the measured gas}particle distribution not being representative of equilibrium partitioning.
It was the intention of this study to minimise these
sampling errors by collecting air samples over short
periods of time during stable meteorological conditions.
2531
4}5.12
775
2.5$1.5
88%
0.2
31
Scotl.}Ireland
100
R. Lohmann et al. / Atmospheric Environment 34 (2000) 2529}2537
2532
R. Lohmann et al. / Atmospheric Environment 34 (2000) 2529}2537
H had a marked increase in RTEQ, with 320 fg
TEQ m\ and 100 fg TEQ m\ respectively.
RCl } DD/Fs varied from 1.1}3.6 pg m\ for samples
A}F, up to 18 pg m\ (sample G) and 8 pg m\ for
sample H. The contribution of the di!erent congeners
to the RTEQ was quite consistent; 2, 3, 4, 7, 8-PeCDF
was the main contributor, at &25% of the RTEQ.
1, 2, 3, 7, 8-PeCDD was the only other congener contributing more than 10%. Sample G was di!erent to the
others, with a much higher PCDF contribution.
together with the fraction that was particulate
bound. The PCDD/Fs show a big range in their
gas}particle distribution, with 0}34% of Cl } DD/Fs,
13}97% of Cl } DD/Fs and '70% of Cl } DD/Fs
particulate-bound in these wintertime samples. A
temperature e!ect is most pronounced for the
Cl DD/Fs, which are '90% particle-bound for sam
ples F-H (mean temperatures (33C), but generally
)50% for samples A and B (mean temperatures
'103C).
3.2. Gas}particle partitioning
3.3. Junge}Pankow adsorption plots
Table 2 presents the air concentrations of the 2, 3, 7, 8substituted congeners and the homologue groups,
An adsorptive partitioning model, based on work by
Junge (1977) and Pankow (1987), is often used to predict
Table 2
Air concentrations (fg m\) of the 2,3,7,8-substituted congeners and the homologue groups measured at Lancaster and the fraction
which was particle -bound (in brackets)
Sample
PCDFs
2, 3 ,7 ,81, 2, 3, 7, 82, 3, 4, 7, 81, 2, 3, 4, 7, 81, 2, 3, 6, 7, 81, 2, 3, 7, 8, 92, 3, 4, 6, 7, 81, 2, 3, 4, 6, 7, 8
1, 2, 3, 4, 7, 8, 9
OCDF
PCDDs
2, 3, 7, 81, 2, 3, 7, 81, 2, 3, 4, 7, 81, 2, 3, 6, 7, 81, 2, 3, 7, 8, 91, 2, 3, 4, 6, 7, 8
OCDD
Cl DFs
V
Cl DFs
Cl DFs
Cl DFs
Cl DFs
Cl DFs
Cl DFs
Cl DDs
V
Cl DDs
Cl DDs
Cl DDs
Cl DDs
Cl DDs
Cl DDs
RCl DD/Fs
U
RTEQ
A
B
C
D
E
F
G
H
6.5
8.4
7.1
10
7.7
2.6
11
35
6.0
37
(0.21)
(0.28)
(0.51)
(0.72)
(0.73)
(0.92)
(0.84)
(0.94)
(0.96)
(0.97)
9.3
12
12
12
9.3
4.6
13
31
6.4
42
(0.19)
(0.43)
(0.68)
(0.82)
(0.86)
(0.81)
(0.89)
(0.94)
(0.96)
(0.97)
9.1
22
15
52
27
3.7
22
170
35
260
(0.54)
(0.74)
(0.79)
(0.97)
(0.95)
(0.94)
(0.96)
(0.99)
(0.99)
(1.00)
18
31
26
40
29
4.4
34
98
16
82
(0.51)
(0.74)
(0.87)
(0.94)
(0.95)
(0.94)
(0.95)
(0.98)
(0.98)
(0.98)
18
28
25
27
26
3.4
28
72
9.2
45
(0.36)
(0.61)
(0.78)
(0.94)
(0.93)
(0.94)
(0.96)
(0.99)
(0.98)
(0.99)
12
20
16
17
14
3.0
18
38
7
23
(0.62)
(0.91)
(0.94)
(0.95)
(0.96)
(0.80)
(0.93)
(0.97)
(0.69)
(0.95)
95
280
230
360
280
26
300
880
120
460
(0.90)
(0.97)
(0.99)
(0.98)
(0.99)
(0.95)
(0.98)
(0.99)
(0.99)
(0.99
33
75
58
85
69
6.9
79
260
33
230
(0.62)
(0.93)
(0.95)
(0.98)
(0.98)
(0.91)
(0.97)
(0.99)
(0.99)
(0.99)
0.7
3.7
3.3
10
8.1
120
400
(0.17)
(0.36)
(0.75)
(0.82)
(0.85)
(0.97)
(0.97)
1.2
4.1
3.8
8.6
6.7
75
270
(0.58)
(0.63)
(0.93)
(0.89)
(0.92)
(0.96)
(0.97)
1.6
7.3
7.7
16
14
160
520
(0.55)
(0.81)
(0.94)
(0.96)
(0.98)
(0.99)
(0.99)
2.0
9.5
12
24
18
220
670
(0.49)
(0.89)
(0.98)
(0.98)
(0.98)
(0.99)
(0.98)
1.9
15
14
30
24
260
690
(0.35)
(0.80)
(0.99)
(0.97)
(0.98)
(0.99)
(0.99)
2.1
12
12
22
22
220
590
(0.58)
(0.96)
(0.95)
(0.93)
(0.95)
(0.97)
(0.95
14
59
48
80
67
530
1200
(0.88)
(0.96)
(0.97)
(09.5)
(0.97)
(0.97)
(0.98)
4.8
26
28
54
45
560
1900
0.58)
(0.96)
(0.98)
(0.98)
(0.98)
(0.98)
(0.98)
5400
550
400
330
310
190
(0.01)
(0.12)
(0.34)
(0.8)
(0.97)
(0.98)
4400
800
520
320
260
140
(0.04)
(0.08)
(0.23)
(0.63)
(0.95)
(0.99)
3000
490
330
2000
140
66
(0.03)
(0.15)
(0.47)
(0.90)
(0.99)
(0.95)
19000 (0.14)
3200 (0.29)
4000 (0.85)
3400 (0.97)
3000 (0.99)
1600 (0.99)
180
71
170
210
310
450
3130
(0.87) 44
(0.05)
(0.11)
(0.36)
(0.84)
(0.97)
(0.99)
180
99
270
320
560
530
3640
(0.88) 44
(0.04)
(0.07)
(0.20)
(0.67)
(0.95)
(1.00)
120
55
100
160
220
400
2230
(0.82) 32
(0.06)
(0.18)
(0.61)
(0.95)
(0.96)
(0.97)
3800
410
200
110
86
62
(0.00) 3100
(0.16) 320
(0.13) 180
(0.51) 100
(0.77)
84
(0.94)
63
(0.01)
(0.05)
(0.14)
(0.47)
(0.91)
(0.97)
77000 (0.01)
380 (0.09)
220 (0.28)
180 (0.71)
280 (0.98)
360 (1.00)
160
50
92
68
110
220
1390
15
(0.04)
(0.04)
(0.28)
(0.47)
(0.82)
(0.97)
(0.03)
(0.06)
(0.22)
(0.44)
(0.89)
(0.96)
(0.42)
(0.17)
(0.41)
(0.69)
(0.93)
(0.99)
150
44
72
48
94
140
1100
(0.62)
18
330
46
130
100
190
310
2550
(0.72) 33
Values in italics were calculated assuming non-detects as half the detection limit.
350 (0.06)
490 (0.34)
1300 (0.81)
1200 (0.95)
1000 (0.96)
1100 (0.97)
18100
(0.91) 320 (0.97)
25000 (0.03)
1200 (0.10)
1100 (0.45)
850 (0.92)
700 (0.99)
450 (0.99)
780
190
370
510
620
1100
7880
100
(0.02)
(0.10)
(0.45)
(0.95)
(0.97)
(0.98)
(0.93)
R. Lohmann et al. / Atmospheric Environment 34 (2000) 2529}2537
2533
the gas}particle distribution of semi-volatile organic
compounds:
3.4. Log K -log p plots
*
% particulate"c;a /(p3 #c;a )
*
The gas}particle partitioning coe$cient, K , was cal
culated for all the 2, 3, 7, 8-substituted congeners and the
homologue groups using Eq. (4), where:
(3)
where a is particle surface area per volume of air and
c a constant which depends on the heat of condensation
and molecular properties. Junge (1977) assumed
c"0.172 Pa;m for high molecular weight organics and
has been used in this study for PCDD/Fs. Particle surface areas often used in the literature are in the range of
4.2;10\ (clean continental background), 1.5;10\
(rural conditions) and 1.1;10\ m/m (urban) (e.g.
Bidleman, 1988). Each value has been used to generate
predicted partition curves for background, rural and
urban sites. These are plotted together with data points
from samples A}H in Fig. 1. Measured TSP-concentrations at Lancaster (yearly average of &30 lg m\) suggest that Lancaster is a background site, in line with its
geographical position and the RTEQ found for the "rst
6 samples (Lohmann and Jones, 1998), and our data
might be expected to be best represented by the rural
partition curve.
The three graphs comprising Fig. 1 show our measured
data set plotted against the p values determined by
*
Rordorf, Eitzer and Hites and Govers and Krop, respectively. A good "t of the measured data with the
predicted rural curve can be seen for Cl DD/Fs (p
*
(10\ Pa) and for the Cl DD/Fs (p '10\ Pa) on
*
all three graphs. However, in Fig. 1a (Rordorf's p ) the
*
intermediate PCDD/Fs (Cl } DD/Fs) spread to both
sides of the predicted curve for a rural site. Fig. 1b, using
p from Eitzer and Hites, shows a tight grouping of all
*
our measured data. Most data points fall close to the
rural curve, although the less volatile PCDD/Fs tend
towards what is predicted for a more urban site. In
contrast, p data from Govers and Krop spreads most
*
data points to both sides of the predicted curve for a rural
site while following the overall shape of the partitioning
curve.
Vapour pressures derived from GC-retention times
have generally been successfully used for PCBs, PAHs
and PCNs, which suggests that this method is the closest
to &directly' measuring a compounds' vapour pressure
and the temperature dependency of p (de Site, 1997).
*
However, a systematic o!set of p derived this way
*
was reported by Hinckley et al. (1990), based on
di!erences in activity coe$cients of the standard
compounds. This correction will be more important for
the higher chlorinated congeners, which could a!ect the
lack of overlap seen in Fig. 1b. Nevertheless the most
reliable dataset appears to be that measured by Eitzer
and Hites (1988). Fig. 1b shows in general a good agreement between predicted (based on the Junge}Pankow
model) and measured particle-bound fraction for a rural
site.
K "(F/A)/TSP,
(4)
with F and A the PCDD/F concentrations on the GFF
and on the PUF, respectively, and TSP in lg m\. Log
K was plotted against the temperature corrected log p :
*
log K "m ;log p #b ,
*
(5)
where is m is the slope and b the y-intercept of the
trendline (Yamasaki et al., 1982). The data for each
sample are presented in Table 3. It shows a marked
di!erence between the homologue groups and the
2, 3, 7, 8-substituted congeners. All homologue groups
were highly signi"cantly (at P)0.01) correlated with p ,
*
whereas only the "rst 5 regressions with the 2, 3, 7, 8substitued congeners were signi"cant (at P)0.01), regardless of which set of vapour pressures were used (i.e.
obtained by GC-retention data or the Govers and Krop
predictive model). Comparing the regression coe$cients
for the measured with the predicted p data showed that
*
correlations were highest for the p data derived by
*
Eitzer and Hites (1988) (signi"cant at P)0.05). This
further con"rms that the dataset derived from GC-retention indices most accurately re#ects our measured
PCDD/F partitioning. Fig. 2 shows the log K !log p
*
plot for all the homologue groups and 2, 3, 7, 8-substituted congeners in the 8 samples, excluding values
where PCDD/F concentrations were below detection
limit. Virtually all homologue group data points fall on
one straight line (&best "t': b "!6.0; m "!1.0;
r"0.90), while the 2, 3, 7, 8-substituted congeners with
the lowest vapour pressures show a di!erent partitioning
(&best "t': b "!4.1; m "!0.68; r"0.64).
3.5. Slope and intercept of regressions with GC-retention
time p
*
All homologue groups and the "rst 5 correlations with
the 2, 3, 7, 8-substituted congeners have slopes of the
log K !log p regressions lines which were, on average,
*
close to !1 (!0.95 for the 2, 3, 7, 8s; !1.04 for the
homologue groups). A slope of near !1 can be expected
for gas}particle distributions in equilibrium (Pankow
and Bidleman, 1992). Our regressions gave a mean yintercept of !5.5 (!4.2 to !7.0) for the 2, 3, 7, 8substituted congeners (samples A}E) and !6.0 (!4.9
to !6.8) for the homologue groups, similar to other
reported trendlines (but with di!erent slopes): Eitzer
and Hites (1989) found m "!0.78 and b "!5.7
at a site in urban Bloomington, Indianapolis, and
values of m "!0.70 and b "!5.5 have been
2534
R. Lohmann et al. / Atmospheric Environment 34 (2000) 2529}2537
Fig. 1. Junge}Pankow plot with measured and predicted PCDD/F distributions based on sub-cooled liquid vapour pressure data
presented by (a) Rordorf, (b) Eitzer and Hites and (c) Govers and Krop.
R. Lohmann et al. / Atmospheric Environment 34 (2000) 2529}2537
2535
Table 3
Calculated log K !log p trendline data with 2 di!erent sets of vapour pressures
*
2, 3, 7, 8s
A
B
C
D
E
F
G
H
GC-ret.
Intercept
Slope
Regression
n"17
!5.77
!0.98
0.91
n"15
!4.89
!0.77
0.90
n"13
!5.53
!0.99
0.93
n"13
!4.23
!0.71
0.84
n"12
!7.04
!1.29
0.98
n"14
!2.08
!0.28
0.27
n"17
!1.32
!0.25
0.35
n"14
!3.36
!0.57
0.69
Predict.
Intercept
Slope
Regression
!5.09
!0.71
0.86
!4.42
!0.58
0.88
!4.80
!0.73
0.84
!3.75
!0.54
0.78
!5.80
!0.90
0.89
!1.73
!0.19
0.21
!0.84
!0.14
0.20
!2.88
!0.42
0.63
Homolog.
GC-ret.
Intercept
Slope
Regression
A
n"11
!5.30
!0.90
0.95
B
n"12
!6.29
!1.05
0.98
C
n"12
!6.10
!1.10
0.87
D
n"12
!6.40
!1.13
0.98
E
n"12
!6.51
!1.18
0.97
F
n"12
!5.80
!0.95
0.89
G
n"12
!4.89
!0.86
0.86
H
n"12
!6.75
!1.18
0.94
Predict.
Intercept
Slope
Regression
!4.66
!0.63
0.85
!5.26
!0.69
0.91
!5.11
!0.75
0.86
!5.27
!0.76
0.92
!5.21
!0.76
0.86
!4.82
!0.65
0.88
!3.90
!0.57
0.78
!5.43
!0.78
0.87
GC-retention data from Eitzer and Hites (1988).
Model predicted data from Govers and Krop (1998).
Fig. 2. Log K -log p plot for homologue groups and 2, 3, 7, 8-substituted congeners using p measured by GC-retention data by Eitzer
.
*
*
and Hites (1988).
2536
R. Lohmann et al. / Atmospheric Environment 34 (2000) 2529}2537
reported for rural Germany (see Lohmann and Jones,
1998).
2, 3, 7, 8-substituted congeners in samples F, G and
H showed a di!erent behaviour compared to the other
5 samples. The log K !log p regression coe$cients
*
were not signi"cant and the slopes were di!erent from
the other samples. This indicates that the gas and particulate phases were not in equilibrium when sampled. As
noted earlier, samples G and H had high PCDD/F concentrations, suggestive of additional emissions. Although
their TSP values were no higher than for the other samples, air masses for samples F}H came from the North,
possibly resulting in a di!erent type of particles in the air
mass sampled, compared to samples A}E. Interestingly,
the homologue groups showed equilibrium partitioning,
whereas the 2, 3, 7, 8-substituted congeners did not.
Another possibility is that the di!erent behaviour
of the cold temperature samples could be explained
by sampling artefacts or the analytical uncertainties in
accurately determining the amounts of the least volatile
congeners in the gas phase. However, samples G and H
exhibited the two highest PCDD/F concentrations in this
sampling set, making them the most reliable measurements. Low ambient temperature further minimised
sampling artefacts such as &stripping o!' analytes from
the "lter, while general sampling artefacts a!ected all
samples similarly. However, the partitioning of OCDD/F
seemed to be a!ected by sampling problems in all samples (see the 2 leftmost points of each sample in Fig. 2),
but } even excluding OCDD/F } the trendlines showed
a di!erent sampling behaviour for samples F, G and H.
Reasons other than di!erent air mass origin, particle
properties or analytical/sampling uncertainties must
have caused this apparent di!erence in partitioning: the
most notable characteristic of these samples is that the
averaged ambient temperatures were lower (around 03C)
than for samples A}E (7}133C). Many PCDD/Fs sources
are combustion-derived and there can therefore be seasonality to ambient air levels, with winter (lower temperature) concentrations higher than those in summer
(Lohmann and Jones, 1998; Lee et al., 1999; Lohmann
et al., 1999a,b). It seems most likely that the lower temperature resulted in further emissions of PCDD/Fs to the
air mass from seasonally dependent combustion-related
sources and that this } in some way } resulted in nonequilibrium partitioning.
3.6. Junge}Pankow adsorption model in atmospheric
transport models
An organic carbon-based absorption model has been
proposed recently as an alternative approach for modelling gas}particle partitioning (Finizio et al., 1997). At
present there are no measured octanol}air partition constants (K ) for PCDD/Fs available and a number of
assumptions have to be made to estimate their temper-
ature-dependency (Lee and Jones, 1999). However, the
measured gas}particle PCDD/F partitioning in this
study agreed well with the Junge}Pankow model, using
p data derived from GC-retention times by Eitzer and
*
Hites (1988). The measured data could generally be
modelled to within a factor of 1.2 using this approach
and we consider this to be extremely encouraging.
It would therefore seem appropriate to incorporate
this approach in atmospheric transport models for
PCDD/Fs, although our dataset suggests that consideration needs to be given to the prolonged times for
equilibrium of the heavier PCDD/Fs during cold
ambient temperatures.
Acknowledgements
We thank Atmospheric Environment, Canada, for
supplying back trajectories. We thank an anonymous
referee for constructive comments. We are grateful to the
Department of Environment, Transport and the Regions
(DETR), the Ministry of Agriculture, Fisheries and Food
(MAFF) and the Natural Environment Research Council's Environmental Diagnostics programme for "nancial
support for POPs research.
References
Bidleman, T.F., 1988. Atmospheric processes: wet and dry
deposition of organic compounds are controlled by the
vapor-particle partitioning. Environmental Science and
Technology 22, 361}367.
de Site, A., 1997. The vapor pressure of environmentally signi"cant organic chemicals: a review of methods and data at
ambient temperature. Journal of Physical-Chemical Reference Data 26, 157}193.
Donelly, J.R., Munslow, W.D., Mitchum, R.K., Sovocool, G.W.,
1987. Correlation of structure with retention index for chlorinated dibenzo-p-dioxins. Journal of Chromatography 392,
51}63.
Eitzer, B.D., Hites, R.A., 1988. Vapor pressures of chlorinated
dioxins and dibenzofurans. Environmental Science and
Technology 22, 1362}1364; Addition/Correction 1998, Environmental Science and Technology 32, 2804.
Eitzer, B.D., Hites, R.A., 1989. Polychlorinated dibenzo-p-dioxins and dibenzofurans in the ambient air of Bloomington
Indiana. Environmental Science and Technology 23,
1389}1395.
Finizio, A., Mackay, D., Bidleman, T., Harner, T., 1997.
Octanol-air partitioning coe$cients as a predictor of partitioning of semi-volatile organic chemicals to aerosols.
Atmospheric Environment 31, 2289}2296.
Govers, H.A.J., Krop, H.B., 1998. Partition constants of chlorinated dibenzofurans and dibenzo-p-dioxins. Chemosphere 37,
2139}2152.
Govers, H.A.J., van der Wielen, F.W.M., Olie, K., 1995. Derivation of solubility parameters of chlorinated dibenzofurans
and dibenzo[p]dioxins from gas chromatographic retention
R. Lohmann et al. / Atmospheric Environment 34 (2000) 2529}2537
parameters via SOFA. Journal of Chromatography A 715,
267}278.
Hale, M.D., Hileman, F.D., Mazer, T., Shell, T.L., Noble, R.W.,
Brooks, J.J., 1985. Mathematical modelling of temperature
programme capillary gas chromatographic retention indexes
for polychlorinated dibenzofurans. Analytical Chemistry 57,
640}648.
Hinckley, D.A., Bidleman, T.F., Foreman, W.T., Tuschall, J.R.,
1990. Determination of vapor pressures for nonpolar and
semipolar organic compounds from gas chromatographic
retention data. Journal of Chemical Engineering Data 35,
232}237.
Hippelein, M., Kaupp, H., DoK rr, G., McLachlan, M., Hutzinger,
O., 1996. Baseline contamination assessment for a new resource recovery facility in Germany. part II: atmospheric
concentrations of PCDD/F. Chemosphere 32, 1605}1616.
Junge, C.E., 1977. In: Su!et, I.H.,( Ed.), Fate of Pollutants in the
Air and Water Environment, Part 1, Vol. 8. Wiley Interscience. New York. pp. 7}25.
Kaupp, H., McLachlan, M., 1999. Gas/particle partitioning of
PCDD/Fs. PCBs, PCNs and PAHs. Chemosphere 38,
3411}3421.
Kutz, F.W., Barnes, D.G., Bottimore, D.P., Greim, H., Bretthauer, E.W., 1990. The international toxicity equivalency
factor (I-TEF) method for risk assessment for complex mixtures of dioxins and related compounds. Chemosphere 20,
751}757.
Lee, R.G.M., Green, N.J.L., Lohmann, R., Jones, K.C., 1999.
Seasonal, anthropogenic, air mass and meteorological
in#uences on the atmospheric concentrations of
PCDDD/Fs: evidence for the importance of di!use combustion sources. Environmental Science and Technology 33,
2864}2871.
Lohmann, R., Green, N.J.L., Jones, K.C., 1999a Atmospheric
transport of PCDD/Fs in air masses across the UK and
Ireland: evidence of emissions and depletion. Environmental
Science and Technology, 33, 2872}2878.
2537
Lohmann, R., Green, N.J.L., Jones, K.C., 1999b. Detailed studies
of the factors in#uencing atmospheric PCDD/F concentrations. Environmental Science and Technology 33, 4440}4447.
Lohmann, R., Jones, K.C., 1998. Dioxins and furans in air and
deposition: a review of levels, behaviour and processes.
Science of the Total Environment 219, 53}81.
Lee, R.G.M., Jones, K.C., 1999. Gas}particle partitioning of
atmospheric PCDD/Fs: measurements and observations on
modelling. Environmental Science and Technology 33,
3596}3604.
Mackay, D., Bobra, A., Chan, D.W., Shiu, W.Y., 1982. Vapor
pressure correlations for low-volatility environmental chemicals. Environmental Science and Technology 16, 645}649.
Pankow, J.F., 1987. Review and comparative analysis of the
theories on partitioning between the gas and aerosol particulate phases in the atmosphere. Atmospheric Environment
22, 2275}2283.
Pankow, J.F., Bidleman, T.F., 1992. Interdependence of the
slopes and intercepts from log}log correlations of measured
gas}particle partitioning and vapor pressure } I theory and
analysis of available data. Atmospheric Environment 26A,
1071}1080.
Rordorf, B.F., 1987. Prediction of vapor pressures, boiling
points and enthalpies of fusion for twenty-nine halogenated
dibenzo-p-dioxins. Thermochimica Acta 112, 117}122.
Rordorf, B.F., 1989. Prediction of vapor pressures, boiling
points and enthalpies of fusion for 20 halogenated dibenzopara-dioxins and 55 dibenzofurans by a vapor pressure correlation method. Chemosphere 18, 783}788.
van Pul, W.A.J., de Leeuw, F.A.A.M., van Jaarsveld, J.A., van
der Gaag, M.A., Sliggers, C.J., 1998. The potential for longrange transboundary atmospheric transport. Chemsophere
37, 113}141.
Yamasaki, H., Kuwata, K., Miyamato, H., 1982. E!ects of ambient air temperature on aspects of airborne polycyclic
aromatic hydrocarbons. Environmental Science and
Technology 16, 189}194.
© Copyright 2026 Paperzz