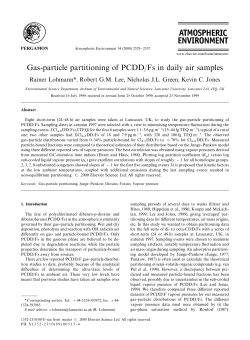
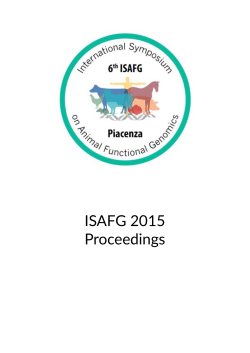
Journal of Analytical Toxicology, 2016;40:194–200
doi: 10.1093/jat/bkv143
Advance Access Publication Date: 10 January 2016
Article
Article
Validated LC–MS-MS Method for Multiresidual
Analysis of 13 Illicit Phenethylamines
in Amniotic Fluid
Lucia Burrai1,†, Maria Nieddu1,*, Antonio Carta1, Claudia Trignano2,
Raimonda Sanna2, and Gianpiero Boatto1,†
1
Dipartimento di Chimica e Farmacia, Università di Sassari, Via Muroni 23/a, 07100 Sassari, Italy, and 2Dipartimento di
Scienze Biomediche, Università di Sassari, V.le San Pietro 43, 07100 Sassari, Italy
*Author to whom correspondence should be addressed. Email: [email protected]
†
These authors contributed equally to this work.
Abstract
A multi-residue analytical method was developed for the determination in amniotic fluid (AF) of 13
illicit phenethylamines, including 12 compounds never investigated in this matrix before. Samples
were subject to solid-phase extraction using; hydrophilic–lipophilic balance cartridges which gave
good recoveries and low matrix effects on analysis of the extracts. The quantification was performed
by liquid chromatography electrospray tandem mass spectrometry. The water–acetonitrile mobile
phase containing 0.1% formic acid, used with a C18 reversed phase column, provided adequate separation, resolution and signal-to-noise ratio for the analytes and the internal standard. The final optimized method was validated according to international guidelines. A monitoring campaign to
assess fetal exposure to these 13 substances of abuse has been performed on AF test samples obtained from pregnant women. All mothers (n = 194) reported no use of drugs of abuse during pregnancy, and this was confirmed by the analytical data.
Introduction
Prenatal substance abuse is a growing issue. In the last decade, a rapid
escalation in the availability and misuse of psychotropic substances
has been reported. Several neonatal problems related to health and development have been undoubtedly linked to fetal exposure to drugs
and alcohol (1, 2): a fetus exposed to such substances during intrauterine development can be affected by reduced birth weight, small head
circumference, premature birth, fetal distress, potential birth defects
and perinatal complications (3).
Phenethylamines are among the most commonly used addictive
drugs provoking elevation of mood and wakefulness, and increasing
self-confidence, talkativeness and agitation. In addition, because of
their adrenaline-like effects, phenethylamines cause hypertension,
tachycardia, dry mouth and sweating.
The intake of phenethylamines during pregnancy could be dangerous to the fetus as these drugs of abuse are fat soluble and can readily
pass through the placental barrier (4), reaching the fetal compartment
and causing harmful side effects (5). Several investigations have
indeed found links between prenatal methamphetamine (MA) and
3,4-methylenedioxymethamphetamine (MDMA) exposure and specific adverse outcomes (6, 7). Furthermore, recent studies have proved
that one of the most important effects of prenatal exposure to phenethylamines is a persistent alteration of the metabolism of monoamines, especially dopamine and serotonin (5). Other significant
effects are intrauterine growth retardation (8) and intellectual and
behavioral problems in infants (9, 10). Equally important are the
effects on maternal health, since the anorectic action of these drugs
on the mother may in turn be dangerous for the developing fetus.
Consequently, due to the increasing diffusion and abuse of these
drugs, and the appearance of new phenethylamine derivatives on the
black market, there is a need for sensitive and specific bioanalytical
methods that allow these substances to be detected and quantified,
not only in traditional maternal matrices but also in fetal samples.
This could make it possible to assess the exposure to these substances
© The Author 2016. Published by Oxford University Press. All rights reserved. For Permissions, please email: [email protected]
194
195
LC–MS-MS Analysis of 13 Phenethylamines in Amniotic Fluid
which, although illicit, are sometimes consumed by women, who are
often not aware of their pregnancy.
It is important to highlight that the phenethylamine on the illicit
market are constantly changing, as with small structural molecular
changes it is possible to obtain new compounds temporarily lawful
but equally dangerous. For this reason, it is essential to have updated
analytical methods in order to detect these new molecules.
Fetal exposure to drugs of abuse can be diagnosed through a positive maternal history and detection of the investigated compounds
themselves in maternal and/or neonatal matrices. In addition to traditional specimens (such as maternal blood and urine), there are many
others available, such as meconium, umbilical cord tissue and amniotic fluid (AF). AF is essentially a filtrate of maternal blood. Drugs reach
the AF by diffusing across the placenta. The fetus is exposed to xenobiotics dissolved in the AF through two main routes: oral ingestion
and transdermal diffusion, particularly relevant in the early stage of
pregnancy, because the skin is less developed. The only disadvantage
of this matrix is that its collection is invasive. However, for drug testing purposes an aliquot can be taken of the AF sample collected during
amniocentesis, a medical procedure performed to detect genetic disorders. Although the collection of an AF sample is more troublesome
than other conventional matrices, one unique feature of this matrix
is that it can measure second/third trimester drug exposure, compared
with perinatal exposure in urine. Similarly, it gives a more direct measure of fetal exposure than maternal blood as it indicates actual drug
concentrations than have passed the placental barrier. In another
study, we previously investigated the intake of caffeine and acetaminophen during pregnancy (11).
In the work reported here, we developed and validated a liquid
chromatography tandem mass spectrometry (LC–MS-MS) method
for the determination and quantitation in AF of 13 phenethylamine
derivatives—3,4-methylenedioxy-N-methylamphetamine (MDMA),
3,4-methylenedioxy-N-ethylamphetamine (MDE), p-methoxyam
phetamine (PMA), p-methoxymethamphetamine (PMMA), 3,4,5trimethoxyamphetamine (TMA), 2,5-dimethoxyamphetamine (DMA),
2,5-dimethoxy-4-methylamphetamine
(DOM),
2,5-dimethoxy4-ethylamphetamine (DOET), 2,5-dimethoxy-4-bromoamphetamine
(DOB), 2,5-dimethoxy-4-bromophenethylamine (2C-B), 2,5-dimethoxy4-iodophenethylamine (2C-I), 2,5-dimethoxy-4-ethylthiophenethylamine
(2C-T-2) and 2,5-dimethoxy-4-n-propylthiophenethylamine (2C-T-7).
All of these are officially recognized as illicit drugs by Italian Legislation
(12, 13) and other European countries (14, 15). Twelve of these compounds have never been investigated in AF before. AF samples were subject
to solid-phase extraction (SPE) using hydrophilic–lipophilic balance (HLB)
cartridges to minimize matrix interference and to concentrate extracts prior
to LC–MS-MS analysis. Finally, the method has been validated in order to
monitor 194 test samples of human AF.
Experimental
Chemicals and reagents
The target analytes [3,4-methylenedioxy-N-methylamphetamine (MDMA),
3,4-methylenedioxy-N-ethylamphetamine (MDE), p-methoxyamphetamine (PMA), p-methoxymethamphetamine (PMMA), 3,4,5-trime
thoxyamphetamine (TMA), 2,5-dimethoxyamphetamine (DMA), 2,5dimethoxy-4-methylamphetamine (DOM), 2,5-dimethoxy-4-ethylamphetamine (DOET), 2,5-dimethoxy-4-bromoamphetamine (DOB),
2,5-dimethoxy-4-bromophenethylamine (2C-B), 2,5-dimethoxy-4-iodophenethylamine (2C-I), 2,5-dimethoxy-4-ethylthiophenethylamine
(2C-T-2) and 2,5-dimethoxy-4-n-propylthiophenethylamine (2C-T-7)]
were purchased from Lipomed AG (Arlesheim, Switzerland). The
internal standard (2,3-dimethoxyphenethylamine-d3, IS) was synthesized
in our laboratory and had a purity of >99%. Deionized and distilled
water was filtered through a Milli Q water system (Millipore, Billerica,
MA, USA). Other reagents and solvents were of the highest commercial
quality and were obtained from Sigma Aldrich (Milano, Italy). Individual
methanolic stock solutions (1.0 mg/mL of each analyte and the IS) were
used to prepare the working solutions by appropriate dilution. All solutions were stored at −20°C in the dark.
Supel™-Select HLB SPE columns (30 mg/1 mL) were purchased
from Supelco (Bellafonte, PA). SPE columns were mounted on a
VacElut vacuum manifold (Sigma Aldrich, Milan, Italy).
Sample collection
A total of 194 women (15–21 weeks gestation) undergoing routine
amniocentesis in our university hospital voluntarily participated in
this study, giving signed consent. To perform the drug testing, an
aliquot (1,000 µL) of the AF collected during amniocentesis was
taken and stored at −80°C until analyzed. All experiments were conducted according to institutional guidelines and were approved by the
Local Ethics Committee.
Sample preparation
The analytes were extracted as follows: the HLB cartridge (Supel™-Select, 30 mg/mL) was first activated and conditioned with 1 mL of
methanol and 1 mL of ammonium acetate buffer (25 mM, pH 10).
Then 0.5 mL of AF mixed with 0.5 mL of the same ammonium acetate
buffer was applied to the cartridge. After application of the sample,
the column was washed (1 mL of Milli-Q water and 1 mL of 5%
methanol in water) and dried for 5 min under a stream of air. The analytes were then eluted with 1 mL of methanol/acetonitrile (1/1). Finally, the eluate, evaporated to dryness under a stream of nitrogen, was
reconstituted in 0.2 mL of the initial mobile phase.
LC–MS-MS analysis
A Shimadzu LC-20ADXR instrument (Shimadzu Italia, Milano, Italy)
was employed for chromatographic separation using a Kinetex C18
column (50 × 2.1 mm i.d., particle size 2.6 μm; Phenomenex,
Torrance, CA, USA) fitted with a 2.6-μm security guard cartridge
(4 × 2.1 mm i.d., Phenomenex). The mobile phase was constituted
by two solvents: 0.1% formic acid in water (solvent A) and 0.1% formic acid in acetonitrile (solvent B). Chromatography was undertaken
at a flow rate of 0.3 mL/min using (i) a linear gradient from 10 to 90%
B in 6 min followed by (ii) isocratic elution with 90% B for 1.5 min.
Thereafter, the mobile phase was rapidly returned to 10% B in 0.1 min
and the system re-equilibrated at the initial conditions for a further
4.9 min before each new sample injection. The total run time was
thus 12.5 min. Each sample was injected three times.
Tandem mass spectrometric analysis was performed on an Applied
Biosystem MDS Sciex API 2000 triple quadrupole (Concord, Ontario,
Canada), equipped with an electrospray ionization (ESI) interface. Infusion experiments by the syringe-pump method were undertaken for
each analyte and the IS at a concentration of 10 μg/mL in both negative and positive ion mode to optimize ESI parameters. It was observed
that the signal intensities were greater in the positive ionization mode.
The mass spectra revealed intense protonated molecular ion peaks (reported in Table I). These [M + 1]+ ions were selected as the precursors
to optimize the fragmentation parameters in product ion experiments.
For each target analyte, two product ions were selected; one transition
was taken for confirmation of the identity of the analyte and the other
for its quantitation. For the IS, only one transition was selected. The
196
Burrai et al.
Table I. Tandem mass spectrometric conditions
Compound
Precursor ion (m/z)
Target/qualifier ions (m/z)
DP (V)
FP (V)
EP (V)
CE (V)
CXP (V)
2C-B
260.0
15
300
4.0
2C-I
308.1
15
300
5.0
2C-T-2
242.2
15
200
5.0
2C-T-7
256.2
15
300
5.0
DMA
196.2
15
200
8.0
DOB
274.0
15
300
5.0
DOET
224.2
11
300
4.0
DOM
210.2
10
200
6.0
MDE
209.1
21
200
7.0
MDMA
194.2
21
200
7.0
PMA
166.1
10
200
6.0
PMMA
180.1
15
200
6.0
TMA
226.2
15
200
4.0
IS
185.0
243.0
228.0
291.1
276.1
225.2
134.2
239.2
197.2
151.2
179.2
257.0
229.0
207.2
179.2
193.2
178.2
164.1
78.1
163.2
105.2
149.1
121.1
121.1
149.1
209.2
181.2
168.0
15
200
8.0
18
30
21
35
19
37
19
30
16
24
22
33
20
27
18
27
19
63
12
35
13
27
18
25
16
29
20
10
4.6
6.5
5.4
4.8
5.0
5.4
8.0
3.2
6.0
5.9
4.3
4.7
7.4
4.3
3.5
10
12
8
18
2.2
2.0
2.2
4.6
4.6
3.0
7
DP, declustering potential; FP, focusing potential; EP, entrance potential; CE, collision energy; CXP, collision cell exit potential; 2C-B, 2,5-dimethoxy-4bromophenethylamine; 2C-I, 2,5-dimethoxy-4-iodophenethylamine; 2C-T-2, 2,5-dimethoxy-4-ethylthiophenethylamine; 2C-T-7, 2,5-dimethoxy-4-npropylthiophenethylamine; DMA, 2,5-dimethoxyamphetamine; DOB, 2,5-dimethoxy-4-bromoamphetamine; DOET, 2,5-dimethoxy-4-ethylamphetamine; DOM,
2,5-dimethoxy-4-methylamphetamine; MDE, 3,4-methylenedioxy-N-ethylamphetamine; MDMA, 3,4-methylenedioxy-N-methylamphetamine; PMA,
p-methoxyamphetamine; PMMA, p-methoxymethamphetamine; TMA, 3,4,5-trimethoxyamphetamine; IS, 2,3-dimethoxyphenethylamine-d3.
Table II. Validation parameters
Compound
tR (min)
r ± SD (n = 5)
y = ax + b (n = 5)
LOQ (ng/mL)
LOD (ng/mL)
2C-B
2C-I
2C-T-2
2C-T-7
DMA
DOB
DOET
DOM
MDE
MDMA
PMA
PMMA
TMA
3.03
3.39
3.27
3.87
2.59
3.52
3.73
3.15
2.85
2.49
2.30
2.57
2.17
0.998 ± 0.015
0.999 ± 0.011
0.999 ± 0.016
0.998 ± 0.013
0.999 ± 0.024
0.999 ± 0.013
0.999 ± 0.008
0.998 ± 0.011
0.999 ± 0.021
0.999 ± 0.009
0.999 ± 0.014
0.998 ± 0.017
0.997 ± 0.012
y = 2.2895x + 0.1515
y = 1.6691x + 0.1811
y = 1.2307x + 0.1785
y = 0.9736x + 0.2057
y = 0.9591x − 0.0271
y = 1.922x + 0.1807
y = 0.9164x + 0.1573
y = 1.108x + 0.0493
y = 0.9819x − 0.2373
y = 1.0967x − 0.2097
y = 4.9197x − 0.0695
y = 1.7031x − 0.1245
y = 1.6812x + 0.2365
19
12
13
14
20
19
15
19
9
10
19
18
13
6
4
4
5
3
6
5
6
3
3
6
6
4
tR, retention time; SD, standard deviation; LOQ, limit of quantitation; LOD, limit of detection.
precursor/product ion transitions monitored are reported in Table I.
The ion source temperature was set at 400°C. The ion spray voltage
was set at 5,000 V, the curtain gas (CUR) was set at six arbitrary
units and the collision gas (CAD) also at six arbitrary units. The optimized MS parameters are reported in Table I. Qualitative analysis was
performed according to the selected multiple reaction monitoring
(MRM) transitions and retention times. Positive analyte identification
in samples required retention times to be within ±0.20 min of the
average retention time of reference standards. Since two product
ions were selected for each analyte, a further criterion of identification
was to consider the ratio of the qualifier transition to the quantifier
transition, which was required to be within ±30% of the average measured ratio from the calibration curve samples (16). Data acquisition
was accomplished using the Applied Biosystem Analyst version 1.6
software. The Applied Biosystem MultiQuant version 2.1 software
was used for data quantification, using the IS method.
197
LC–MS-MS Analysis of 13 Phenethylamines in Amniotic Fluid
Method validation
Reliable qualitative and quantitative analysis constitutes the basis of a
consistent toxicological assay in the field of clinical and forensic toxicology. For this reason, the method was validated according to the
accepted guidelines (17–19) using drug-free AF samples obtained
from different sources. The parameters determined were selectivity,
linearity, limit of determination (LOD), limit of quantitation (LOQ),
precision, accuracy, matrix effect and analyte stability.
Selectivity is defined as the ability of a bioanalytical method to
measure unequivocally and to differentiate the analytes from other
components which may be expected to be present, such as impurities
and matrix components (20). This was assessed by analyzing 10 blank
AF samples from different sources, extracted as described above. The
presence of possible interference from endogenous or exogenous substances was verified by monitoring the MRM chromatograms specific
for each investigated compound and the IS at their expected retention
times. The absence of interference between the IS and the analytes was
also determined by analyzing three blank AF samples fortified only
with IS (zero standard), and three blank samples fortified only with
the analytes, respectively.
Calibration curves were prepared by fortifying blank AF samples
with IS (100 ng/mL) and the 13 target drugs at 6 concentrations (10,
25, 50, 100, 200 and 400 ng/mL), which were then extracted and analyzed as described above. The linearity of the compound-to-IS peak
area ratio versus the theoretical concentration was verified in the AF
using a 1/x weighted linear regression. The correlation coefficients
(r) and the linearity were tested on a set of five calibration curves.
The acceptance criterion for a calibration curve was an r of 0.990 or
better (21).
The limits of determination (LODs) and the limits of quantitation
(LOQs) were determined by the signal-to-noise ratio (S/N) method by
analyzing blank samples extracted as described above. S/N values of
greater than 3 and 10 were considered as the LOD and LOQ, respectively.
Accuracy was determined as % recovery. To assess this parameter,
the standard mix of the analytes was used to spike AF blank samples
from different sources in order to obtain final concentrations of 25,
Table III. Matrix effect, recovery and repeatability
Compound
PMA
PMMA
TMA
DMA
DOM
DOET
DOB
2C-B
2C-I
2C-T-2
2C-T-7
MDMA
MDE
Concentration (ng/mL)
25
200
400
25
200
400
25
200
400
25
200
400
25
200
400
25
200
400
25
200
400
25
200
400
25
200
400
25
200
400
25
200
400
25
200
400
25
200
400
Matrix effect (%)
−3.44
−6.79
−5.55
−6.25
−6.77
−9.06
−8.65
−4.53
−2.96
−0.76
−3.05
−3.78
−10.7
−6.97
−4.99
−9.30
−11.5
−8.90
−7.87
−6.97
−7.02
−8.82
−5.45
−10.2
−7.36
−8.21
−6.60
−10.6
−9.45
−7.31
−4.09
−9.34
−2.29
−4.50
−6.24
−6.33
−2.87
−8.53
−5.12
Recovery (%)
96.1
79.2
73.0
82.9
88.9
73.5
72.3
88.0
90.5
96.0
92.9
96.1
77.5
88.9
95.0
84.6
89.9
86.9
85.4
95.5
85.2
91.9
94.4
92.8
75.2
91.1
90.3
85.5
85.4
81.3
94.3
75.7
85.0
88.6
85.4
89.0
77.1
78.2
79.3
Repeatability (RSD %)
Intraday
Interday
9.3
11.2
10.5
8.6
7.7
8.4
9.8
6.9
8.2
11.4
12.5
13.0
10.0
9.2
9.3
13.1
14.0
12.5
8.8
8.6
10.2
13.3
12.0
11.9
7.8
8.7
9.6
11.4
11.6
12.0
14.0
12.1
13.0
11.1
9.8
8.6
10.1
12.1
9.7
11.1
11.3
9.8
10.0
9.9
8.5
13.0
12.3
11.2
15.0
14.5
13.5
9.9
10.5
10.8
14.7
14.1
13.5
10.2
10.8
12.0
13.8
13.1
12.7
10.9
11.5
11.8
14.3
13.7
13.5
13.2
12.6
14.1
13.2
10.2
11.0
11.3
10.8
10.7
198
Burrai et al.
200 and 400 ng/mL (n = 5). Recovery was calculated as the ratio of recovered analyte concentration to nominal concentration (calculated
by analyzing standard samples in the initial mobile phase at the
same concentration).
The precision of the method, evaluated at three concentrations (25,
200 and 400 ng/mL), was expressed as the percent relative standard
deviation (RSD). The sample standard deviation (SD) was calculated
for five replicates for each concentration for the intra-day repeatability
and over five consecutive days for the inter-day repeatability.
The matrix effect was also determined for the method (22, 23). The
sample matrix, co-eluting compounds and cross-talk can contribute to
an alteration in analyte ionization and of the overall response. Accordingly,; the competition between analytes and co-eluting unknown matrix compounds with the primary ions formed in the MS interface may
effectively decrease (ion suppression) or increase (ion enhancement)
the efficiency of the protonation of the analytes of interest. The matrix
effect was determined with the post-extraction addition method (24).
Nine drug-free AF samples from different sources were first extracted
as described above and subsequently fortified with analytes at three
different concentrations (25, 200 and 400 ng/mL). For each analyte,
the chromatographic peak areas obtained from the extracts were compared with the corresponding peak areas produced by the reference solutions prepared in the initial mobile phase at the same concentration.
Each sample was analyzed three times. The matrix effect percentage
was calculated according to the following equation:
Matrix effect ð%Þ ¼ mean peak area of }reconstituted
AF extract} mean peak area
× 100:
of }reference solution}
mean peak area of }reference solution}
The freeze-and-thaw stability of the analytes was determined after
performing three freeze-and-thaw cycles on blank AF samples fortified
at a low and high analyte concentration (25 and 400 ng/mL). AF samples (n = 3), fortified with the target compounds, were frozen for 24 h
and then thawed for 2 h at room temperature. This cycle was performed three times. Fresh AF samples (n = 3) were prepared at the
same two concentrations. The stability samples and the fresh samples
were extracted as described above and subsequently analyzed.
Results and discussion
Sample preparation
Sample clean-up is a critical step, especially when a complex matrix
such as AF is analyzed. To the best of our knowledge, the extraction
of these illicit drugs in AF has never been reported in the literature before. The extraction was performed with HLB SPE cartridges, which
have superior reversed phase capacity, created by a balanced ratio of
two monomers, hydrophilic N-vinylpyrrolidone and lipophilic divinylbenzene, that enhance the retention of polar analytes. These cartridges gave good recoveries and low matrix effects on analysis of
extracted samples.
Method validation
The optimization of the sample preparation and analytical parameters
provided adequate separation, resolution and signal-to-noise ratio for
the analytes and the IS. All analytes detected in a positive ion mode
were well separated on the reversed phase HPLC column used. Each
molecule in the concentration range 10–400 ng/mL exhibited a single
chromatographic peak that was easily discernible from the baseline
noise. Qualitative analysis was performed on the basis of analyte retention times and two MRM transitions for each compound (Tables I
and II). Selection of the quantifier and qualifier transitions was based
on transitions from the molecular ion to the most and second-most
predominant fragment ions, respectively. For positive identification
of each analyte, the ratio of the qualifier transition to the quantifier
transition was required to be within ±30% of the average measured
ratio from standards (16). The method was validated according to accepted protocols (17–19).
Figure 1. Chromatogram of a drug-free AF sample fortified with the target analytes (100 ng/mL) and IS (100 ng/mL). This figure is available in black and white in print
and in color at JAT online.
199
LC–MS-MS Analysis of 13 Phenethylamines in Amniotic Fluid
Ten drug-free AF samples were extracted and analyzed in order to
evaluate selectivity, by verifying the absence of potential endogenous
interference. Selectivity was satisfactory, as no interfering peaks were
observed at the same retention times as the target analytes and the IS.
Working calibration curves presented an acceptable linearity range
and correlation coefficients (r), higher than 0.997 for all target compounds (Table II). LODs and LOQs ranged from 3 to 6 ng/mL and
from 9 to 20 ng/mL, respectively (Table II). It is important to emphasize that these values refer to the whole analytical procedure, incorporating mutual ionization suppression and recovery losses, while the
detection limits estimated from solvent calibration curves incorrectly
estimate these values.
Method precision has been evaluated by three replicate injections
of standards prepared in blank AF samples fortified at three concentrations on five consecutive days. The intraday and interday repeatabilities were under 15% (Table III).
Accuracy is expressed as recoveries, determined by analyzing fortified AF samples since no certified reference materials were available
for phenethylamines in this matrix. The recoveries were between 72.3
and 96.1% (Table III). The chromatogram of a drug-free AF sample
fortified with the target analytes and IS are given in Figure 1. The chromatographic separation of all compounds was achieved in 4 min. In
order to evaluate the carryover from previous injections, an extract
of a drug-free AF sample has been analyzed immediately after the
highest concentrations used in the calibration range. No quantifiable
carryover was observed for any analyte. For all compounds, the loss
observed after three freeze-and-thaw cycles was lower than 20%
(data not shown).
In vivo application
The validated method was applied to the analysis of 194 test samples
of human AF collected during amniocentesis. The obtained results
were correlated with the information collected during interviews
with the mothers. No mothers (n = 194) reported any intake of drug
of abuse during pregnancy, and this was confirmed by the analytical
results which revealed no detectable concentrations of the 13 phenethylamines in their AF samples.
3.
4.
5.
6.
7.
8.
9.
10.
11.
12.
13.
Conclusion
The present method for determination of 13 illicit phenethylamines in
AF samples was validated according to international guidelines. It may
prove a useful method in hospitals to identify the intake of these substances during pregnancy, in order to take prompt medical action with
respect to the mother and the child. Although the collection of an AF
sample is more troublesome than other conventional matrices, it gives
a more direct measure of fetal exposure than maternal blood, as it
indicates actual drug concentrations that have passed the placental
barrier. The literature concerning these drugs in pregnancy and their
measurement is limited and to the best of our knowledge, no other
method in AF has been developed.
References
1. Broening, H.W., Morford, L.L., Inman-Wood, S.L., Fukumura, M.,
Vorhees, C.V. (2001) 3,4-methylenedioxymethamphetamine (ecstasy)induced learning and memory impairments depend on the age of exposure
during early development. Journal of Neuroscience, 21, 3228–3235.
2. Aguirre, N., Barrionuevo, M., Lasheras, B., Del Rio, J. (1998)
The role of dopaminergic systems in the perinatal sensitivity to
14.
15.
16.
17.
18.
19.
20.
3,4-methylenedioxymethamphetamine-induced neurotoxicity in rats.
Journal of Pharmacology and Experimental Therapy, 286, 1159–1165.
Huestis, M.A., Choo, R.E. (2002) Drug abuse’s smallest victims: in utero
drug exposure. Forensic Science International, 128, 20–30.
Ramamoorthy, J.D., Ramamoorthy, S., Leibach, F.H., Ganapathy, V.
(1995) Human placental monoamine transporters as targets for amphetamines. American Journal of Obstetrics & Gynecology, 173, 1782–1787.
Campbell, N.G., Koprich, J.B., Kanaan, N.M., Lipton, J.W. (2006) MDMA
administration to pregnant Sprague–Dawley rats results in its passage to the
fetal compartment. Neurotoxicology and Teratology, 28, 459–465.
LaGasse, L.L., Wouldes, T., Newman, E., Smith, L.M., Shah, R.Z.,
Derauf, C. et al. (2011) Prenatal methamphetamine exposure and neonatal
neurobehavioral outcome in the USA and New Zealand. Neurotoxicology
and Teratology, 33, 166–175.
Singer, L.T., Moore, D.G., Fulton, S., Goodwin, J., Turner, J.J.D., Min, M.
O. et al. (2012) Neurobehavioral outcomes of infants exposed to MDMA
(Ecstasy) and other recreational drugs during pregnancy. Neurotoxicology
and Teratology, 34, 303–310.
McFarlane, J., Parker, B., Soeken, K. (1996) Physical abuse, smoking, and
substance use during pregnancy: prevalence, interrelationships, and effects
on birth weight. Journal of Obstetric, Gynecologic & Neonatal Nursering,
25, 313–320.
Billing, L., Eriksson, M., Jonsson, B., Steneroth, G., Zetterstrom, R. (1994)
The influence of environmental factors on behavioural problems in 8-yearold children exposed to amphetamine during fetal life. Child Abuse
Negligence, 18, 3–9.
Cernerud, L., Eriksson, M., Jonsson, B., Steneroth, G., Zetterstrom, R.
(1996) Amphetamine addiction during pregnancy: 14-year follow-up of
growth and school performance. Acta Paediatrica, 85, 204–208.
Burrai, L., Nieddu, M., Trignano, C., Carta, A., Boatto, G. (2015) LC-MS/
MS analysis of acetaminophen and caffeine in amniotic fluid. Analytical
Methods, 7, 405–410.
Decree of the Italian Republic President, n. 309/1990. “Testo unico delle
leggi in materia di disciplina degli stupefacenti e sostanze psicotrope, prevenzione, cura e riabilitazione dei relativi stati di tossicodipendenza”.
“Law for the discipline of abuse drugs and psychotropic substances, prevention, treatment and rehabilitation of drug addiction”. Italian Official Gazette No. 25/1990, Suppl.Ord. No. 67.
Italian Decree “Provvedimento No. 99/cu del 30/10/2007, Intesa, ai sensi
dell’articolo 8, comma 6, della legge n. 131/2003, in materia di accertamento di assenza di tossicodipendenza”. “Measure No. 99/cu del 30/10/2007,
Agreement for the assessment of a drug addiction status, according to the
article 8, comma 6, of the law n. 131/2003”. Italian Official Gazette No.
266/2007.
Council Decision 2003/847/JHA of 27 November 2003 concerning control
measures and criminal sanctions in respect of the new synthetic drugs 2C-I,
2C-T-2, 2C-T-7 and TMA-2.
Council decision 2002/188/JHA of 28 February 2002 concerning control
measures and criminal sanctions in respect of the new synthetic drug
PMMA.
Kacinko, S.L., Xu, A., Homan, J.W., McMullin, M.M., Warrington, D.M.,
Logan, B.K. (2011) Development and validation of a liquid chromatography–tandem mass spectrometry method for the identification and quantification of JWH-018, JWH-073, JWH-019, and JWH-250 in human
whole blood. Journal of Analytical Toxicology, 35, 386–393.
Peters, F.T., Maurer, H.H. (2002) Bioanalytical method validation and its
implications for forensic and clinical toxicology. Accreditation and Quality
Assurance, 7, 441–444.
Taverniers, I., de Loose, M., Van Bockstaele, E. (2004) Analytical method
validation and quality assurance. Trends in Analytical Chemistry, 23,
533–536.
Peters, F.T., Drummer, O.H., Musshoff, F. (2007) Validation of new methods. Forensic Science International, 165, 216–224.
Shah, V.P., Midha, K.K., Hill, H.M., Hulse, J.D., McGilveray, I.J.,
McKay, G. et al. (2000) Bioanalytical method validation—a revisit with a
decade of progress. Pharmaceutical Research, 17, 1551–1557.
200
21. Cao, Z., Kaleta, E., Wang, P. (2015) Simultaneous Quantitation of 78
Drugs and Metabolites in Urine with a Dilute-And-Shoot LC-MS-MS
Assay. Journal of Analytical Toxicology, 39, 335–346.
22. Souverain, S., Rudaz, S., Veuthey, J.L. (2004) Matrix effect in LC-ESI-MS
and LC-APCI-MS with off-line and on-line extraction procedures. Journal
of Chromatography A, 1058, 61–66.
Burrai et al.
23. Annesley, T. (2003) Ion suppression in mass spectrometry. Clinical
Chemistry, 49, 1041–1044.
24. Matuszewski, B.K., Constanzer, M.L., Chavez-Eng, C.M. (2003)
Strategies for the assessment of matrix effect in quantitative
bioanalytical methods based on HPLC−MS/MS. Analytical Chemistry,
75, 3019–3030.
© Copyright 2026 Paperzz