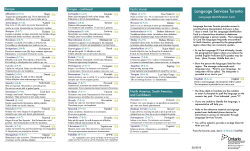
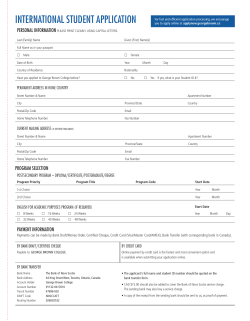
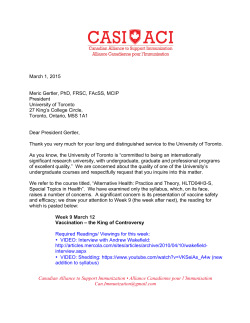
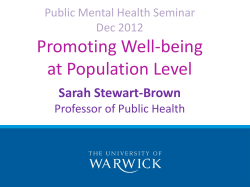
2011 Neighbourhood Demographic Estimates
112.
Beechborough-Greenbrook
(Note: These are inititial neighbourhood estimates and are subject to change.)
G R E E N B R O OK D R
IN
D
U
K EE LE
E
ST
AV
Y
Y
CA
ST
L
EL
D
AV
E
CNR
R
ST
ST
RA
I
EF
BLAC
BL A CK C R EE K DR
LONBO ROUG H A V E
E
K CR
EK
E G L INTON A V E W
TSNS 2020 Snapshot
26.5
NEI Score
New NIA
Unemployment
11.6
Community Space
19.1
Low Income
28.6
Walk Score
62.0
Social Assistance
22.8
Healthier Food
3.4
HS Graduation
1
Green Space
39.2
Marginalization
3.4
Mortality
306.7
Post Secondary
41.6
Mental Health
65.7
Voting
39.6
Hospitalizations
324.5
Diabetes
12.5
Population
400
300
200
100
0
100
Male 200
300
Female
Female
Children
0-14 years
1,235 (19%)
City Rate: 15%
Youth
15-24 years
860 (13%)
City Rate: 13%
Working Age
25-54 years
2,940 (45%)
City Rate: 46%
Wellbeing Toronto: www.toronto.ca/wellbeing
Demographics: www.toronto.ca/demographics
Prepared by Social Policy, Analysis & Research
Social Development, Finance & Administration
Pre-Retirement
55-64 years
670 (10%)
City Rate: 12%
100+
95-99
90-94
85-89
80-84
75-79
70-74
65-69
60-64
55-59
50-54
45-49
40-44
35-39
30-34
25-29
20-24
15-19
10-14
Male
0-4
6,488
54%
5-9
Total Population
46%
Seniors
65+ years
770 (12%)
City Rate: 14%
Source: 2011 Census / National Household Survey
Copyright 2014 City of Toronto. All rights reserved.
Date of Publication: March 2014
Contact: [email protected]
1
2011 Neighbourhood Demographic Estimates
112.
Beechborough-Greenbrook
(Note: These are inititial neighbourhood estimates and are subject to change.)
Private Dwellings by Structure Type
Total Number of
Private Dwellings
2,665
26%
Single-Detached House
26%
25%
Apartment, 5+ Storeys
41%
3%
Semi-Detached House
Row House
7%
1%
6%
3%
Duplex
4%
43%
Apartment, < 5 Storeys
16%
Beechborough-Greenbrook
City of Toronto
Number of Census Families by Size of Family
855
Number of People by Living Arrangements
Living with
family
475
290
5,050
Living with
other relatives
265
Living with nonrelatives only
295
Living alone
840
78%
of population
4%
of population
5%
of population
135
2 people
3 people
4 people
5 or more
people
Seniors 65+
living alone
Wellbeing Toronto: www.toronto.ca/wellbeing
Demographics: www.toronto.ca/demographics
Prepared by Social Policy, Analysis & Research
Social Development, Finance & Administration
230
13%
of population
30%
of seniors 65+
Source: 2011 Census / National Household Survey
Copyright 2014 City of Toronto. All rights reserved.
Date of Publication: March 2014
Contact: [email protected]
2
2011 Neighbourhood Demographic Estimates
112.
Beechborough-Greenbrook
(Note: These are inititial neighbourhood estimates and are subject to change.)
Mother Tongue (Single-Response)
Home Language (Single-Response)
NonOfficial
29%
NonOfficial
42%
English
58%
French
0%
English
71%
French
0%
City rate for non-official mother tongue: 46%
City rate for non-official home language: 30%
Top-10 Non-Official Mother Tongue Languages
Portuguese
Portuguese
795
Italian
410
Spanish
285
Tagalog (Pilipino, …
Somali
Top-10 Non-Official Home Languages
Italian
230
Spanish
220
Somali
170
Tagalog (Pilipino, …
115
550
110
105
Vietnamese
95
Tamil
75
Tamil
90
Vietnamese
75
Turkish
50
Turkish
50
Gujarati
45
Gujarati
35
Arabic
35
Akan (Twi)
20
Note: "n.i.e." = not included elsewhere; "n.o.s." = not otherwise specificed
Knowledge of Official Languages
English Only
92%
French Only
City Rate: 86%
English and
French
0%
City Rate: 0%
4%
City Rate: 9%
Wellbeing Toronto: www.toronto.ca/wellbeing
Demographics: www.toronto.ca/demographics
Prepared by Social Policy, Analysis & Research
Social Development, Finance & Administration
Neither Official
Language
4%
City Rate: 5%
Source: 2011 Census / National Household Survey
Copyright 2014 City of Toronto. All rights reserved.
Date of Publication: March 2014
Contact: [email protected]
3
2011 Neighbourhood Demographic Estimates
112.
Beechborough-Greenbrook
(Note: These are inititial neighbourhood estimates and are subject to change.)
Period of Immigration
Beechborough-Greenbrook
49%
City of Toronto
43%
39%
33%
15%
16%
3%
Born in Canada
Before 2001
2001-2011
Top-5 Birth Country for All Immigrants
Non-Permanent Residents
Top-5 Ethnic Origins
Other places of birth in
Americas
645
Portugal
Portuguese
480
1,050
Italian
865
Jamaica
410
Jamaican
640
Italy
390
East Indian
610
India
Canadian
280
1,780
South Asian
85
615
Latin American
Other places of birth in
Africa
50
Philippines
50
Jamaica
Black
150
Turkey
505
Top-5 Visible Minority Group
Top-5 Birth Country for Recent Immigrants (2006-2011)
Other places of birth in
Americas
3%
Filipino
Southeast Asian
Visible Minority as
Percentage of Pop.
20
Wellbeing Toronto: www.toronto.ca/wellbeing
Demographics: www.toronto.ca/demographics
Prepared by Social Policy, Analysis & Research
Social Development, Finance & Administration
445
215
125
54%
Overall City of
Toronto Rate
49%
Source: 2011 Census / National Household Survey
Copyright 2014 City of Toronto. All rights reserved.
Date of Publication: March 2014
Contact: [email protected]
4
2011 Neighbourhood Demographic Estimates
112.
Beechborough-Greenbrook
(Note: These are inititial neighbourhood estimates and are subject to change.)
Labour Force Status
Total
Population 15+
Years
Highest Educational Attainment for Pop Age 25-64 Yrs
26%
No certificate
In Labour
Force
11%
32%
High School
21%
42%
5,215
3,150
Participation
Rate
60%
Employment
Rate
53%
Unemployment
Rate
12%
64%
City Rate
58%
City Rate
Postsecondary
69%
Beechborough-Greenbrook
9%
City Rate
City of Toronto
Housing Affordability and Suitability
After-Tax Household Income
(Percentage of Households)
Under $5,000
33%
Spending 30% or more of
household total income
on shelter costs
1%
$5,000 to $9,999
35%
$10,000 to $14,999
2%
4%
$15,000 to $19,999
20%
Does not meet National
Occupancy Standard
$20,000 to $29,999
15%
$30,000 to $39,999
14%
Beechborough-Greenbrook
12%
City of Toronto
19%
$40,000 to $49,999
9%
$50,000 to $59,999
9%
$60,000 to $79,999
Notes on Data Quality:
$80,000 to $99,999
Neighbourhood data are preliminary estimates
and are subject to change. This profile does not
compare 2011 NHS results with those from earlier
Census releases. This is because NHS data was
collected differently than data from the 2006 and
are not directly comparable.
$100,000 and over
Percent of Population in LowIncome (LIM-AT)
11%
7%
9%
31%
City Rate: 19%
Wellbeing Toronto: www.toronto.ca/wellbeing
Demographics: www.toronto.ca/demographics
Prepared by Social Policy, Analysis & Research
Social Development, Finance & Administration
Source: 2011 Census / National Household Survey
Copyright 2014 City of Toronto. All rights reserved.
Date of Publication: March 2014
Contact: [email protected]
5
© Copyright 2026 Paperzz