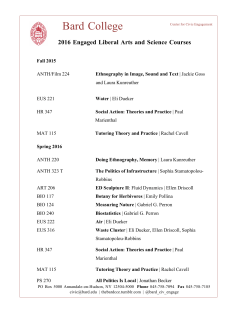
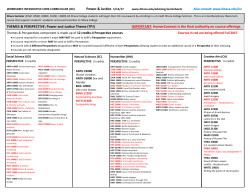
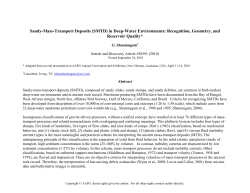
This course is about VARIATION: its causes, effects, and history.
For thousands of years, western thought had accepted the Platonic
view that an object’s ultimate reality was its essence or ideal type.
In biology, essentialism gave rise to the assumption that species are
held together by their underlying, unchanging "types“ or ideal forms.
On this view, individual variations are departures from the essence of
a species; thus they are imperfections that make individuals less
representative of the true nature of their species.
Darwin destroyed essentialism in biology and
replaced it with a radical new idea: variationism.
Variationism is the view that species are united only by
recent common ancestry. Thus every individual is equally
representative of the species; the average phenotype is
just a statistical abstraction, not the reflection of some
higher, more pure or more ultimate reality.
Anth/Biol 5221, 26 August 2015
What causes variation, and why is some
of it heritable (kids resemble parents?)
Darwin didn’t know. Mendel’s discovery of
genes (1865) was rediscovered in 1900, and
most of the early geneticists concluded that
genes and Darwin were incompatible.
R.A. Fisher (1890-1962) invented the analysis of
variance (ANOVA) in 1918 to show that Darwin’s
ideas about the inheritance of variation were
consistent with Mendel’s genetics.
This is one of the deepest, most general and
most transformative ideas in the history of
human thought - and oddly, most invisible!
Fisher remains an obscure nerd celebrated by
almost no one other than statisticians (right).
Meanwhile, ANOVA has become the foundation
of statistical thinking and practice in industry,
government and medicine as well as in science.
Heights of 51
students in
Anth/Biol 5221,
fall 2011
(measured in
inches)
They vary.
How much?
How should we
describe the
variation?
68
61
66
75
70
64
65
65
70
69
60
67
66
72
61
66
74
73
63
69
63
69
71
71
77
70
66
65
69
66
62
67
71
70
69
72
61
68
64
71
70
74
71
73
64
71
62
69
64
64
70
Axelrod, Rachel
Baca, Amanda
Barlow-Hilmo, Kim
Blackhorst, Michael
Carothers, Jennifer
Casagranda, Brooke
Cash, Gabriela
Chase, Gillian
Davis, Samantha
Dimond, Ben
Do, Michael
Fox, Robert
Gibbs, Katie
Glosenger, Andrew
Guten, Maria
Hardman, Kennedy
Howell, Ryan
Humes, Ryan
Huynh, Tina
Iliff, Anthony
Ingram, Elise
Jen_Twu, Jonas
Johnson, Deborah
Jones, Carson
Malovich, Michael
Marble, Stephanie
McCann, Jennifer
Munoz, Adriana
Nelson, Christopher
Newton, Brittany
Nguyen, Than
Noe, Jordan
Park, James
Price, Brock
Reid, Doug
Rudd, Jared
Rueckert, Katie
Schweitzer, John
Silver, Alyssa
Simkins, Richard
Sorensen, Jeff
Spackman, Derek
Spencer, Cody
Spencer, Zac
Staufer, Annmarie
Stephens, Jesse
Tang, Kim
Thomas, Nathan
Trakhimets, Alesia
Trotter, Ten
ZoBey, Scott
60
61
61
61
62
62
63
63
64
64
64
64
64
65
65
65
66
66
66
66
66
67
67
68
68
69
69
69
69
69
69
70
70
70
70
70
70
71
71
71
71
71
71
72
72
73
73
74
74
75
77
Do, Michael
Baca, Amanda
Guten, Maria
Rueckert, Katie
Nguyen, Than
Tang, Kim
Huynh, Tina
Ingram, Elise
Casagranda, Brooke
Silver, Alyssa
Staufer, Annmarie
Trakhimets, Alesia
Trotter, Ten
Cash, Gabriela
Chase, Gillian
Munoz, Adriana
Barlow-Hilmo, Kim
Gibbs, Katie
Hardman, Kennedy
McCann, Jennifer
Newton, Brittany
Fox, Robert
Noe, Jordan
Axelrod, Rachel
Schweitzer, John
Dimond, Ben
Iliff, Anthony
Jen_Twu, Jonas
Nelson, Christopher
Reid, Doug
Thomas, Nathan
Carothers, Jennifer
Davis, Samantha
Marble, Stephanie
Price, Brock
Sorensen, Jeff
ZoBey, Scott
Johnson, Deborah
Jones, Carson
Park, James
Simkins, Richard
Spencer, Cody
Stephens, Jesse
Glosenger, Andrew
Rudd, Jared
Humes, Ryan
Spencer, Zac
Howell, Ryan
Spackman, Derek
Blackhorst, Michael
Malovich, Michael
60
77
Heights of 51 students in Anth/Biol 5221, fall 2011
mean = 67.8 in, variance = 16.2 in2, standard deviation (sd) = 4.03 in
Heights of 25 women and 26 men in Anth/Biol 5221
Analysis in English units (inches)
The mean (M) is the average or “expected” value.
The variance (V) is the average or “expected” squared deviation from the mean.
26 males : M = 70.4
V = 10.013
25 fems
: M = 65.1
V =
51 all
: M = 67.8
V = 16.236
8.154
The women are 25/51 = 0.490 of the sample, and 26/51 = 0.510 are men.
V(within) =
9.102 = 0.490*8.15 + 0.510*10.01
V(among)
=
7.134 = 0.490*(65.1 - 67.8)^2 + 0.510*(70.4 - 67.8)^2
V(total)
=
16.236
fraction “explained by sex” =
7.134/ 16.236 = 0.44
Heights of 25 women and 26 men in Anth/Biol 5221
Analysis in metric units (centimeters)
26 males : M = 178.8
V =
66.485
25 fems
: M = 165.4
V =
53.366
51 all
: M = 172.2
V = 104.454
V(within) =
60.054 = 0.490*53.37 + 0.510*66.49
V(among)
=
44.400 = 0.490*(165.4 - 172.2)^2 + 0.510*(178.8 - 172.2)^2
V(total)
= 104.454
fraction “explained by sex” =
44.400/104.454 = 0.43
Heights of 252 women and 223 men in the Utah Genetic Reference Project
252 females : M = 165.6
V =
46.962
223 males
: M = 180.2
V =
49.782
475 total
: M = 172.5
V = 101.694
V(within) =
48.286 = 0.531*46.96 + 0.469*49.78
V(among)
=
53.408 = 0.531*(165.6 - 172.5)^2 + 0.469*(180.2 - 172.5)^2
V(total)
= 101.694
fraction “explained by sex” =
53.408/101.694 = 0.53
Most of the individuals are siblings in 36
families with 1-12 sons and 1-12 daughters.
90% of the remaining variance is explained
by genetic differences among the families.
And 10% by effects of the environment
(what remains after the effects of sex and
of genes have been “removed” statistically).
These people grew up in a very healthy and
uniform environment (20th-century Utah).
In other times and places, the split tends
to be 80/20 or even 70/30.
For other traits, in most species, it may be
anywhere from 80/20 to 20/80.
The families
disaggregated
Populus tremuloides (quaking aspen)
East Canyon site, clone #2
Sheets 1-10
Top of East Canyon
Three clones
Two trees/clone
Sheets 11-20
Top of Millcreek
Three clones
Two trees/clone
4 x 10 = 40
Leaves/clone
Width
Length
Leaf-shape ratio
R = Length / Width
Upper
Millcreek
East
Canyon
Leaf shape within and among six quaking aspen clones
mean
variance
Clone 1
0.902
0.00351
Clone 2
0.992
0.00237
Clone 3
1.075
0.00271
Clone 1
0.861
0.00552
Clone 2
1.028
0.00200
Clone 3
0.918
0.00947
All
0.963
0.00990
Upper
Millcreek
East
Canyon
Analysis of variance (ANOVA)
mean
variance
Clone 1
0.902
0.00351
Clone 2
0.992
0.00237
Clone 3
1.075
0.00271
Clone 1
0.861
0.00552
Clone 2
1.028
0.00200
Clone 3
0.918
0.00947
All
0.963
0.00990
Variance among clones
= var(0.902, 0.992, … , 0.918)
= 0.00564
Variance within clones
= mean(0.00351, … , 0.00947)
= 0.00426
Total variance
= 0.00564 + 0.00426
= 0.00990
Fraction explained by clones
= 0.00564 / 0.00990
= 0.57
Willow
Heights
Upper
Millcreek
East
Canyon
Leaf shape within and among nine quaking aspen clones
mean
variance
Clone 1
0.898
0.00235
Clone 2
0.994
0.00251
Clone 3
1.067
0.00232
Clone 1
0.831
0.00276
Clone 2
1.023
0.00180
Clone 3
0.890
0.00712
Clone 1
0.938
0.00347
Clone 2
0.890
0.00850
Clone 3
0.896
0.00173
All
0.936
0.00879
Note: data for EC and UM
differ slightly from earlier
analysis. I don’t know why!
Willow
Heights
Upper
Millcreek
East
Canyon
Analysis of variance (ANOVA)
mean
variance
Clone 1
0.898
0.00235
Clone 2
0.994
0.00251
Clone 3
1.067
0.00232
Clone 1
0.831
0.00276
Clone 2
1.023
0.00180
Clone 3
0.890
0.00721
Clone 1
0.938
0.00347
Clone 2
0.890
0.00850
Clone 3
0.896
0.00173
All
0.936
0.00879
Variance among clones
= var(0.898, 0.994, … , 0.896)
= 0.00517
Variance within clones
= mean(0.00235, … , 0.00173)
= 0.00362
Total variance
= 0.00517 + 0.00362
= 0.00879
Fraction explained by clones
= 0.00517 / 0.00879
= 0.59
Leaf
length
alone
49.175
45.975
48.725
(5.945) <35.34437>
(2.650) < 7.02438>
(3.442) <11.84938>
40
40
40
51.475
54.875
40.525
(4.266) <18.19938>
(5.414) <29.30937>
(3.413) <11.64938>
40
40
40
40.625
49.675
49.025
(3.022) < 9.13438>
(4.209) <17.71937>
(3.752) <14.07438>
40
40
40
47.786
(6.086) <37.04036>
360
var(among) = 19.89543
var(within) = 17.14493
sum
= 37.04036
Leaf
width
alone
Explained by clones
= 19.895 / 37.040
= 0.54
54.925
46.350
45.700
(7.387) <54.56937>
(3.380) <11.42750>
(3.156) < 9.96000>
40
40
40
62.050
53.775
45.775
(4.780) <22.84750>
(6.207) <38.52438>
(4.356) <18.97438>
40
40
40
43.400
56.125
54.775
(3.426) <11.74000>
(4.920) <24.20938>
(3.805) <14.47438>
40
40
40
51.431
(7.642) <58.39518>
360
var(among) = 35.42552
var(within) = 22.96965
sum = 58.39518
Explained by clones
= 35.425 / 58.395
= 0.61
Silver Lake study site
(Brighton, elevation ~9,000 ft)
23 August 2015
(note smoke from west-coast wildfires)
2 October 2011
c8
c9
c12
c2a c1
c4-6
c5a
c7
c3
c14
For the seven clones
with more than two
sampled trees, clone
membership explains
75% of the variation
in the trees’ mean
W/L ratios.
Within clones, W/L
increases going west
(i.e., trees with larger
west longitudes tend
to have broader
leaves, on average).
c8
c9
c12
c2a c1
c4-6
c5a
c7
c3
c14
Summary
Every quantitative phenotype you can think of varies.
Often the distributions are roughly normal.
If some of this variation is heritable, then evolution by natural
selection is inevitable (Darwin’s world-changing insight).
Fisher invented ANOVA to show that darwinian evolution of
quantitative traits is compatible with mendelian genetics.
(If many genetic loci make small, independent contributions,
and so does the environment).
The paper will soon have its 100th anniversary (2018).
It + Darwin changed how we think about variation.
Now the variance can be “partitioned” into contributions
associated with “factors” that “explain” the total.
Often (but not always) we can interpret the factors as causes.
For example, “genes” and “environment. ”
© Copyright 2026 Paperzz