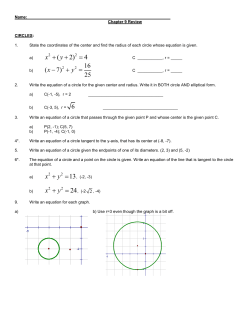
Educational Research and Evaluation
2004, Vol. 10, No. 1, pp. 41–70
Effective Students and Families: The Importance
of Individual Characteristics for Achievement
in High School1
Rene Veenstra1 and Hans Kuyper2
1
Department of Sociology, University of Groningen, The Netherlands, and 2GION, Groningen
Institute for Educational Research, University of Groningen, The Netherlands
ABSTRACT
The school careers in secondary education are influenced by individual and environmental
characteristics. Using longitudinal data on 7,000 students from 450 classes in 150 schools in
The Netherlands, we present results on the importance of student and family characteristics for
achievement (text comprehension and mathematics combined in a multivariate multilevel
model) in high school. The main question is: To what extent do characteristics at the individual
level influence the achievement of students in the 3rd year of secondary education? In order to
answer this question, we use a structure of concentric circles. The achievement of students on
text comprehension and mathematics appears to be determined by both structural and cultural
characteristics. Student characteristics account for more variance than family characteristics.
INTRODUCTION
Many researchers have investigated the influence of student and family characteristics on achievement (e.g., Bourdieu, 1977; De Graaf, 1987; Kohn, 1977;
Meijnen, 1977; Van der Velden, 1991). In many of these studies, researchers
1
We are grateful for comments on early drafts of this paper from Jules Peschar, Tom Snijders,
Anne Bert Dijkstra, and two anonymous ERE reviewers. During the data collection and
preparation we received support from Statistics Netherlands (Louis Lacon and Peter Cremers),
GION (Bernadet de Jager, Greetje van der Werf, Hans Kuyper, Henk Guldemond, and Miranda
Lubbers), and OCTO (Charles Matthijssen, Emmy Hornstra, Hennie Brandsma, and Rien Steen).
Address correspondence to: Rene Veenstra, Department of Sociology, University of Groningen,
Grote Rozenstraat 31, 9712 TG Groningen, The Netherlands. E-mail: [email protected]
Manuscript submitted: November 2, 2001.
Accepted for publication: June 27, 2002.
1380-3611/04/1001–041$16.00 # Taylor & Francis Ltd.
42
VEENSTRA & HANS KUYPER
RENE
did not restrict themselves to describing differences in educational outcomes.
More and more, researchers sought to find out why there are differences
between students from lower and higher social classes, between boys and
girls, between ethnic minority and native students, and between children from
single-parent and dual-parent families. However, as yet the cause of
differences in the achievements of students can only be explained in part.
One of the reasons for this might be that most researchers have investigated
the influence of just a few characteristics on achievements. In our view,
researchers are faced with the challenge of investigating the many
characteristics of families and students in conjunction.
Veenstra (1999) has developed a structure of (concentric) circles to order
the sources of influence on academic achievement (see Fig. 1).
Fig. 1. Structure of concentric circles.
EFFECTIVE STUDENTS AND FAMILIES
43
Apart from the dependent variable(s) in the center, Veenstra (1999)
distinguishes a total of five categories at the individual level: one category
with structural characteristics and four categories with cultural characteristics. These categories form a structure of concentric circles (see Fig. 1). This
structure is inspired on Ryan and Adams (1995).
The structural characteristics, such as the socioeconomic status, the gender,
and the ethnicity, form the outermost circle (the fifth). The cultural
characteristics have been placed as intermediate circles between the structural
characteristics and the dependent variable(s). The general interaction in the
family, which consists of the parenting style, forms the fourth circle. The
scholastic interaction in the family, for instance homework monitoring,
comprises the third circle. The second circle consists of the students’ general
characteristics, such as their activities in their spare time. The scholastic
characteristics of students form the first circle. These comprise, for instance, a
student’s earlier achievements and intelligence.
Using this structure, we aim to arrange the various influences and to offer
more insight into the relations between the characteristics. It would also seem
possible to explain the effects of characteristics such as the socioeconomic
status or the ethnicity on school achievements by means of intermediate
variables. An attempt will be made to explain the effects of characteristics
from the outer circles by means of characteristics from the inner circles. The
influence of characteristics in one circle will be regarded as a whole. This
means that the possible arrangement of connections will not be investigated.
We have applied this structure on data on about 7,000 students from 450
classes in 150 schools (information from the cohort study VOCL’93, a highly
representative sample of students in secondary education in The Netherlands).
Dependent variables are Dutch reading comprehension and mathematics in
the 3rd year of secondary education (similar to grade 9 in the US). The aim of
the study is threefold: (1) to look at the joint contribution of a large number of
characteristics; (2) to use the structure of concentric circles in an empirical
study; (3) to analyze the data in a multilevel analysis with multivariate
dependent variables. The central research question is: To what extent do
characteristics at the individual level influence the achievements of students in
the 3rd year of secondary education?
Before elaborating the theoretical background, some general remarks on
the structure of Dutch education might be helpful. Children start their
education at the age of 4 and leave primary education about 8 years later. Then
they will enter secondary education, which is divided into five tracks:
44
VEENSTRA & HANS KUYPER
RENE
individualized pre-vocational education (IVBO), pre-vocational education
(VBO), junior general secondary education (MAVO), senior general
secondary education (HAVO), and pre-university education (VWO). The
duration of the three lower tracks is 4 years (recently these lower tracks have
been integrated into VMBO), of HAVO 5 and of VWO 6 years. Secondary
schools use the recommendation of primary schools and test scores in their
decision to admit students and to assign them to a particular stream in the 1st
year. These streams represent the five tracks or are a combination of two or
three tracks. In the next grades the classes become more singular tracked.
Theoretical Background
We have used the structure of concentric circles to organize a number of wellknown concepts (variables), which are used as predictors of achievement. The
overview below does not intend to be exhaustive. We concentrate on the
following concepts: ethnicity, socioeconomic status, gender, family composition (circle 5), number of contact hours, parenting style (circle 4), educational
support (circle 3), self-concept, lifestyle (circle 2), intelligence, effort, work
attitude, achievement motivation, and school well-being (circle 1).2
Structural Student and Family Characteristics (Circle 5)
There is much evidence that children from the higher social strata outperform
children from the lower social strata. The school careers also differ between
these groups. Researchers explain the importance of the socioeconomic status
for achievement in at least three different ways, namely income/wealth,
occupational status, and educational status (cf. Paterson, 1992).
Because education is almost free in The Netherlands until the age of 16, the
importance of the financial position of parents for their child’s career will be
relatively low in comparison with many other countries.
Secondly, researchers look at the profession of parents. People with a
higher occupational level often have more autonomy. This autonomy is related
to other characteristics of the family, such as the lifestyle, the parenting style,
and the aspirations of themselves and their children. Parents with a high
occupational level educate their children more authoritatively, whereas
2
There are other aspects that we might add to the review, for example cultural capital (circle 4),
personality characteristics (circle 2), or metacognitive skills (circle 1). However, this
presentation is not exhaustive. It is a first illustration of the use of a structure of concentric
circles.
EFFECTIVE STUDENTS AND FAMILIES
45
parents with a low occupational level educate their children more restrictively
(cf. Meijnen, 1977).
Thirdly, the educational level of parents is important for the scholastic
achievement of their children. Having reached a low standard of education,
parents have less opportunities to support their children. For example, they
have more difficulties in assisting with homework, talking to the teacher about
learning or behavioral problems, and stimulating their child intellectually than
parents with a high educational background. The natural learning climate is
less favorable to the child’s school career in that case. Highly educated parents
have the advantage that they understand the educational system. They know of
the pros and cons of different routes through the educational system.
The importance of the socioeconomic status of parents for the achievement
of children can partially be explained through intermediate characteristics,
such as the educational support, the lifestyle, and the parenting style of
parents. The relation between social strata and achievement might also be
explained by the partial heritability of intelligence. Dronkers (1997a) shows
evidence that the socioeconomic status is related to the start position in
secondary education, and that these differences do not increase further.
Differences in ethnic background might also influence the achievement of
students. In general, Dutch students outperform ethnic minorities (e.g.,
De Jong, 1989; Driessen, 1995), but there are large differences amongst
different ethnic minorities. Especially, the achievement of Moroccan and
Turkish students is low on average, while Western students perform well. The
relation between socioeconomic status and ethnicity is strong in The
Netherlands. Taking one of these characteristics into account, the other
characteristics have a smaller or no effect on the achievement of students.
Besides the lower socioeconomic status of immigrant students, the
language spoken at home and the length of stay in The Netherlands are
aspects of the ethnicity that affect achievement. Differences in culture or
migration history might also explain achievement differences between ethnic
groups. These differences can result in distinctions in educational support,
lifestyle, and parenting style. Moroccan and Turkish parents talk less often
with their children about school and have less knowledge about the Dutch
educational system. In general, they think that education is not their business,
unless the school mentions problems. Nevertheless, most immigrant parents
are hopeful about the ability and the future of their children, but it is doubtful
that these parents have an adequate frame of reference. Dronkers (1997a) also
emphasizes the importance of the migration history.
46
VEENSTRA & HANS KUYPER
RENE
The family composition appears to be also related to the students’
achievement. Even after controlling for relevant background characteristics,
such as scholastic achievement and socioeconomic status, children from
single-parent families have on average a less successful school career than
other children (e.g., Bosman, 1993; Downey, 1994). According to Bosman
(1993) single-parent (mother) families may be more permissive. Bosman
points also at other explanations, such as a decrease of income, less socialadjusted behavior of children, and the fact that single parents have to make
decisions alone. The history of these families is probably important. A divorce
has a larger affect on the behavior and achievement of children than the death
of a parent. The tensions that accompany a divorce have a negative effect on
children (Dronkers, 1997b).
The number of siblings can also exert influence on the achievement of a
student (e.g., Downey, 1995). As the number of children increases, parents can
offer their children fewer resources. If other relevant background characteristics are taken into account, the number of children still has an effect on
achievement (Downey, 1995). The position in the row of children also exerts
influence on the scholastic achievement of a child. Eldest and only children
outperform other children on average (e.g., Falbo & Polit, 1986).
When they enter secondary education, girls perform better on average in
language and boys perform better in mathematics. Girls are placed in higher
tracks of secondary education, but later on choose less often the exact subjects
(pure mathematics, physics, chemistry). They also perform worse on the final
exams in secondary education. However, it has to be taken into account that
girls pass the final exams on average at a higher level than boys do. If all
students, from pre-vocational to pre-university education, were to sit the
exams at the same level, girls would probably perform better than boys.
Sammons (1995) concludes this for Great Britain. The lifestyle might also
explain differences between both groups. This might affect the scholastic
achievement. There is evidence that girls score higher on school well-being,
achievement motivation and effort (homework time) than boys (e.g., Kuyper
& Guldemond, 1997; Kuyper & Swint, 1996).
General Family Interaction (Circle 4)
The first aspect of the family interaction is the parenting style. So-called
authoritative parenting exerts a positive influence on the scholastic achievement of children (e.g., Steinberg, Elmen, & Mounts, 1989; Steinberg,
Lamborn, Dornbusch, & Darling, 1992). Characteristics of this parenting
EFFECTIVE STUDENTS AND FAMILIES
47
style are monitoring, providing support, and autonomy. The influence of authoritative parenting comes largely into play by the parental involvement in schools
and the effort, the achievement motivation, and the self-concept of the child.
There is also evidence that the number of contact hours between parents
and children is important for the scholastic achievement of children. Children
that are often alone do homework less often and have more problems with
finishing their homework. Seeing their parents only occasionally, children
benefit too little from their skills and knowledge (Coleman & Hoffer, 1987).
Muller and Kerbow (1993) make clear that as children are more often alone,
they perform worse.
Scholastic Family Interaction (Circle 3)
Parents can try to stimulate the performance of their children in different
ways. For instance, they can help them with their homework or they can talk
with them about school. However, research outcomes show that the relation
between most aspects of parental educational support and scholastic
achievement of children is negative (e.g., Muller & Kerbow, 1993). The
interpretation is that parents will help more often with homework, will talk
more often to them about their grades, and will contact more often their
teachers when the achievement of students becomes worse. We will name such
parental behavior crisis-intervention.
It is also possible that some parents raise their children with certain
pedagogical principles in mind, for example to learn them work ethos or
particular skills. In that case it is likely that parents will not only talk about
school if the pupil receives bad results but also if he receives good grades. This
grow-intervention might be beneficial for the achievement of pupils and can
be connected to the natural learning climate in family.
General Student Characteristics (Circle 2)
In general, a student brings in his personality and self-concept (e.g., Bandura,
1988; Shavelson, Hubner, & Stanton, 1976). The attribution theory of Weiner
(1979) specifies how the self-concept may influence achievement. A person
with a positive self-concept will be inclined to blame unstable characteristics
for failure. As a result, he will not change his expectations for the completion
of a new, similar task. However, he will ascribe success to stable
characteristics, such as his own (high) ability. Therefore, his expectations
for future success will increase and his positive self-concept will be
confirmed. A person with negative self-concept explains situations the other
48
VEENSTRA & HANS KUYPER
RENE
way round. He will be inclined to blame stable characteristics for failure and
to explain success by unstable characteristics.
The lifestyle of a student outside school can also affect his achievement.
Hanging out with friends or going out indicates a lifestyle which emphasizes
nonscholastic activities. Lots of students spend a large amount of time on such
an activity (Steinberg, 1996). A job can also require much of the student’s
time. Steinberg (1996) reports that students who spend more than 20 hr a week
on a job, do less homework, play truant more often, have a more negative
sense of school well-being and have lower educational aspirations, and
consequently perform worse than students who spend less time on a job.
Scholastic Student Characteristics (Circle 1)
It is often shown that intelligence affects scholastic achievement strongly
(e.g., Fraser, Walberg, Welch, & Hattie, 1987). Neisser et al. (1996) have
given a review of research on intelligence. They claim that heritable factors
affect about 45% of the variance in intelligence of younger children, and about
75% of the variance in intelligence of adolescents. Furthermore, the earlier
achievement of students affects largely their future performance. The earlier
achievement is not the same as the intelligence. Pointing at the mathematics
achievement of students in Japan and Taiwan, Neisser et al. (1996) argue that
their high achievement is primarily the result of differences in culture and
schooling and secondly of differences in intelligence.
The effort of students is important for their achievement. Keith (1982) shows
that as students spend more time on homework, given their intelligence, their
grades become higher (cf. De Jong, Westerhof, & Creemers, 2000). However,
the students with the highest ability do not always work hard. Kuyper and
Swint (1996) argue that most students use an optimalization strategy. They try
to pass the exams with well enough grades and a minimal effort. As a result, in
Dutch research the relation between homework time and performance appears
to be weak or even negative for students following the same track.
The work attitude of students is also relevant. Lots of students do not have
the concentration and discipline to listen to their teacher. According to
Hermans (1981), more than half of the students have problems with
concentration. Students try also to postpone their duties. They take much
time before they start with their homework. This behavior correlates
negatively with the mean grades of students (Kuyper & Swint, 1996).
The motivation of students to strive for success, associated with positive
feelings, affects their achievement also (e.g., Fraser et al., 1987; Steinberg
EFFECTIVE STUDENTS AND FAMILIES
49
et al., 1989). The achievement motivation is also strongly related to the
amount of time students spend on homework.
The school well-being of students depends on many aspects, such as (their
opinion on) school rules and their relations with teachers and classmates.
Rutter, Maughan, Mortimore, and Ouston (1979) state that the school wellbeing of students affects their behavior and exam results. Students’ well-being
at school will affect other characteristics, such as their achievement
motivation, work attitude, and effort.
This overview leads to the following set of predictions, which form together
a specification of the central research question. We predict that the
performance on the text comprehension and mathematics test is higher for:
(1) children belonging to the ethnic majority; (2) children living in two-parent
families; (3) eldest and only children; that (4a) girls outperform boys in text
comprehension; (4b) boys outperform girls in mathematics. We expect that
performance is also higher when the student lives in a family: (5) with a higher
socioeconomic status; (6) with fewer children. We expect that students
perform better on both tests when: (7) the parenting style is more
authoritative; (8) the student has more contact with grown-ups; (9) the
student talks more often with his parents; (10) the parents have been less
involved in ensuring completion of homework. We expect that performance is
better when the student: (11) spends less time hanging out with friends; (12)
spends less time working on a job; (13) spends less time going out; (14) has a
more positive self-concept. We expect that students perform better on the text
comprehension test when: (15) they spend more time reading and working on
hobbies. Finally, we expect that the achievement level is higher when the
student: (16) is more positive about classmates; (17) is more positive about the
teachers and the school rules; (18) has a higher achievement motivation; (19)
postpones homework less often; (20) does homework more days a week; (21)
achieved better on the nonverbal intelligence tests; (22) achieved better on the
language, information processing, and arithmetic tests in year 1.
METHOD
Sample, Data Collection and Response
We investigated the importance of student and family characteristics for
scholastic achievement in a subset of a longitudinal Dutch dataset, which
contains information about students who entered secondary school in 1993.
50
VEENSTRA & HANS KUYPER
RENE
Data were collected in 1994 (year 1) and 1996 (year 3). At the second
occasion, students were about 15 years old. Van der Werf, Lubbers, and
Kuyper (1999) and Veenstra (1999) describe the sample. The sample is highly
representative for all high schools in The Netherlands (Van der Werf et al.,
1999). The subset used in this study consists of about 7,000 students in 450
classes in 150 schools, which are relatively ‘‘complete.’’ At the second
occasion, participation of the schools on the tests was less than 50%. Van der
Werf et al. (1999) discuss the response bias on a number of cognitive variables
assessed in the 1st year. The maximum bias is 0.15 of a standard deviation.
This is considered a small ‘‘effect size.’’
Not only the students but also their parents have answered a questionnaire.
The parent questionnaire contains items about, among other things, family
composition, socioeconomic status, and ethnicity. About 85% of the parents
responded to this questionnaire. In this case the response bias is larger, 0.42
maximum. In addition, nonresponse is high for ethnic minorities in general,
and for Turkish and Moroccan parents in particular (see also Brandsma,
Lugthart, & Van der Werf, 1997).
Variables
Achievement in year 3 (in the US: grade 9) was measured on a text
comprehension and a mathematics test. Both tests were constructed by the Cito
(National Institute for Educational Measurement). The text comprehension test
consists of six texts and 40 multiple choice items. The Cronbach’s alpha of the
scale is 0.78. Test scores range from 10, which is equal to the score that a
student would receive guessing all questions, to 40. For mathematics two
versions were used, namely an A-version for students in the highest three tracks
and a B-version for students in the two lowest (vocational) tracks. The
A-version consists of 27 open and 6 multiple choice questions, the B-version of
31 open and 2 multiple choice questions. Due to an overlap of 7 items, the two
versions could be equated. Equation was performed with the One Parameter
Logistic Model (Verhelst, Glas, & Verstralen, 1995). After the equation
procedure, the reliability is 0.83 for the A- and 0.87 for the B-version. The
scores on the text comprehension and mathematics test have been standardized
into z-scores. These two variables are the dependents in the multilevel
analyses. The variables below are the predictor variables at the student level.
The structural student and family characteristics were gathered by the
school administrations and/or by the parent questionnaire. The school
administrations provided the information about the gender and ethnicity of
the students. The parents answered this for themselves. We make a distinction
EFFECTIVE STUDENTS AND FAMILIES
51
between the following groups: (1) Dutch; (2) Western (e.g., German,
American, or French); (3) Turkish; (4) Moroccan; (5) Postcolonial immigrants
(Antillean, Aruban, Surinam, & Moluccan); (6) Other (for example Central
Europeans or Asians). If a student belongs to one of the last four groups, we
will classify him in the ethnic minority category. Following Brandsma and
Van der Werf (1997), if the student or one of his parents has been born in a
foreign country, the student ‘‘belongs to’’ an ethnic minority. This means that
we include also children from mixed families (for example a Turkish husband
and a Dutch wife).
The family composition and the position of the child were also asked in the
parent questionnaire. The family composition consists of the number of
parents (1 or 2) and the number of children. Following Downey (1995), we
have recoded the number of children (X) into an inverse score (1/X). The
position of the child consists of two dummy variables: only child (0, 1) and
eldest child (0, 1).
The educational level and occupational level of the parents (parent
questionnaire) have five categories each. The educational level pertains to
both parents (if present), the occupational level to the breadwinner only. For
the educational level the categories are: (1) elementary education; (2) lower
tracks of secondary education; (3) higher tracks of secondary education;
(4) academic and senior vocational education; (5) postdoctoral academic
education. And for occupational level: (1) people without a paid job;
(2) workers; (3) tradesmen, farmers, and lower employees; (4) middle
employees; (5) higher employees and independent jobs.
The other variables were taken in the student questionnaire. Students have
given information about the time they spend at home, and about the time they
are alone at home. Using these questions, we have calculated the number of
contact hours per day, which has a range of 0 to 9 hr. The parenting style was
measured with 8 items about who makes the decision on eight topics. The
topics are for instance: how late the child can stay out, whether the child can
drink alcohol at home, and when the child does his/her homework. The answer
categories are: the parents, the parents after consideration with their child, the
parents and the child together, the child after consideration with his parents, or
the child by himself. The answer ‘‘the child after consideration with his
parents’’ is indicative for the authoritative parenting style. We have counted
the number of answers in this category, which may range from 0 to 8.
The educational support consists of talking with the parents (7 items) and
supervision of homework (2 items). The first seven items concern scholastic
affairs. The Cronbach’s alpha of this scale is 0.77.
52
VEENSTRA & HANS KUYPER
RENE
The self-concept is measured with 11 items (for instance about the
satisfaction with themselves). Cronbach’s alpha is 0.75. The lifestyle of the
students was measured with 12 items about the time spent on activities during
the weekend. The activities are for instance: visiting family, working on a job,
doing homework, and watching television. Students could choose the
following answers: (0) no time; (1) 0,5 hr; (2) 1 hr; (3) 1,5 hr; (4) 2–3 hr;
(5) 3–5 hr; (6) 5–8 hr; (7) 8 or more hr. We calculated how much time was
spent on each activity relative to all other activities. In this article, we only use
the relative time spent on a job, on going out, on being outside with friends,
and on reading and working on hobbies.
The final group of predictor variables consists of the scholastic student
variables. In year 1, nonverbal intelligence was assessed with two subtests
from the PSB (Horn, 1969). PSB-3 measures reasoning, PSB-8 abstracting.
Both subtests consist of 40 items, which had to be answered in 8 min. As total
test scores were provided, we could not analyze the reliability in this sample.
Initial achievement was assessed with three tests for Dutch language,
arithmetic, and information processing, with reliability coefficients of 0.76,
0.84, and 0.78, respectively. The achievement motivation was measured with
21 items. The reliability is 0.85. The work attitude was measured with a single
item about postponing homework. For effort we use the number of days on
which homework is done.
School well-being was measured with 18 items, resulting in two scales:
opinion on teachers and rules (14 items, a ¼ 0.83) and opinion on other
students (4 items, a ¼ 0.51). Since the score on this last scale correlates rather
strongly with the scholastic achievement, we also use it in the analysis.
In addition to these predictor variables, one other variable is used as a
predictor, namely a dummy variable that indicates whether the parent
questionnaire has been answered by the parents. The Appendix summarizes the
dependent and predictor variables used in the multilevel analyses. With the
exception of the dummy variables, all variables have been standardized (a
mean of 0 and a standard deviation of 1). This facilitates the interpretation of
the multilevel analysis results.
Multivariate Dependent Variables Multilevel Analysis
Data were analyzed with a multilevel or hierarchical linear model. Multilevel
analysis has various advantages over analyses at one level, such as a regression
analysis with aggregated or disaggregated data (Bryk & Raudenbush, 1992;
Goldstein, 1995; Snijders & Bosker, 1999). By taking into account the
EFFECTIVE STUDENTS AND FAMILIES
53
hierarchy of data (students within classes within schools), the results are more
accurate and may be interpreted easier than the results from an analysis at one
level (e.g., only the lowest level).
A multivariate model is a model with two or more dependent variables per
research unit. We have used two criterion variables, namely the test scores
Dutch and mathematics. These dependent variables form level zero of the
multilevel model, the pseudolevel. A multivariate approach has some
advantages over separate analyses for each dependent variable (Duncan,
Jones, & Moon, 1996; Snijders & Bosker, 1999). An important benefit
of the multivariate model is that it is possible to investigate whether predictor
variables have a similar or a different effect on the dependent variables
by doing a significance test. Secondly, it is possible to calculate the correlation
between the dependent variables at the different levels. Do the same
students make progress in Dutch and in mathematics? And what does this
relation look like at the class or the school level? These correlations
cannot be computed when the analyses are separate for Dutch and
mathematics. Third, it is not necessary that for each respondent an
observation of each of the dependent variables is available. Research units
can be included when they have scored on at least one of the dependent
variables. The influence of a unit is mainly on the analysis of the dependent
variables with an available observation. However, including the covariance
between the different dependent variables, the analysis of the dependent
variables with a missing value becomes more accurate in the multivariate
approach.
In a multivariate multilevel analysis with two dependent variables within
students within classes within schools, Yhijk is the dependent variable. It is an
indicator on dependent variable h, for student i in class j and school k. If a
variable has the index h00k, it varies only at the school level. In the equation
Vh00k, Uh0jk and Rhijk are random variables with a mean of zero and, as
assumed, a normal distribution, and respectively as residual component s2v , s2u ,
and s2r . Multilevel analysis is characterized by the inclusion of the random
effects (Vh00k, Uh0jk and Rhijk) in the analysis structure:
Yhijk ¼ bh000 þ Vh00k þ Uh0jk þ Rhijk
ð1Þ
The empty model is useful for the calculation of the residual variances
between schools, classes, and students. The intraclass correlation coefficient
is the measure for the degree of resemblance between micro-units belonging
54
VEENSTRA & HANS KUYPER
RENE
to the same macro-unit. The intraclass correlation coefficient for the class and
school levels in relation to the individual level is the variance between schools
and classes divided by the total variance: (s2v þ s2u )/(s2v þ s2u þ s2r ).
Furthermore, it is also possible to calculate the intraclass correlation
coefficient for the school level in relation to the class level: s2v =ðs2v þ s2u Þ.
The second step is to add fixed effects of independent variables at the
individual level to the empty model. With one independent variable X the
model can be written as:
Yhijk ¼ bh000 þ bh100 x1hijk þ Vh00k þ Uh0jk þ Rhijk
ð2Þ
Equation (2) consists in an intercept, a regression coefficient and three residual
variance components. The regression coefficient bh100 can be interpreted in
the regular way: An increase of a unit in X results in an increase of bh100 units
in Y. The intercept and the regression coefficient form the systematic part of
the model. The three variance components form the random part. The random
part is at the individual, the class, and the school levels, but not at the
pseudolevel. For this model, we can calculate again the relative size of the
variance components. This measure is called the residual intraclass
correlation coefficient.
In the multivariate model we do not only have variance components, but
also the covariance between the dependent variables. With these three
estimates we can calculate the correlation between the criterion variables at
each level. At the school level it is:
rðU100 k ; U200 k Þ ¼
covðU100 k ; U200 k Þ
sdðU100 k ÞsdðU200 k Þ
ð3Þ
Significance Tests
To check whether the fixed effects differ significantly from zero, we have
calculated the quotient of the parameter value and the standard error (a t-value).
To compare two models, it is necessary to calculate the deviance of both
models. The deviance of a model is equal to minus twice the natural logarithm
of likelihood. The parameters are estimated by the maximum likelihood
method. This deviance can be regarded as a measure of lack of fit between
model and data. To test whether a model benefits from the addition of one or
more variables, one has to look at the difference in deviance for several models
fitted to the same dataset. This difference has a chi-squared distribution.
EFFECTIVE STUDENTS AND FAMILIES
55
Explained Variance
The variance in Y can be split into an explained and an unexplained part. We
have calculated the explained variance in three-level models by the formulas
of Snijders and Bosker (1999). In the multivariate approach this is:
P
varðYhijk g dg Xghijk Þ
2
ð4Þ
Rh1 ¼ 1 varðYhijk Þ
R2h2
R2h3
¼1
¼1
varðY h:jk P
g
dg X gh:jk Þ
varðY h:jk Þ
varðY h::k P
g
dg X gh::k Þ
varðY h::k Þ
ð5Þ
ð6Þ
Adding one or more independent variables, the explained variance at level 1 is
the proportional reduction in the sum of s2v , s2u , and s2r . At level 2 it is the
proportional reduction in the sum of s2v , s2u , and s2r /n. The variance at the
individual level has to be divided by the number of the research units within
level 2 (it is a weighted sum). This differs from class to class. With such
unbalanced data it is wise to add a representative value for the number of
students (Snijders & Bosker, 1999). We have chosen the representative value
n ¼ 20. The explained variance at level 3 is the proportional reduction in the
sum of s2v , s2u /j, and s2r /nj, and j is the number of classes and nj the number of
students per school. We have considered the representative value to be j ¼ 3.
RESULTS
By the standardizing of the dependent and the continuous predictor variables
the interpretation of the results is clearer. In this way, we can estimate
simultaneously the independent effects of different variables on the test score.
When the other effects are kept constant, if a student differs one standard
deviation from the mean, the effect of a variable will be the amount of change
in the dependent variable. The partial regression coefficient of dichotomous
variables is the difference between the two categories, for example between
boys and girls. The multilevel analysis was performed in a number of steps.
After estimating the empty model, in each next step a group of predictors
(corresponding with the circles) has been added. The results of these analyses
56
VEENSTRA & HANS KUYPER
RENE
are summarized in Tables 1a, 1b, and 2. Tabel 1a shows the regression
coefficients for the analyses on text comprehension, Tabel 1b the coefficients
for mathematics. Tabel 2 provides information about the variance components
and the values of the deviance.
First, we consider the effects of the structural characteristics on the test
scores. There are six predictors which have a significant (p < 0.01, one-sided)
effect on both tests: ethnicity, educational level mother and father, eldest child,
gender, and no parent questionnaire. Taking the other structural characteristics
into account, ethnic minority students achieved one fifth standard deviation
below ethnic majority students on both tests. Girls achieved better in text
comprehension, whereas boys were better in mathematics. The educational
level of the mother and the father has a positive effect. Eldest children within
families scored better than the younger children, as well as only children.
Furthermore, the number of parents has a positive effect on mathematics.
Finally, if there was no parent questionnaire the scores on both tests were lower.
The next column in Tables 1a and 1b shows the results after adding the
authoritative parenting style and the number of contact hours. Both variables
have a significant influence on both tests. Moreover, it can be seen that the
presence of these predictors does not change much the results for the structural
characteristics. Most regression coefficients have become somewhat smaller.
Subsequently, the characteristics of circle 3 (talking with parents and
supervision of homework) were added. The first variable is positively related
with both tests, the second one negatively. Again, the result of adding these
predictors on the earlier regression coefficients is small. Only on text
comprehension the regression coefficients of ethnicity and gender show a
somewhat larger decrease.
Of the general student characteristics hanging out with friends, reading and
hobbies, and the self-concept have an effect on both tests. The effects of time
spent on reading and hobbies, and of a positive self-concept are positive,
whereas the effect of hanging out with friends is negative. In addition, the time
spent on a job has a negative effect on text comprehension, and the time spent
on going out a negative effect on mathematics. The addition of these predictors
has some influence on the regression coefficients in earlier circles. In both tests,
number of contact hours is no longer significant. The coefficient of ethnicity
increases (becomes more negative) somewhat on both tests, the coefficient of
gender increases (becomes more negative) on text comprehension and
decreases (becomes less negative) on mathematics. Such changes are not
unusual when predictors are added in a series of multiple regression analyses.
Table 1A. Multilevel Analysis – Dutch. Circle 5 to 1. (bold: p < 0.01, one-sided)
4 Authoritative parenting style
Number of contact hours
3 Talking with parents
Supervision of homework
0.205
0.004
0.045
0.056
0.025
0.020
0.055
0.069
0.197
0.067
(0.042)
(0.011)
(0.012)
(0.011)
(0.028)
(0.020)
(0.064)
(0.022)
(0.019)
(0.030)
0.195 (0.042)
0.001 (0.011)
0.040 (0.012)
0.052 (0.011)
0.022 (0.028)
0.023 (0.019)
0.066 (0.064)
0.064 (0.021)
0.193 (0.019)
0.059 (0.029)
0.164 (0.042)
0.002 (0.011)
0.042 (0.012)
0.053 (0.011)
0.019 (0.028)
0.022 (0.019)
0.064 (0.063)
0.066 (0.021)
0.152 (0.019)
0.057 (0.029)
0.081 (0.009)
0.042 (0.009)
0.080 (0.009)
0.037 (0.009)
0.185
0.006
0.037
0.046
0.007
0.026
0.095
0.047
0.190
0.048
(0.041)
(0.011)
(0.012)
(0.010)
(0.027)
(0.019)
(0.062)
(0.021)
(0.019)
(0.029)
0.096 (0.039)
0.011 (0.010)
0.034 (0.011)
0.029 (0.010)
0.012 (0.025)
0.021 (0.018)
0.062 (0.064)
0.010 (0.020)
0.191 (0.020)
0.002 (0.027)
0.072 (0.009)
0.010 (0.009)
0.040 (0.009)
0.003 (0.009)
0.019 (0.009)
0.002 (0.009)
0.004 (0.009)
0.099 (0.009) 0.073 (0.009) 0.055 (0.009)
0.055
0.081
0.029
0.004
0.090
2 Hanging out with friends
Reading and hobbies
Job
Going out
Self-concept
(0.010) 0.036 (0.010)
(0.010)
0.051 (0.010)
(0.009) 0.024 (0.009)
(0.010)
0.010 (0.009)
(0.009)
0.053 (0.010)
1 Opinion on fellow students
Opinion on teachers and rules
Achievement motivation
Postponing homework
Number of days at homework
Nonverbal intelligence
Language achievement year 1
Information processing achievement year 1
Arithmetic achievement year 1
0.043 (0.056) 0.034 (0.055) 0.050 (0.054)
0.003 (0.052)
0.101 (0.037)
57
Constant
0.039 (0.009)
0.039 (0.009)
0.008 (0.010)
0.015 (0.010)
0.039 (0.010)
0.027 (0.010)
0.178 (0.013)
0.238 (0.013)
0.086 (0.013)
EFFECTIVE STUDENTS AND FAMILIES
5 Ethnicity (1 ¼ ethnic minority)
Occupational level breadwinner
Educational level father
Educational level mother
Number of parents (1 ¼ two)
Number of children (1/x)
Only child (1 ¼ only child)
Eldest child (1 ¼ eldest child)
Gender (1 ¼ male)
No parent questionnaire
58
Table 1B. Multilevel Analysis – Mathematics. Circle 5 to 1. (bold: p < 0.01, one-sided)
4 Authoritative parenting style
Number of contact hours
3 Talking with parents
Supervision of homework
2 Hanging out with friends
Reading and hobbies
Job
Going out
Self-concept
1 Opinion on fellow students
Opinion on teachers and rules
Achievement motivation
Postponing homework
Number of days at homework
Nonverbal intelligence
Language achievement year 1
Information processing achievement year 1
Arithmetic achievement year 1
Constant
0.191 (0.040)
0.005 (0.011)
0.026 (0.011)
0.047 (0.010)
0.091 (0.026)
0.017 (0.018)
0.016 (0.059)
0.054 (0.020)
0.232 (0.018)
0.120 (0.028)
0.182 (0.039)
0.002 (0.011)
0.022 (0.011)
0.042 (0.010)
0.091 (0.025)
0.017 (0.018)
0.018 (0.059)
0.051 (0.019)
0.233 (0.018)
0.113 (0.027)
0.082 (0.009)
0.017 (0.008)
0.162 (0.039)
0.002 (0.010)
0.024 (0.011)
0.043 (0.010)
0.091 (0.025)
0.015 (0.018)
0.018 (0.059)
0.057 (0.020)
0.248 (0.018)
0.115 (0.027)
0.186 (0.039)
0.006 (0.010)
0.020 (0.011)
0.037 (0.010)
0.075 (0.025)
0.013 (0.018)
0.037 (0.058)
0.043 (0.019)
0.209 (0.019)
0.106 (0.027)
0.071
0.002
0.022
0.014
0.043
0.017
0.014
0.011
0.130
0.047
(0.034)
(0.009)
(0.010)
(0.008)
(0.022)
(0.015)
(0.050)
(0.017)
(0.017)
(0.023)
0.083 (0.009)
0.076 (0.009)
0.030
0.018 (0.008) 0.009 (0.009) 0.005
0.022 (0.008) 0.037 (0.009) 0.022
0.065 (0.008) 0.042 (0.009) 0.026
(0.008)
(0.008)
(0.008)
(0.007)
0.058 (0.009) 0.037 (0.008)
0.036 (0.009)
0.010 (0.008)
0.017 (0.009) 0.013 (0.008)
0.038 (0.009) 0.024 (0.008)
0.078 (0.009)
0.041 (0.008)
0.005
0.029
0.008
0.013
0.047
0.106
0.080
0.148
0.355
(0.008)
(0.008)
(0.009)
(0.008)
(0.008)
(0.009)
(0.011)
(0.011)
(0.011)
0.345 (0.064) 0.340 (0.063) 0.344 (0.063) 0.292 (0.061) 0.136 (0.037)
VEENSTRA & HANS KUYPER
RENE
5 Ethnicity (1 ¼ ethnic minority)
Occupational level breadwinner
Educational level father
Educational level mother
Number of parents (1 ¼ two)
Number of children (1/x)
Only child (1 ¼ only child)
Eldest child (1 ¼ eldest child)
Gender (1 ¼ male)
No parent questionnaire
59
EFFECTIVE STUDENTS AND FAMILIES
Table 2. Multilevel Analysis. Variance and Covariance Components and Model Fit.
Par. (S.E.)
Deviance
Decrease in
Deviance
Variance
Dutch
Variance
Mathematics
Covariance
Empty Model
Individual level
Class level
School level
0.522 (0.009)
0.229 (0.021)
0.312 (0.048)
0.396 (0.008)
0.299 (0.026)
0.433 (0.065)
0.138 (0.007)
0.236 (0.021)
0.342 (0.053)
26,925.4
Circle 5
Individual level
Class level
School level
0.507 (0.009)
0.206 (0.019)
0.258 (0.040)
0.377 (0.007)
0.276 (0.024)
0.394 (0.059)
0.140 (0.006)
0.213 (0.019)
0.294 (0.046)
26,329.2
596.2
(df ¼ 20)
p < 0:001
Circle 4
Individual level
Class level
School level
0.500 (0.009)
0.195 (0.018)
0.239 (0.037)
0.371 (0.007)
0.265 (0.023)
0.374 (0.056)
0.134 (0.006)
0.203 (0.018)
0.275 (0.044)
26,179.2
150.0
(df ¼ 4)
p < 0:001
Circle 3
Individual level
Class level
School level
0.493 (0.009)
0.188 (0.018)
0.230 (0.036)
0.367 (0.007)
0.262 (0.023)
0.369 (0.056)
0.129 (0.006)
0.197 (0.018)
0.268 (0.043)
26,025.9
153.3
(df ¼ 4)
p < 0:001
Circle 2
Individual level
Class level
School level
0.475 (0.009)
0.173 (0.017)
0.212 (0.034)
0.355 (0.007)
0.247 (0.022)
0.344 (0.052)
0.116 (0.006)
0.183 (0.017)
0.246 (0.039)
25,668.5
357.4
(df ¼ 10)
p < 0:001
Circle 1
Individual level
Class level
School level
0.421 (0.008)
0.052 (0.007)
0.062 (0.011)
0.271 (0.005)
0.050 (0.006)
0.094 (0.015)
0.065 (0.005)
0.029 (0.005)
0.050 (0.010)
22,992.1
2,676.4
(df ¼ 16)
p < 0:001
Finally, the nine scholastic student characteristics were added. Six of these
have a significant influence on both tests: the three achievement tests and
nonverbal intelligence in year 1, the opinion on teachers and rules, and the
number of homework days. The opinion on fellow students has an effect on text
comprehension only. The influence of achievement in year 1 on achievement
in year 3 is large. Although the effect of all three achievement tests is
significant in both cases, the relative influence (the regression coefficients)
differs markedly. On text comprehension, information processing has the
strongest effect (b ¼ 0.24), followed by Dutch language (b ¼ 0.18). This may
60
VEENSTRA & HANS KUYPER
RENE
seem odd. The explanation is that some of the information processing items
dealt with text comprehension. On mathematics, arithmetic has the strongest
effect (b ¼ 0.36), followed by information processing (b ¼ 0.15). The effect of
arithmetic on text comprehension is almost the same as the effect of Dutch
language on mathematics (0.09 and 0.08, respectively.) The effect of
nonverbal intelligence is stronger on mathematics (0.11) than on text
comprehension (0.03). The number of days that homework is made, is also
positively related with both tests (0.04 on text comprehension and 0.05 on
mathematics).
Variance Components and Model Fit
In Table 2, we compare the variance components and the model fit of the
different models. First, we present the empty model (Equation (1)). In this
model the variance components are for text comprehension 0.522, 0.229, and
0.312, at the individual, class, and school levels respectively. The intraclass
correlation coefficient for differences between classes and schools is
(0.229 þ 0.312)/(0.522 þ 0.229 þ 0.312) ¼ 0.51. For mathematics, the intraclass correlation coefficient is 0.65.
Table 2 shows also the covariance components between text comprehension and mathematics. Using the estimations of the variances and covariance,
we can calculate the correlation between both tests at each level. In the empty
model the correlation is 0.93 at the school, 0.90 at the class, and 0.30 at the
individual
p level. [The calculation of the correlation at the school level is:
0.342/ (0.312 0.433) ¼ 0.93.] When a class or a school achieves higher in
one subject, the achievements are also higher in another subject. However, the
relation between the achievements of students (within classes within schools)
is only moderate.
In the next model, we have added the structural characteristics. These
characteristics explain some of the variance at the individual, class, and school
levels: 9, 14, and 16% for text comprehension and 7, 8, and 9% for
mathematics. The calculation of the explained variance for text comprehension is at the individual level: 1 (0.507 þ 0.206 þ 0.259)/(0.522 þ 0.229 þ
0.312) ¼ 0.087. At the class level the formula is (the representative number of students is 20): 1 (0.507/20 þ 0.206 þ 0.259)/(0.522/20 þ 0.229 þ
0.312) ¼ 0.137, and at the school level the equation is (the representative
number of classes is 3 and students is 20): 1 (0.507/60 þ 0.206/3 þ 0.259)/
(0.522/60 þ 0.229/3 þ 0.312) ¼ 0.156. Taking more characteristics into
account, the explained variance increases for text comprehension at the
EFFECTIVE STUDENTS AND FAMILIES
61
individual level with 3% by the fourth circle, 2% by the third circle, 5% by the
second circle, and 31% by the first circle. At the individual level, these
percentages are for mathematics 3 for the fourth, 1 for the third, 5 for the
second, and 47% for the first circle. At the individual level, the total explained
variance is for text comprehension 50% and for mathematics 63%. At the class
and the school level the percentages are 76–79.
At the individual level, the structural characteristics, circle 5, explain 9 and
7% of the variance in the test scores. The cultural characteristics, the other
circles, explain 41 and 56% of the variance (which can be divided into two
parts, namely 26 and 36% explained by the past performance, and 16 and 20%
explained by the other 14 cultural characteristics).
At both the class and the school level, the structural characteristics explain
about 15 and 8% of the variance in the test scores, and the cultural
characteristics 62 and 71%. The explained variance at the class and the school
levels is almost identical.
In the full model in Table 2, the variance components for text
comprehension are at the individual level 0.421, at the class level 0.052, and
at the school level 0.062. The residual intraclass correlation coefficient
between classes and schools is 0.21. For mathematics, the variance between
classes and schools is 35%. It is common that the variance between classes and
schools is higher for mathematics than for Dutch language (Scheerens &
Bosker, 1997). Variances between classes and schools of 21 and 35% are high.3
In the full model, the correlation between text comprehension and mathematics
is 0.65 at the school, 0.58 at the class, and 0.19 at the individual level.
Including an extra circle, the deviance decreases (see Table 2). The
decrease in deviance is significant all the time. The inclusion of an extra circle
results in a better explanation of both test scores.
Similar or Different Effects
For all predictors we have tested whether the effects on text comprehension
and mathematics are similar or different. First, we have calculated a contrast
by subtracting the parameter for mathematics from the parameter for text
comprehension. The value is positive, when the parameter for text
comprehension is larger than the parameter for mathematics, and vice versa.
The significance of a contrast can be tested with a chi-square test with one
3
Adding the school track (Veenstra, 1999), the variances become 12 and 17%, which is a regular
percentage (Scheerens & Bosker, 1997).
62
VEENSTRA & HANS KUYPER
RENE
degree of freedom. The following effects differ significantly: number of
parents, gender (circle 5), talking with parents, supervision of homework
(circle 3), reading and working on hobbies, going out (circle 2), opinion
on fellow students, nonverbal intelligence, and the three achievement tests
from year 1 (circle 1). The other variables have a similar effect on both
tests. In a parsimonious model, these effects can be represented by one
parameter.
It is theoretically plausible that a great number of these effects are different
for each subject. This is the case for the gender effect, for example, because
boys achieve better on mathematics and girls achieve better on text
comprehension, in accordance with the expectations. It was also expected
that the effect of reading and hobbies would differ per subject. As it turns out,
there is an effect of this characteristic on text comprehension, but not on
mathematics. The subject-specific effects for nonverbal intelligence and
previous achievements are also plausible. The extent of these effects differs
per subject, because language and information processing have a stronger
connection with text comprehension, and nonverbal intelligence and
arithmetic have a stronger connection with mathematics. For the other
characteristics it is unclear why there are differences per subject.
DISCUSSION AND CONCLUSION
The achievement of students in text comprehension and mathematics are
determined by both structural and cultural characteristics. Even if the prior
achievement of students is taken into account, it is important to know the
education of the parents and whether they belong to ethnic minorities or to the
native-born majority. When the effect of these characteristics is studied in
conjunction, there is a strong effect. A native-born student whose parents have
received a higher professional education, will score one quarter of a standard
deviation higher than a student of an ethnic minority whose parents have
received only a basic education (the difference in achievements between
students in different school types, for example a student in lower and a student
in intermediate general secondary education, is around one half of a standard
deviation). The difference between students of ethnic minorities and nativeborn students does not disappear if the characteristics of the socioeconomic
status are taken into account. Ethnicity has therefore an extra effect on
achievements, not only in Dutch, but also in mathematics.
EFFECTIVE STUDENTS AND FAMILIES
63
If the other characteristics are kept constant, gender also has a strong effect
on the achievements of students. Girls have a better average score on Dutch
and boys have a better average score on mathematics.
In addition to the effects of structural characteristics, there are also effects
of cultural characteristics. Homework monitoring and an authoritative
parenting style are forms of interaction between parents and children that
have a rather strong connection to the students’ achievements.
One of the general characteristics of students with a positive effect is
the students’ self-concept. This effect is as strong as the combined effect of the
education of both parents. The lifestyle also has a strong effect on the
achievement of students. Students who spend half their spare time going out,
working or hanging out with friends, and who do not spend any time on
reading or hobbies, have scores a quarter of a standard deviation lower on
Dutch, and one fifth of a standard deviation lower on mathematics than
students who spend 20% of their time on reading or on hobbies and who do not
spend time on the three other aspects.
Naturally, the strongest effects on the achievements stem from the effects of
past performance. For instance, when a student achieves one standard
deviation above average for all year-1 tests (reading, information processing,
and mathematics), this student’s achievements are at HAVO-level 2 years
later. At two standard deviations above average, the student’s grades are at
VWO-level in the 3rd year. A difference of one standard deviation is roughly
equivalent to a difference in school type. Thus it is clear that the students’
prior achievements are a good predictor of their later achievements. With
regard to the other characteristics in circle 1, the number of days that a student
does homework is of considerable influence. When a student does homework
for only 2 days instead of 5, the achievement in tests drops by one tenth of a
standard deviation.
It is unusual in educational research to combine several achievement
variables simultaneously in a multivariate multilevel model. In the current
study, the analyses for Dutch and mathematics were conducted concurrently.
This has the advantage that it facilitated a test of whether explanatory
variables have the same effect on these two dependent variables. Moreover,
the correlations between the dependent variables at various levels may be
determined. Students who lack a certain value for one of the dependent
variables may be included in the study, so incomplete data can be used more
efficiently. A multivariate multilevel model has important advantages over the
models which were used a few decades ago. The development of these models
64
VEENSTRA & HANS KUYPER
RENE
enables better and more extensive research on differences in study
achievements between students.
The development of multilevel analysis makes it possible to study the
influence of students, families, teachers, and schools in conjunction. The
current study shows the importance of verifying the characteristics at the
individual level. In studies of effective teachers and schools, the verification is
often reduced. Researchers of educational effectiveness take structural
characteristics and past performance of students into account, but they have
disregarded cultural characteristics. However, in order to explain differences
in achievements between students, these cultural characteristics are at least as
important as structural characteristics. In order to make statements about
effects at the class and school levels, the researcher should take both structural
and cultural characteristics into account.
In this study, we have used a structure of concentric circles. The structure
enables an organization of various influences and an indication of (causal)
relations between characteristics. Effects, such as the mother’s education or
the ethnicity, can be explained for an important part by characteristics with a
more direct relation to achievements. About three fifths of both effects can be
explained by cultural characteristics. Therefore, the structure of concentric
circles seems particularly suited to explaining the differences in achievements
at the individual level.
The analyses showed that the variance between classes and schools is high
in The Netherlands. The explanation is that students are ordered according to
school type. In Education at a glance (OECD, 1998), it is stated that The
Netherlands is an international frontrunner in interschool variance in
secondary education. Other countries with high scores in this respect are
Ireland, Germany, Switzerland, Austria, and the Flemish part of Belgium.
In contrast, in Korea and Japan the gross variance between classes and schools
is less than 5%. Incidentally, this measure does not say anything about
the inequality in achievements within a country. As it turns out, there is no
clear relationship between the interschool variance (a relative measure) and
the overall variance in achievements (an absolute measure). In order to
compare schools or countries with each other, the net variance should be
computed.
When we look into the differences in achievement in The Netherlands, the
large differences between students are striking. In year 3 of secondary
education, students of ethnic minorities perform less well than native-born
students in Dutch and mathematics. In addition to ethnicity, there are also
EFFECTIVE STUDENTS AND FAMILIES
65
clear differences according to socioeconomic status. Adolescents from lower
social classes have lower scores on the tests than students from higher classes.
An inequality between the sexes is also apparent. Boys perform better in
mathematics than girls. Girls perform better in Dutch than boys. To conclude,
it may be stated that there are clear differences in these structural
characteristics at the end of the school age.
Finally, the present study attributes all of the explained variance to variation
among students and families. In future research, it would be worthwhile to
investigate the extent of differential effectiveness in text comprehension and
mathematics, and to add measures of teacher and school quality (Teddlie &
Reynolds, 2000). Furthermore, the concentric circles are nice in classifying
variables. However, this classification should give rise to the development of a
theory that explains how student and family characteristics are related to each
other and to educational achievement and progress.
REFERENCES
Bandura, A. (1988). Self-regulation of motivation and action through goal systems. In V.
Hamilton, G.H. Bower, & N.H. Frijda (Eds.), Cognitive perspectives on emotion and
motivation (pp. 37–61). Dordrecht, The Netherlands: Kluwer.
Bosman, R. (1993). Opvoeden in je eentje: Een onderzoek naar de betekenis van het
moedergezin voor de onderwijskansen van kinderen [Single mothering. An empirical
inquiry into the effects of the mother-only family on educational opportunities of
children]. Lisse, The Netherlands: Swets & Zeitlinger.
Bourdieu, P. (1977). Cultural reproduction and social reproduction. In J. Karabel & A.H. Halsey
(Eds.), Power and ideology in education (pp. 487–511). New York: Oxford University
Press.
Brandsma, H.P., Lugthart, E., & Van der Werf, G. (1997). Beschrijving van de school- en
docentkenmerken in het eerste jaar van het voortgezet onderwijs: Een analyse op de
eerste meting van VOCL’93 [Description of the school and teacher characteristics in the
first year of secondary education: An analysis of the first wave of VOCL’93]. Enschede/
Groningen, The Netherlands: OCTO/GION.
Brandsma, H.P., & Van der Werf, G. (1997). Beschrijving van het onderwijspeil in het eerste
jaar van het voortgezet onderwijs: Een analyse op de eerste meting van VOCL’93
[Description of the educational standard in the first year of secondary education: An
analysis of the first wave of VOCL’93]. Enschede/Groningen, The Netherlands: OCTO/
GION.
Bryk, A.S., & Raudenbush, S.W. (1992). Hierarchical Linear Models: Applications and data
analysis methods. Newbury Park, CA: Sage.
Coleman, J.S., & Hoffer, T. (1987). Public and private high schools: The impact of
communities. New York: Basic Books.
66
VEENSTRA & HANS KUYPER
RENE
De Graaf, P.M. (1987). De invloed van financi€ele en culturele hulpbronnen in onderwijsloopbanen [The influence of financial and cultural resources on educational careers].
Nijmegen, The Netherlands: ITS.
De Jong, M.J. (1989). Ethnic culture, family background and educational attainment. In B.F.M.
Bakker, J. Dronkers, & G.W. Meijnen (Eds.), Educational opportunities in the welfare
state: Longitudinal studies in educational and occupational attainment in The
Netherlands (pp. 59–72). Nijmegen, The Netherlands: ITS.
De Jong, R., Westerhof, K.J., & Creemers, B.P.M. (2000). Homework and student
math achievement in junior high schools. Educational Research and Evaluation, 6,
130–157.
Downey, D.B. (1994). The school performance of children from single-mother and singlefather families: Economic or interpersonal deprivation? Journal of Family Issues, 15,
129–147.
Downey, D.B. (1995). Bigger is not better: Family size, parental resources, and children’s
educational performance. American Sociological Review, 60, 746–761.
Driessen, G. (1995). Het relatieve belang van sociaal milieu en etnische herkomst voor de
verklaring van onderwijsachterstanden [The relative importance of social background
and ethnic origin as explanation of educational inequality]. Tijdschrift voor
Onderwijsresearch, 20, 341–362.
Dronkers, J. (1997a). Loopbanen door het voortgezet onderwijs in de jaren negentig [Careers in
secondary education in the nineties]. Beleid en Maatschappij, 22, 85–95.
Dronkers, J. (1997b). Zoals de ouden zongen, piepen de jongen. Intergenerationele overdracht
van de kans op scheiding in Nederland [The young pig grunts like the old sow.
Intergenerational transmission of divorce in The Netherlands]. Mens en Maatschappij,
72, 149–165.
Duncan, C., Jones, K., & Moon, G. (1996). Blood pressure, age and gender. In G. Woodhouse
(Ed.), Multilevel modelling application. A guide for users of MLn (pp. 59–84). London:
Institute of Education, University of London.
Falbo, T., & Polit, D.F. (1986). Quantitative review of the only child literature: Research
evidence & theory development. Psychological Bulletin, 100, 176–189.
Fraser, B.J., Walberg, H.J., Welch, W.W., & Hattie, J.A. (1987). Syntheses of educational productivity research. International Journal of Educational Research, 11,
145–252.
Goldstein, H. (1995). Multilevel models in educational and social research. London: Griffin.
Hermans, J.J. (1981). Niet-voortgezet onderwijs: Voortijdig schoolverlaten in het algemeen
voortgezet onderwijs – omvang, aard en voorspelbaarheid [No high school: Early dropout in the general secondary education – prevalence, characteristics, and predictability].
Lisse, The Netherlands: Swets & Zeitlinger.
Horn, W. (1969). Pr€ufsystem f€ur Schul- und Bildungsberatung PSB [Test for school advice
PSB].G€ottingen, Germany: Verlag f€ur Psychologie.
Keith, T.Z. (1982). Time spent on homework and high school grades: A large-sample path
analysis. Journal of Educational Psychology, 74, 248–253.
Kohn, M.L. (1977). Class and conformity. A study in values. With a reassessment. Chicago/
London: University of Chicago Press.
Kuyper, H., & Guldemond, H. (1997). Studievaardigheden en huiswerkgedrag in de bovenbouw
van havo en vwo [Study skills and homework behavior in the upper part of havo and
vwo]. Groningen, The Netherlands: GION.
EFFECTIVE STUDENTS AND FAMILIES
67
Kuyper, H., & Swint, F.E. (1996). Microscopisch schoolloopbaanonderzoek: De eerste drie
jaren in het voortgezet onderwijs [Microscopic school career research: The first three
years in secondary education]. Groningen, The Netherlands: GION.
Meijnen, G.W. (1977). Maatschappelijke achtergronden van intellektuele ontwikkeling
[Societal backgrounds of intellectual development]. Groningen, The Netherlands:
Wolters-Noordhoff.
Muller, C., & Kerbow, D. (1993). Parent involvement in the home, school, and community. In
B. Schneider & J.S. Coleman (Eds.), Parents, their children and schools (pp. 13–46).
Boulder: Westview Press.
Neisser, U., Boodoo, G., Bouchard T.J., Jr., Boykin, A.W., Brody, N., Ceci, S.J., Halpern, D.F.,
Loehlin, J.C., Perloff, R., Sternberg, R.J., & Urbina, S. (1996). Intelligence: Knowns and
unknowns. American Psychologist, 51, 77–101.
OECD. (1998). Education at a glance. OECD Indicators. Paris: Author.
Paterson, L. (1992). Social class in Scottish education. In S. Brown & S. Riddell (Eds.), Class,
race and gender in schools: A new agenda for policy and practice in Scottish education
(pp. 8–17). Edinburgh, Scotland: Scottish Council for Research in Education.
Rutter, M., Maughan, B., Mortimore, P., & Ouston, J. (1979). Fifteen thousand hours:
Secondary schools and their effects on children. Somerset, UK: Open Books.
Ryan, B.A., & Adams, G.R. (1995). The Family-School Relationships Model. In B.A. Ryan,
G.R. Adams, T.P. Gullotta, R.P. Weissberg, & R.L. Hampton (Eds.), The family-school
connection: Theory, research, and practice (pp. 3–28). Thousand Oaks, CA: Sage.
Sammons, P. (1995). Gender, ethnic and socio-economic differences in attainment and
progress: A longitudinal analysis of student achievement over 9 years. British
Educational Research Journal, 21, 465–485.
Scheerens, J., & Bosker, R.J. (1997). The foundations of educational effectiveness. Oxford:
Pergamon.
Shavelson, R.J., Hubner, J.J., & Stanton, G.C. (1976). Self-concept: Validation of construct
interpretations. Review of Educational Research, 46, 407–441.
Snijders, T.A.B., & Bosker, R.J. (1999). Multilevel analysis. An introduction to basic and
advanced multilevel modeling. Newbury Park, CA: Sage.
Steinberg, L. (1996). Beyond the classroom: Why school reform has failed and what parents
need to do. New York: Simon and Schuster.
Steinberg, L., Elmen, J.D., & Mounts, N.S. (1989). Authoritative parenting, psychosocial maturity, and academic success among adolescents. Child Development, 60,
1424–1436.
Steinberg, L., Lamborn, S.D., Dornbusch, S.M., & Darling, N. (1992). Impact of parenting
practices on adolescent achievement: Authoritative parenting, school involvement, and
encouragement to succeed. Child Development, 63, 1266–1281.
Teddlie, C., & Reynolds, D. (Eds.). (2000). The international handbook of school effectiveness
research. London/New York: Falmer Press.
Van der Velden, R.K.W. (1991). Sociale herkomst en schoolsucces: Het effect van
culturele en sociale hulpbronnen op leerlingen [Social background and school success.
The effect of cultural and social resources on students]. Groningen, The Netherlands:
RION.
Van der Werf, M.P.C., Lubbers, M.J., & Kuyper, H. (1999). Onderwijsresultaten van VOCL’89
en VOCL’93 leerlingen [Educational results of VOCL’89 and VOCL’93 students].
Groningen, The Netherlands: GION.
68
VEENSTRA & HANS KUYPER
RENE
Veenstra, R. (1999). Leerlingen – klassen – scholen. Prestaties en vorderingen van leerlingen in
het voortgezet onderwijs [Pupils – classes – schools. Achievements and progress of
pupils in secondary education]. Amsterdam: Thela Thesis.
Verhelst, N.D., Glas, C.A.W., & Verstralen, H.H.F.M. (1995). One-Parameter Logistic Model
(OPLM). Arnhem, The Netherlands: Cito.
Weiner, B. (1979). A theory of motivation for some classroom experiences. Journal of
Educational Psychology, 71, 3–25.
69
EFFECTIVE STUDENTS AND FAMILIES
APPENDIX
Student and Family Characteristics
Mean SD min. max.
Students’ achievements
Text comprehension (z-score)
Mathematics (z-score)
Scholastic student characteristics
Achievement grade 1
— language (19 items)
— information processing (20 items)
— arithmetic (20 items)
Nonverbal intelligence
— reasoning (40 items)
— abstracting (40 items)
Effort
— number of days at homework
— postponing homework
Achievement motivation (21 items)
School well-being
— opinion on fellow students (4 items)
— opinion on teachers and rules (14 items)
General student characteristics
Self-concept (11 items)
Lifestyle
— going out
— hanging out with friends
— reading and hobbies
— job
Scholastic family interaction
Educational support
— talking with parents (7 items)
— supervision of homework (2 items)
0.0 1.0 2.0
0.0 1.0 4.6
N
2.6 6,593
3.7 5,842
11.7 3.8
12.2 4.0
11.4 4.7
0
0
0
19
20
20
6,896
6,896
6,896
25.4 5.2
23.8 7.0
2
1
40
40
6,894
6,894
4.7 1.5 0
1.5 1.7 0
53.2 8.7 23
7
6
83
6,586
6,201
6,277
11.8 2.2 4
38.9 6.8 14
16
56
6,861
6,801
34.4 4.9 14
44
6,838
9.3
10.2
8.6
7.3
7.3
7.2
6.6
8.5
0
0
0
0
35
35
35
35
6,611
6,601
6,689
6,579
16.0 2.8
3.0 1.2
7
2
21
8
6,798
6,292
(continued)
70
VEENSTRA & HANS KUYPER
RENE
(continued)
Mean SD min. max.
General family interaction
Authoritative parenting style
Number of contact hours
Structural student and family characteristics
Gender (1 ¼ male)
Position in the row of children
— only child
— eldest child
— other children
Family composition
— number of parents (1 ¼ two parents)
— number of children
Socioeconomic status
— educational level mother
— educational level father
— occupational level breadwinner
Ethnicity (1 ¼ ethnic minority)
No parent questionnaire
19.2 17.0
4.3 2.1
N
0
0
100 6,878
9 6,283
.49
.50 0
1 6,896
.11
.33
.56
.32 0
.47 0
.50 0
1 6,048
1 6,048
1 6,048
.86 .35 0
2.8 1.4 1
1 6,823
10 6,041
2.4
.9
2.6 1.1
3.0 1.3
.06 .23
.12 .33
1
1
1
0
0
5
5
5
1
1
6,041
6,041
6,041
6,896
6,896
© Copyright 2026 Paperzz