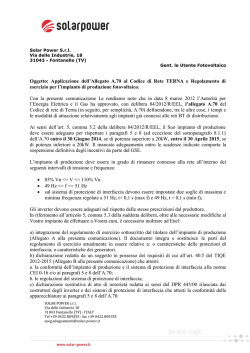
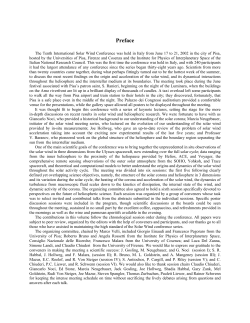
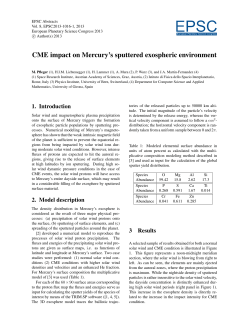
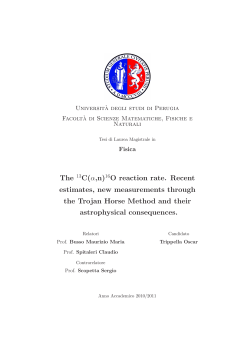
Astronomy
&
Astrophysics
A&A 540, A33 (2012)
DOI: 10.1051/0004-6361/201118188
c ESO 2012
Chemical evolution of the Milky Way: the origin of phosphorus
(Research Note)
G. Cescutti1 , F. Matteucci2,3 , E.Caffau4,5 , and P. François5,6
1
2
3
4
5
6
7
Leibniz-Institut für Astrophysik Potsdam (AIP), An der Sternwarte 16, 14482 Potsdam, Germany
Laboratoire d’Astrophysique, École Polytechnique Fédérale de Lausanne (EPFL), Observatoire de Sauverny, 1290 Versoix,
Switzerland
e-mail: [email protected]
Dipartimento di Fisica, Sezione di Astronomia, Università di Trieste, via G.B. Tiepolo 11, 34131 Trieste, Italy
INAF Osservatorio Astronomico di Trieste, via G.B. Tiepolo 11, 34131 Trieste, Italy
Zentrum für Astronomie der Universität Heidelberg, Landessternwarte, König stuhl 12, 69117 Heidelberg, Germany
GEPI, Observatoire de Paris, CNRS, Université Paris Diderot, Place Jules Janssen, 92190 Meudon, France
Université de Picardie Jules Verne, 33 rue Saint Leu, Amiens, France
Received 30 September 2011 / Accepted 19 January 2012
ABSTRACT
Context. Recently, the abundance of P was measured for the first time in disk stars. This provides the opportunity of comparing the
observed abundances with predictions from theoretical models.
Aims. We aim at predicting the chemical evolution of P in the Milky Way and compare our results with the observed P abundances in
disk stars to derive constraints on the P nucleosynthesis.
Methods. We adopted the two-infall model of galactic chemical evolution, which is a good model for the Milky Way, and computed
the evolution of the abundances of P and Fe. We adopted stellar yields for these elements from different sources. The element P is
expected to form mainly in type-II supernovae, whereas Fe is mainly produced by type-Ia supernovae.
Results. Our results confirm that to reproduce the observed trend of [P/Fe] vs. [Fe/H] in disk stars, P must be formed mainly in
massive stars. However, none of the available yields for P can reproduce the solar abundance of this element. In other words, to
reproduce the data one needs to assume that massive stars produce three times more P than predicted.
Conclusions. We conclude that the entire available yields of P from massive stars are largely underestimated and that nucleosynthesis
calculations should be revised. We also predict the [P/Fe] expected in halo stars.
Key words. Galaxy: abundances – Galaxy: evolution
1. Introduction
In Sect. 4 the results are compared to the data and we draw our
conclusions in Sect. 5.
Recently, Caffau et al. (2011) have measured the P abundance
in a sample of 20 cool stars in the Galactic disk. They found
that the [P/Fe] ratio behaves like the [S/Fe] ratio, namely that it
increases toward lower metallicity stars. This was the first time
that P was observed in Galactic stars even though P is among the
top 20 most abundant elements in the Universe. There is only one
single stable isotope of P, 31 P, which is thought to be formed by
neutron capture on 29 Si and 30 Si in massive stars. By means of a
detailed model for the chemical evolution of the Milky Way one
can compute the P evolution and compare it to the observations.
This can allow us to understand the origin of this element and
impose constraints on its formation inside stars. In this paper,
we adopt a good model for the chemical evolution on the Galaxy
that was already tested on many chemical species (François et al.
2004). In particular, the model includes stellar nucleosynthesis
and supernova progenitors (SNe Ia, II, Ib/c) as well as the stellar
lifetimes. The stellar yields of P have been computed by several
authors such as Woosley & Weaver (1995) and Kobayashi et al.
(2006) as functions of the initial stellar metallicity. In this paper
we compare the predictions of our chemical evolution model for
P, obtained by including different stellar yields, with the recent
data. In Sect. 2 we briefly describe the chemical evolution model
that we adopted, in Sect. 3 we describe the observational data.
2. The chemical evolution model
The role played by SNe of different types in the chemical evolution of the Galaxy has been computed by several authors in the
past years (Matteucci & Greggio 1986; Matteucci & François
1989; Yoshii et al. 1996; Chiappini et al. 1997, 2001; Kobayashi
et al. 2006; Boissier & Prantzos 1999; François et al. 2004
among others). Here we refer to the model of Chiappini et al.
(1997), the so-called two-infall model for the evolution of the
Milky Way. A thorough description of this model can be found
in Chiappini et al. (1997, 2001) and François et al. (2004) and
we refer the reader to these papers for details. In this model
it is assumed that the stellar halo formed on a relatively short
timescale (1–2 Gyr) by means of a first infall episode, whereas
the disk formed much more slowly, mainly out of extragalactic
gas, through a second infall episode. The timescale for the disk
formation is assumed to increase with the galactocentric distance
(τ = 7 Gyr at the solar circle), thus producing an “inside-out”
scenario for the disk formation. The Galactic disk is divided into
several rings, 2 kpc wide, without exchange of matter between
them. The model can follow the evolution of several chemical
elements in detail, including H, D, He, C, N, O, α-elements,
Article published by EDP Sciences
A33, page 1 of 4
A&A 540, A33 (2012)
Fe and Fe-peak elements, s- and r-process elements. The star
formation rate (SFR) adopted for the Milky Way is a function of
both surface gas density and total surface mass density. This SFR
is proportional to a power k = 1.5 of the surface gas density and
to a power h = 0.5 of the total surface mass density. In the Milky
Way model we also assumed a surface density threshold below
which the SFR stops, according to Kennicutt (1989). As a consequence of this, the star formation rate goes to zero every time
that the gas density decreases below the threshold (∼7 M pc−2 ).
The efficiency of SF is ν = 1 Gyr−1 during the disk and 2 Gyr−1
in the halo phase. This model reproduces the majority of the features of the solar vicinity and the whole disk.
2.1. Nucleosynthesis and stellar evolution prescriptions
We adopted the yields for P and Fe originating in massive
stars from Woosley & Weaver (1995, hereafter WW95) and
Kobayashi et al. (2006, hereafter K06) as functions of stellar
metallicity. The yields for the same elements originating from
SNe Ia are from Iwamoto et al. (1999), their model W7. In
particular, each SN Ia is assumed to eject the same mass, the
Chandrasekhar mass (∼1.4 M ); of this mass ∼0.6 M is in the
form of Fe and ∼3.57 × 10⁻⁴ M is in the form of P. It is therefore clear that SNe Ia are negligible producers of P. On the other
hand, 31 P should be produced during O- and Ne- shell burnings
in massive stars, although a large part of 31 P can be destroyed by
(p, α) reactions to become 28 Si.
3. The observational data
The sample of observed stars is formed by 20 G-F bright dwarfs
(3.3 ≤ Jmag < 7), with stellar parameters in the ranges: 5765 ≤
T eff ≤ 6470 K, 3.90 ≤ log g < 4.5, −0.91 ≤ [Fe/H] ≤ 0.28.
The phosphorus abundance was derived from CRIRES
spectra observed at the VLT-Antu 8 m telescope in service mode
during ESO period 86. The setting was centered at 1059.6 nm in
order 54. Four P lines of Mult. 1 were visible in detectors 2 and 3.
The spectral resolution was R = 100 000, the signal-to-noise ratios achieved were in the range 50–400. For the Adaptive Optics
correction, computed on axis, the target star itself was used.
4. Results for phosphorous
We ran several models including different prescriptions for the
P and Fe yields from massive stars. In some of the models we
mixed yields from different sources, which is allowed because
yields of some specific elements, in particular those of P and Fe,
are still uncertain, because of the different input physics adopted
by different authors. As a consequence, we can derive constraints
on the nucleosynthesis calculations by means of our chemical
evolution models.
The models are:
– Model 1: with the P yields from massive stars of K06 and the
Fe yields from massive stars of WW95 considering only the
solar chemical composition. This choice was made because
these Fe yields reproduce the [X/Fe] vs. [Fe/H] relations better (see François et al. 2004);
– Model 2: with the P yields from massive stars of K06
and metallicity dependent Fe yields from massive stars of
WW95;
– Model 3: with the metallicity-dependent P yields from massive stars of WW95 and the Fe yields from massive stars of
WW95 considering only the solar chemical composition;
A33, page 2 of 4
Fig. 1. Predictions from Model 1 (blue solid line) and Model 3 (green
dashed line). The P and Fe abundances in both models are normalized
with the absolute solar values of Caffau et al. (2011). In Table 1 we list
the predicted ratios at the age of formation of the solar system. Data
from Caffau et al. (2011): the circles indicate stars with planets.
– Model 4: with metallicity-dependent P and Fe yields from
massive stars of WW95;
– Model 5: with P and Fe metallicity-dependent yields from
massive stars of K06;
– Model 6: where the yields of P and Fe from massive stars are
from K06 and include also hypernovae (hypernovae are stars
with M > 20 M and explosion energies higher than normal
SNe II);
– Model 7: the only difference compared to model 5 is that in
this model the P yields in massive stars are artificially increased by a factor of ∼3;
– Model 8: the only difference compared to model 6 is that in
this model the P yields in massive stars are artificially increased by a factor of ∼2.75.
To obtain the [P/Fe] ratios, we normalized our model results for
P and Fe with the observed absolute solar abundances obtained
by Caffau et al. (2011). In this way, one can see at the same time
whether the model predictions fit the trend and also the solar
abundances. The predicted solar abundances are the abundances
that the model predicts for the ISM 4.5 Gyr ago, the time of
formation of the solar system.
In Table 1 we show a summary of the nucleosynthesis prescriptions used for P and Fe in the models and the difference
between the predicted solar abundances and the observed ones
by Caffau et al. (2011). Note that the yields of P and Fe from
SNe Ia are from Iwamoto et al. (1999) in all models.
In Fig. 1 we show the results of Models 1 and 3. As one can
see, Model 1 agrees well with the observed trend in the Galactic
disk, although the curve is shifted to lower values than observed.
This is because while the solar Fe abundance predicted by this
model agrees well with the observed one, the P solar abundance
is too low. In particular, to reproduce the P solar abundance we
need to artificially increase the yields of P from massive stars
by a factor of ∼3. On the other hand, we note that the results of
Model 3 are not able to reproduce the trend of the [P/Fe] ratio
in the Galactic disk, although the predicted solar value is almost
acceptable (+0.06 dex, in Table 1).
In Fig. 2 we show Models 2 and 4: Model 2 agrees well with
the observed trend in the Galactic disk, whereas for Model 4
G. Cescutti et al.: The origin of phosphorus (RN)
Table 1. Nucleosynthesis prescriptions for the various models.
Model
1
2
3
4
5
6
7
8
P from massive stars
K06
K06
WW95 met. dep.
WW95 met. dep.
K06
K06+ Hypern.
3 × K06
2.75 × K06 + Hypern.
Fe from massive stars
WW95 solar chem. comp.
WW95 met.dep.
WW95 solar chem comp.
WW95 met.dep.
K06
K06+ Hypern
K06
K06+ Hypern.
[P/Fe] model
–0.41
–0.42
+0.06
+0.05
–0.40
–0.37
0.00
0.00
Fig. 2. Predictions from Model 2 (blue solid line) and Model 4 (green
dashed line). The P and Fe abundances in both models are normalized
with the absolute solar values of Caffau et al. (2011). In Table 1 we list
the predicted ratios at the age of formation of the solar system. The data
are the same as in Fig. 1.
Fig. 3. Predictions from Model 5 (blue solid line) and Model 6 (green
dashed line). The P and Fe abundances in both models are normalized
with the absolute solar values of Caffau et al. (2011). In Table 1 we list
the predicted ratios at the age of formation of the solar system. The data
are the same as in Fig. 1.
the trend is not reproduced, although, as for Model 3, the predicted solar value could be acceptable (+0.05, Table 1). To obtain a good agreement with the observed solar abundance of P
for Model 2, we again need to artificially increase the yields of
P by a factor of ∼3.
In Fig. 3 we show the predictions of Model 5 with
metallicity-dependent yields from K06 for both P and Fe. Even
for these yields we predict a solar ratio of [P/Fe] too low by
about −0.40 dex. In other words, although the trend of [P/Fe]
in the Galactic disk is well reproduced, the whole curve should
be shifted upward by 0.4 dex to gain a good agreement with the
data.
In Fig. 3 we also show the predictions of Model 6 with the
metallicity-dependent yields from K06 for both P and Fe, but
for stars more massive than 20 M we adopted the yields for
hypernovae, instead of those for normal SNe II. The agreement
with the observed solar ratio here is slightly better, [P/Fe] ∼
−0.37 dex, although the problem of the insufficiently predicted
solar P abundance remains.
The agreement of Models 1, 2, 5, and 6 with the trend of
the data and the disagreement with the observed solar abundances suggests that the major producers of P in the Universe
are probably core-collapse supernovae and that the theoretical
yields from these supernovae are underestimated by a factor
of ∼3. However, the results of Model 6 with yields from hypernovae differ substantially from those obtained with normal
yields from SNe II at low metallicities. Indeed, the model with
normal SNII yields predicts an overabundance of P relative to Fe
at low metallicity of ∼+0.5 dex, whereas the model with hypernova yields predicts a lower [P/Fe] ratio, namely an overabundance of ∼+0.2–0.3 dex. Clearly, these predictions await to be
proven by future data in low-metallicity halo stars.
On the other hand, the trend of abundances of [P/Fe] in
the Galactic disk as predicted by Models 3 and 4, adopting the
metallicity-dependent yields of P and Fe from massive stars by
WW95, disagrees with observations even if we normalize the
model results to their predicted solar abundances. The predictions of Model 4 are very similar to those of Timmes & al.
(1995): these authors adopted the same yields from massive stars
for P and Fe as in our Model 4, and showed the predicted [P/Fe]
vs. [Fe/H], but no data for P were available at that time.
We can also infer from our numerical simulations that the
theoretical predictions from different authors for Fe are similar,
whereas for P the yields by K06 and by WW95 are significantly
different. We therefore conclude that the yields of P by K06 are
more accurate than those of WW95, since the former can well reproduce the trend of [P/Fe] vs. [Fe/H] and the P solar abundance
by increasing them by a factor of ∼3.
For this reason and for the sake of using a more homogeneous set of yields, we only show the results obtained by including the K06 yields either with or without hypernovae in the next
figure. In particular, Model 7 is based on normal massive star
yields, whereas Model 8 is based on hypernovae yields. In these
models, shown in Fig. 4, we applied the necessary factor in the
A33, page 3 of 4
A&A 540, A33 (2012)
Fig. 4. Predictions for [P/Fe] from Model 7 (blue solid line) and
Model 8 (green dashed line). The P and Fe abundances in both models are normalized with the absolute solar values of Caffau et al. (2011).
Data as in Fig. 1.
production of P in massive stars to reproduce the observed solar abundance of P. Indeed Fig. 4 shows that the predicted curve
passes exactly by zero and this is because our model can reproduce the solar abundance of Fe and that of P at the same time.
It is worth noting that adopting the hypernova yields, which are
higher for P than those for normal core-collapse SNe, the yields
need to be increased by a factor of ∼2.75, instead of ∼3. With the
corrected yields and the observed solar abundance, the predicted
[P/Fe] for [Fe/H] < –1.0 dex is on average +0.2–0.3 dex.
5. Conclusions
We compared model predictions by adopting different sets of
yields with recent data on the abundance of P in the Galactic
disk. Our conclusions can be summarized as follows:
– The observed decrease of the abundance of [P/Fe] in
Galactic disk stars suggests that P is mainly produced by
A33, page 4 of 4
core-collapse SNe with a small contribution from SNe Ia.
Otherwise, if SNe Ia were important, the [P/Fe] ratio would
remain fairly constant.
– The metallicity-dependent yields of P from massive stars of
K06 together with the P yields from SNe Ia from Iwamoto
et al. (1999) adequately reproduce the data if the yields from
massive stars are increased by a factor of ∼3. This suggests
that the yields of P available in the literature are underestimated. Both the neutron-rich isotopes of 29,30 Si and 31 P,
which derive from neutron capture on the two Si isotopes,
are produced in the oxygen- and neon-burning shells in massive stars (WW95). Therefore, to obtain a higher P production, the O and Ne shell- burnings and the neutron capture
on the 29,30 Si isotopes and the destruction of 31 P by (p, α)
reactions should be revised.
– We also predict the behavior of [P/Fe] in halo stars and suggest that it will likely show a plateau between [Fe/H] =
−1.0 and –3.0 dex corresponding to [P/Fe] ∼ +0.5 dex if
yields (corrected) from normal SNe II are adopted, and to
∼+0.2 dex if hypernova yields (corrected) are adopted. To
distinguish between these two cases, we await observations
of the P abundance in halo stars.
Acknowledgements. GC thanks the Department of Mathematics and Computer
Science of the University of Udine for its hospitality.
References
Boissier, S., & Prantzos, N. 1999, MNRAS, 307, 857
Caffau, E., Bonifacio, P., Faraggiana, R., & Steffen, M. 2011a, A&A, 532, 98
Caffau, E., Ludwig, H.-G., Steffen, M., Freytag, B., & Bonifacio, P. 2011b, SoPh,
268, 255
Chiappini, C., Matteucci, F., & Gratton, R. 1997, ApJ, 477, 765
Chiappini, C., Matteucci, F., & Romano, D. 2001, ApJ, 554, 1044
François, P., Matteucci, F., Cayrel et al. 2004, A&A, 421, 613
Iwamoto, K., Brachwitz, F., Nomoto, K., et al. 1999, ApJS, 125, 439
Kennicutt, R. C. Jr, 1989, ApJ, 344, 685
Kobayashi, C., Umeda, H., Nomoto, K, Tominaga, N., & Ohkubo, T. 2006, ApJ,
653, 1145 (K06)
Matteucci, F., & François, P. 1989, MNRAS, 239, 885
Matteucci, F., & Greggio, L. 1986, A&A, 154, 279
Timmes, F. X., Woosley, S. E., & Weaver, T. A. 1995, ApJS, 98, 617
Yoshii, Y., Tsujimoto, T., & Nomoto, K. 1996, ApJ, 462, 266
Woosley, S. E., & Weaver, T. A. 1995, ApJS, 101, 181 (WW95)
© Copyright 2026 Paperzz