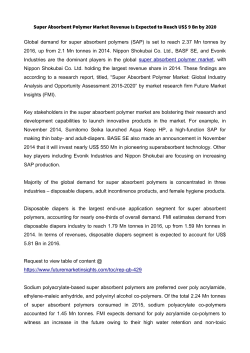
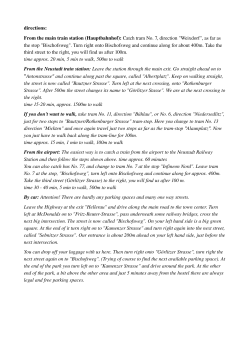
Received: 22 Ocotber 2013
IOTC–2013–WPTT15–43
Tuna Longline Fishery in the Indian Ocean by Thai Fleet
during 2010-2012
Narupon Darumas* Aekkarat Wongkeaw and Watcharapong Chumchuen
Deep Sea Fishery Technology Research and Development Institute,
Department of Fishery, Thailand
* Corresponding author: [email protected]
Summary
Thai tuna longline fishery were operated in the Indian Ocean during 2010 - 2012
composed of 2 tuna longliners. The main fishing ground was located in the western part of the
Indian Ocean. In 2010-2011 fishing ground was located cover the central and the western part of
the ocean whereas in 2012 the fishing ground was located mostly in the central part of the
Western Indian Ocean. The data of tuna fishery was collected from Thai longliner logbooks.
The fishing operations targeted on tropical tuna species, bigeye tuna and yellowfin tuna. During
2010-2012, the fishing operation amount 1,232 days or 3,449,600 hooks were recorded. The
highest catch of these species was in 2012, followed by 2011 and 2010, respectively. A total of
bigeye tuna and yellowfin tuna composition during 2010-2012 was 61.33% by number and
71.01% by weight of total catch. The highest CPUE of total catch was found in 2012, followed
by 2011 and 2010, respectively.
Page 1 of 5
IOTC–2013–WPTT15–43
Fishing grounds
The fishing data were collected from logbooks of two Thai tuna longliners during
2010-2012. Fishing grounds in 2010-2011 were distributed around central and southern part of
Indian Ocean. The fishing grounds in 2012 were mostly distributed in the middle part of
Western Indian Ocean (Figure 1).
2010
2012
2011
Figure 1 Fishing ground by Thai tuna longliners operated in Indian Ocean during 2010- 2012
Page 2 of 5
IOTC–2013–WPTT15–43
Fishing efforts
Fishing efforts during 2010-2012 were shown in table 1. In 2010, Thai tuna
longliners exerted the highest fishing effort 1,324,400 hooks (473 fishing days). On the other
hand, fishing efforts in 2011 were decreased to the lowest as 1,041,600 hooks (372 fishing days).
In 2012, the fishing efforts were a little increased from the year 2011 with 387 fishing days and
1,083,600 hooks were used.
Annual catches in 2010-2012 were estimated to 607.69, 370.39 and 470.40 tonnes,
respectively. The main tuna species caught during 3 years were bigeye tuna (Thunnus obesus),
albacore tuna (T. alalunga) and yellowfin tuna (T. albacares). Albacore tuna was the highest
catch with 263.41 tonnes in 2010. The catch of this species was decreased to 2.73 tonnes in
2012, while bigeye tuna catch was increased and attained to the highest at 248.60 and 342.18
tonnes in 2011 and 2012, respectively. Yellowfin tuna catch was decreased from 93.60 tonnes in
2010 to 81.92 tonnes in 2012 (Table 1).
Catch compositions
A total of bigeye and yellowfin tuna catch composition during 2010-2012 was shown
24,392 fish with 1,028.52 tonnes or equal to 61.33% by number and 71.01% by weight of total
catch composition. The percentage composition by number of bigeye tuna and yellowfin tuna
were found 69.71% and 30.29%, respectively. The percentage composition by weight was
73.98% and 26.02%, respectively.
During 2010-2011, average percentage compositions by number of bigeye tuna and
yellowfin tuna were 32.13% and 18.21%, respectively. Average percentage compositions by
weight of bigeye tuna and yellowfin tuna were 42.66% and 18.93%, respectively. In contrast,
catch compositions in 2012 of bigeye tuna and yellowfin tuna by number were 68.37% and
19.70%, respectively. Indeed, catch compositions by weight of bigeye tuna and yellowfin tuna
were 72.74% and 17.41%, respectively (Figure 2).
Page 3 of 5
IOTC–2013–WPTT15–43
Average catch composition by number during 2010-2011 Average catch composition by weight during 2010-2011
Catch composition by number in 2012
Catch composition by weight in 2012
Figure 2 Catch composition by number and weight
Catch per unit efforts (CPUEs)
The CPUE of total catch by Thai tuna longliners in 2010-2012 ranged between 9.36
and 13.62 fish/1,000 hooks, and the average CPUE was 11.46 fish/1,000 hooks. The highest
CPUE was in 2010, and the lowest CPUE was in 2011. In 2012, the CPUE by number were
shown 10.83 fish/1,000 hooks (Table 1).
During 3 year, Total CPUE of tropical tuna species (bigeye tuna and yellowfin tuna)
was 7.03 fish/1,000 hooks and 298 kilograms/1,000 hooks. In 2012, total CPUE of 2 species was
9.50 fish/1,000 hooks and 391 kilograms/1,000 hooks in 2012. In 2011, total CPUE of these
species was the lowest with 3.91 fish/1,000 hooks and 199 kilograms/1,000 hooks.
Page 4 of 5
IOTC–2013–WPTT15–43
For each species in 2012, the CPUE of bigeye tuna was shown 4.90 fish/1,000 hooks
and 220 kilograms/1,000 hooks, while the CPUE of yellowfin tuna was 2.13 fish/1,000 hooks
and 78 kilograms/1,000 hooks. (Table 2).
Table 1 Fishing efforts, catches and CPUEs of Thai tuna longliners in the Indian Ocean
during 2010-2012
CPUE
Catches weight (tonnes)
Fishing
days
No. of
hooks
Total
no. of
fish
ALB
BET
YFT
SWO
Sharks
Total
No.
2010
2011
2012
473
372
387
1,324,400
1,041,600
1,083,600
18,044
9,746
11,732
263.41
11.44
2.73
170.10
248.60
342.18
93.60
92.12
81.92
80.58
16.00
25.05
2.22
18.52
607.69
370.39
470.40
13.62
9.36
10.83
0.459
0.356
0.434
Total
1,232
3,449,600
39,522
277.58
760.88
267.64
121.63
20.74 1,448.48
11.46
0.420
Year
(per 1,000 hooks)
tonnes
Table 2 Fishing efforts, catches and CPUEs of bigeye tuna and yellowfin tuna by Thai tuna
longliners in the Indian Ocean during 2010-2012
Fishing
days
No. of
hooks
2010
2011
2012
473
372
387
Total
1,232
Year
Total catch
BET
YFT
Tuna catch
Tuna CPUE
(per 1,000 hooks)
No.
tonnes
No.
tonnes
No.
tonnes
No.
tonnes
1,324,400
1,041,600
1,083,600
18,044
9,746
11,732
607.69
370.39
470.40
2,994
5,883
8,021
170.10
248.60
342.18
2,188
2,842
2,311
93.60
92.12
81.92
5,182
8,725
10,332
263.70
340.72
424.10
3.91
8.38
9.50
0.199
0.327
0.391
3,449,600
39,522 1,448.48
16,898
760.88
7,341
267.64
24,239 1,028.52
7.03
0.298
69.71
73.98
30.29
26.02
61.33
4.90
0.220
2.13
0.078
%
CPUE (per 1,000 hooks)
Page 5 of 5
71.01
No.
tonnes
© Copyright 2026 Paperzz