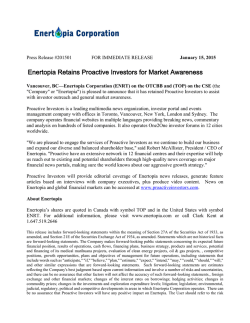
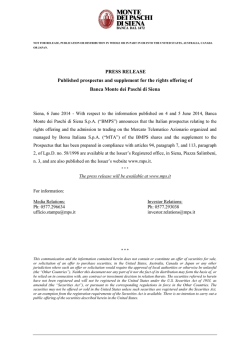
Global Perspectives Weekly India: Modi’s Ambitions NOVEMBER 26, 2014 In this Global Perspectives Weekly: Peter Donisanu Global Research Analyst Government Structural Reforms Alex Kun, CFA®, CMT® Senior Investment Analyst Hong Kong Wisely Ngai, CFA®, CAIA® Investment Analyst Hong Kong » Modi’s administration is implementing economic reforms across the country. » The “Make in India” campaign has identified 25 sectors in which India seeks to become a leader in manufacturing pursuits. » Indian officials are committed to improving the ease of doing business in the country. » We believe the government is heading in the right direction. But these reforms will take time to execute successfully. For now, we maintain a neutral recommendation on India. Since his landslide victory in May’s election, Narendra Modi, India’s new Prime Minister, has been implementing reforms across the country. Modi’s ambitions include national health initiatives, such as building more public restrooms and cleaning up the Ganges River. Recently, his administration also proactively proposed several economic reforms, including loosening restrictions of foreign investment in domestic infrastructure projects, promoting tax reforms, restricting subsidies on staple goods and energy, and establishing a real estate investment trust (REIT) system. Investors appear hopeful about the potential of such reforms to create long-term structural benefits for India’s economy. We believe that much of this optimism already has been priced into India’s capital markets, and as such, we maintain a neutral recommendation on the country’s equities. Infrastructure and government policy reform – The government launched the “Make in India” campaign in September 2014, identifying 25 sectors in which India seeks to become a leader, particularly in manufacturing and production pursuits. These sectors include defense, pharmaceuticals, food processing, auto and automobile components, and electronics. For example, an increase in the legal limit of foreign direct investment (FDI) in the defense sector aims to boost domestic manufacturing of defense equipment. Developing the manufacturing sector is a huge undertaking that will take a long time to achieve; however, the goal of easing restrictions for foreign investors to engage in local business ventures and participate in domestic infrastructure projects demonstrates Modi’s determination to transform India into a global manufacturing hub. The government also recognized the need to kick-start the capital expenditure cycle. The Project Monitoring Group of the Cabinet Secretariat, in addition to approving projects, also is providing assistance for those projects. To support the group’s efforts, the Modi administration is encouraging new sources of financing, 1 Global Perspectives Weekly including infrastructure investment trusts to increase the flow of capital to infrastructures, REITs, and infrastructure bonds. In addition, the government has announced policies to support numerous infrastructure projects. The central bank has relaxed capital requirements for banks. For example, if banks issue long-maturity bonds for lending to infrastructure companies, the corresponding bond issuances can be excluded in the deposit reserve and liquidity ratio requirements. This policy incentivizes banks to lend more to the infrastructure industry; hence, lower the financing costs for those companies. Easy access to funding is expected to expedite the progress of infrastructure build out across the country. Chart 1: Confidence improving – India business optimism index Business Survey, Dun & Bradstreet Business Optimism, Composite, Index - India Y/Y Chg in Sentiment 15 10 5 0 -5 -10 12/12 03/13 06/13 09/13 12/13 03/14 06/14 09/14 Source: Wells Fargo Wealth Management; FactSet, 11/24/14 Business and governance reforms –To help facilitate the process for foreign investors who wish to conduct business in India, the government has established, “Team Invest India.” The team aims to attract and assist overseas investors by streamlining governmental regulations and the licensing process. Recently with the team’s assistance, the period of validity of industrial licenses has been extended from two years to three years, and can even be extended up to seven years. In addition, the team also has reduced the amount of requisite documentation for companies and has created a committee to review and abolish obsolete/archaic rules and regulations. The government also aims to attract foreign capital investors for various sectors of the economy. It recently approved a REITs system that, by definition, is legally required to distribute more than 90 percent of income to investors. The dividends received by investors would not be subject to federal tax. At the same time, the government has increased the amount of equity ownership permitted by law for foreign investors in certain industries. For example, the legally allowable foreign ownership of insurance companies has been increased from 26 percent to 49 percent equity. The government also intends to sell some equity in state-owned banks to overseas investors, which allows foreign capital to participate in India’s financial-services sector. Currently, only 60 percent of families in India have bank accounts and usage of credit cards is low. There are plenty of opportunities for growth in the banking sector. Modi seeks to expedite the decision-making process at all levels of the government to improve efficiency and productivity. He reduced the size of his cabinet of ministers, improving inter-ministerial coordination. A once empowered group of ministers and standing committees were abolished to enhance the administrative power at the top, which has led to more effective governance. The government also plans to 2 Global Perspectives Weekly establish a “Special Investigating Team” to deal with anti-money laundering, reduce corruption, and restore investors’ confidence. Chart 2: India foreign capital inflows 35 30 29.3 Capital Flow to India (USD million) 24.5 Billion USD 25 19.9 20 15.4 15 10 5 0 -0.5 -5 2010 2011 2012 2013 2014 YTD Source: Wells Fargo Wealth Management; JP Morgan, 11/24/14 Our view – With this series of reforms, Modi’s administration appears headed in the right direction. These reforms demonstrate Modi’s ambitions in restructuring India’s economy to address some long-term issues, like a lack of new infrastructure and capital outflows. Infrastructure is a critical foundation of economic development in a country. We see that India is still lagging behind other emerging-market countries, (e.g. China, in terms of the infrastructure framework). Modi’s reforms are expected to help India play catch-up with other emerging markets and advance economic development. Additionally, the Indian government is willing to open more investment opportunities for foreign capital to invest in local industries given its experience with capital outflows during previous crises. As doing business in India becomes easier, we believe foreign capital will be more inclined to invest in India. However, we believe it will take considerable time and effort to remove the deeply entrenched political obstacles to eventually realize these ambitious objectives. Policymakers will need to resolve systemic issues such as corruption and bureaucracy, which create strong headwinds for the implementation of these reforms, to be successful. For now, we maintain a neutral view on India. Investment implications — Since Modi’s administration took office, India’s economic growth has reversed the downward trend that we observed over the past two years. Second-quarter GDP grew at 5.7 percent, the fastest pace since the first quarter of 2012. Financial investments and utilities industries were the major contributors to recent growth. The drop in oil prices has helped alleviate inflationary pressures and reduce the current deficit, a longstanding concern for investors. This improvement in fundamentals may allow the government to loosen monetary policy and further stimulate the economy. With the backdrop of economic reforms, improving capital-market fundamentals, and favorable macroeconomic factors, India’s equity market has been one of the best-performing markets so far this year. Both the CNX Nifty Index and the BSE Sensex Index rallied with returns of more than 30 percent. Although the dividend yields are relatively low, company earnings growth continues to strengthen. Investment opportunities can be found in the financial services sector, and in particular, privately-owned banks with more efficient operations and larger market shares of lending business. 3 Global Perspectives Weekly Weekly Capital Markets Activity (11/14/14 – 11/21/14) Global Equity Markets MSCI All Country MSCI EAFE DAX (Germany) CAC 40 (France) FTSE 100 (UK) FTSE MIB (Italy) IBEX 35 (Spain) Nikkei (Japan) MSCI EM Shanghai SE (China) BSE 100 (India) KOSPI (South Korea) BOVESPA (Brazil) Mexico IPC Wk 1.2% 1.0% 5.2% 3.4% 1.4% 5.2% 3.7% -0.8% 1.4% 0.3% 1.0% 1.0% 8.3% 2.9% MTD 1.4% 0.7% 4.3% 2.7% 3.1% 0.9% 0.4% 5.7% -1.2% 2.8% 1.7% 0.0% 2.7% -0.9% YTD 4.4% -4.3% 1.9% 1.7% 0.3% 5.2% 6.3% 6.5% 0.2% 18.6% 34.0% -2.3% 8.9% 3.9% Global Sovereign Bond Market Commodity Prices Italy Spain France Germany Greece Portugal UK US Japan India Energy Brent Crude Oil $/bbl Natural Gas $/MMBtu Agriculture Corn $/bushel Soybean $/bushel Precious Metals Gold Spot $/oz Silver Spot $/oz Industrial Metals LME Aluminum $/Mt LME Copper $/Mt Livestock Lean Hogs $/lb Live Cattle $/lb Yield Wk Chg (BPS) 2.21 -13.3 2.01 -11.3 1.11 -2.8 0.77 -1.5 7.83 -13.4 3.00 -19.0 2.05 -6.8 2.31 -1.1 0.46 -2.1 8.17 -4.7 Mexico IPC BOVESPA (Brazil) KOSPI (South Korea) BSE 100 (India) Shanghai SE (China) MSCI EM Nikkei (Japan) IBEX 35 (Spain) FTSE MIB (Italy) FTSE 100 (UK) CAC 40 (France) DAX (Germany) MSCI EAFE MSCI All Country 2% Ag -0.5% Livestock 0.1% PrecMet 0.9% IndustMet 1.5% Energy 2.9% 0% Gra phi c repres ents the a vera ge s ector wei ghts of the S&P GSCI, Rogers Interna ti ona l Commodi ty, a nd Bl oomberg Commodi ty i ndi ces a s of 11/21/14. Energy – 49%; Agri cul ture – 26%; Preci ous Meta l s – 12%; Indus tri a l Meta l s – 9%; Li ves tock – 4%. Da ta i n thi s gra phi c repres ents the one-week cha nge i n s ector pri ce a ccordi ng to thei r res pecti ve Bl oomberg Commodi ty Index Fa mi l y. 4% Currency Table (Pairs) Currency Table (Change in Pairs) Cross rate as of 11/21/14 One Week Change: 11/14/14 - 11/21/14 USD MXN BRL CNY AUD CAD CHF GBP EUR 1.24 16.87 76.75 3.12 7.68 1.43 1.39 1.20 0.79 146.0 0.54 0.12 INR JPY 0.01 0.52 0.02 0.05 0.98 0.01 0.82 GBP 1.57 21.33 96.8 3.94 9.59 1.81 1.76 1.52 CHF 1.03 14.05 63.87 2.59 6.31 1.19 1.16 1.03 CAD 0.89 12.13 54.75 2.24 5.45 AUD 0.87 11.81 53.69 2.18 5.31 CNY 0.16 2.22 10.09 0.41 BRL 0.40 5.41 24.53 INR 0.02 0.22 MXN 0.07 USD 2.43 0.97 JPY EUR USD EUR MXN INR BRL CNY AUD CAD CHF GBP 0.69 JPY -1.3% 0.0% -1.2% -4.5% -1.4% -0.4% -1.9% -0.2% -1.2% GBP -0.1% 0.6% 0.66 121.5 0.83 CHF -1.1% -0.4% -0.2% -4.3% -1.2% -0.2% -1.6% 1.2% 0.1% -3.4% -0.2% 0.9% -0.6% 1.1% 0.86 0.57 ##### 0.72 CAD 0.5% 0.84 0.55 ##### 0.70 AUD -0.9% -0.3% 0.0% -4.2% -1.0% 0.19 0.18 0.16 0.10 19.24 0.13 CNY 0.1% 1% 0.46 0.45 0.39 0.25 46.83 0.32 BRL 3.4% 4.1% INR -0.1% 0.5% 0.04 0.10 0.02 0.02 0.02 0.01 1.91 0.01 0.45 0.08 0.08 0.07 0.05 8.65 0.06 13.62 61.78 2.52 6.12 1.15 1.12 0.97 0.64 117.8 0.81 Thi s ta bl e repres ents a cros s -currency pa i r i n a ma tri x forma t. The col umn on the l eft denotes the l oca l currency a nd the row a t the top of the ta bl e the forei gn currency. For exa mpl e, i f the l oca l currency i s EUR (euro) a nd the forei gn currency i s USD (U.S. dol l a r), then 1 euro buys $1.24 U.S. dol l a rs (a s of 11/21/14). MXN -0.6% USD JPY EUR -1.1% -0.4% -0.2% -4.4% 0.5% -0.2% -1.5% 0.0% -1.0% 0.2% 184.4 1.26 0.18 4.53 WK 2.9% 1.2% 6.1% -0.5% -2.3% 1.6% 0.9% 1.1% 0.8% 1.5% 1.8% 0.1% 0.1% -2.5% 0.5% Commodities Headline Equity Markets One-week Change -2% Price -$80.4 $4.27 -$3.85 $10.39 -$1,202 $16.44 -$2,065 $6,785 -$0.90 $1.72 0.6% 0.8% -2.8% 0.4% 0.2% -3.2% 3.4% 1.4% 1.6% -0.2% 1.2% 1.0% -1.0% 0.2% 0.0% 1.7% 1.6% -1.4% 0.2% -0.8% 0.4% 0.6% 0.2% 1.0% -0.4% 1.2% 0.3% 1.4% 1.2% 4.3% 4.6% 3.5% 4.8% 4.7% -3.3% -0.2% 1.1% -0.5% 0.6% 0.0% 1.2% 1.1% 3.3% 2.8% -0.5% -4.0% -0.8% 0.2% -1.1% 0.4% -0.6% 0.7% 0.5% 0.1% -3.3% -0.1% 0.9% -0.5% 1.1% 1.1% 0.1% 1.3% Thi s ta bl e repres ents the one-week cha nge for a gi ven cros s -currency pa i r. A pos i ti ve va l ue i ndi ca tes tha t a l oca l currency ha s a ppreci a ted (or you ca n buy more of a gi ven forei gn currency). The i nvers e i s true for a nega ti ve va l ue. 4 Global Perspectives Weekly All data in this Global Perspective Weekly was sourced from Bloomberg unless otherwise noted. Disclosures Wells Fargo Wealth Management, a business division of Wells Fargo & Company, provides products and services through Wells Fargo Bank, N.A. and its various affiliates and subsidiaries. This report is made available in the United States only by Wells Fargo Wealth Management a business division of Wells Fargo Bank N.A. Wells Fargo Wealth Management takes full responsibility for the distribution of the report. Any unauthorized use, duplication, redistribution or disclosure of this report is prohibited. The information and opinions in this report were prepared by the investment management division within Wells Fargo Wealth Management. Information and opinions have been obtained or derived from sources we consider reliable, but we cannot guarantee their accuracy or completeness. Opinions represent Wells Fargo Wealth Management’s opinion as of the date of this report and are for general information purposes only. Wells Fargo Wealth Management does not undertake to advise you of any change in its opinions or the information contained in this report. Wells Fargo & Company affiliates may issue reports or have opinions that are inconsistent with, and reach different conclusions from, this report. The information and opinions in this report were principally prepared by representatives of Wells Fargo Securities Asia Limited (“WFSAL”), which is regulated by the Securities and Futures Commission in Hong Kong, for Wells Fargo Bank, N.A. The information in this document has been obtained or derived from sources believed by WFSAL to be reliable, but WFSAL does not represent that this information is accurate or complete. WFSAL may have received assistance from the issuers or managers referred to in this report including, but not limited to, discussions with management of these entities. Wealth Management policy prohibits analysts from sending draft reports to funds or managers. However, it should be presumed that the author of this report has had discussions with each featured issuer and/or its manager to ensure the accuracy of the facts presented in this report. Any opinions or estimates contained in this document represent the judgment of WFSAL, at this time, and are subject to change without notice. Notwithstanding the fact that other business divisions within the firm may advise issuers or managers discussed in this report, information obtained in such roles is not used in the preparation of research reports. WFSAL and its affiliates may from time to time provide advice with respect to, acquire, hold, or sell a position in, the securities or instruments named or described in this document, including selling to and buying from customers. They may engage in transactions in a manner that is inconsistent with the views expressed in this report. Wells Fargo Bank, N.A. and/or its affiliates may receive remuneration in respect of a wide variety of services and for acting in various capacities that may relate, directly or indirectly, to any of the funds or managers covered. They may receive rebates in relation to initial public offerings and/or receive fees or other remuneration in connection with advisory services or the performance, management, servicing, administration or distribution of investment products. They may participate in the creation or redemption of securities or interests covered in this report and may acquire such securities from the issuers for the purpose of resale. Wells Fargo Bank, N.A. and/or its affiliates may receive remuneration for executing trades in investment products. They may also earn compensation through fees embedded in the features of certain products. Wells Fargo Bank, N.A. and/or its affiliates may receive non-monetary benefits from product issuers for the sale or distribution of investment products. Examples include research and advisory services, market or portfolio analysis, training/seminars, travel and hospitality, de minimis gifts and nominal value promotional items. Where Wells Fargo Bank, N.A. has an existing business relationship or seeks to establish a business relationship with a manager or a fund that is a subject of Wells Fargo Wealth Management’s research reports, these relationships may give rise to a conflict of interest that could affect the objectivity of this report. Wells Fargo Wealth Management makes disclosure of such conflicts in accordance with applicable law. Analysts receive no direct compensation in connection with the firm’s investment banking business. Analysts may be eligible for annual bonus compensation based on the overall profitability of the firm, which takes into account revenues derived from all the firm’s business activities, including the investment banking business. Past performance does not indicate future results. The value or income associated with a security may fluctuate. There is always the potential for loss as well as gain. Investments discussed in this report are not insured by the Federal Deposit Insurance Corporation or any other government agency and may be unsuitable for some investors depending on their specific investment objectives and financial position. Asset allocation and diversification do not assure or guarantee better performance and cannot eliminate the risk of investment losses. Your individual allocation may be different than the strategic long-term allocation above due to your unique individual circumstances. The asset allocation reflected above may fluctuate based on asset values, portfolio decisions, and account needs. Indexes represent securities widely held by investors. You cannot invest directly in an index. S&P 500 Index is a capitalization-weighted index calculated on a total-return basis with dividends reinvested. The index includes 500 widely held U.S. market industrial, utility, transportation and financial companies. The BSE Sensex Index is comprised of 100 Indian companies with varying weightings. The BSE Sensex index was launched in January 03, 1989 and was previously known as the BSE National index. The base year for this index is 1983-84 with base index value fixed at 100 points. BSE Sensex was launched on full market capitalization method and shifted to Free-Float methodology effective from April 5, 2004. The CNX Nifty Index is a stock index endorsed by Standard & Poor's and composed of 50 of the largest and most liquid stocks found on the National Stock Exchange (NSE) of India. It is commonly used to represent the market for benchmarking Indian investments. Similar to other major stock indexes like the S&P 500, companies must meet certain requirements in terms of market capitalization and liquidity before they can be considered for inclusion in the index. Wells Fargo and Company and its affiliates do not provide legal advice. Please consult your legal advisors to determine how this information may apply to your own situation. Whether any planned tax result is realized by you depends on the specific facts of your own situation at the time your taxes are prepared. 5 Global Perspectives Weekly This report is not an offer to buy or sell, or a solicitation of an offer to buy or sell the securities or strategies mentioned. The investments discussed or recommended in the presentation may be unsuitable for some investors depending on their specific investment objectives and financial position. Exposure to the commodities markets may subject an investment to greater share price volatility than an investment in traditional equity or debt securities. Products that invest in commodities may employ more complex strategies which may expose investors to additional risks. Investments in currencies involve certain risks, including credit risk, interest rate fluctuations, fluctuations in currency exchange rates, derivative investment risk and the effect of political and economic conditions. The use of currency transactions to seek to achieve gains in the portfolio could result in significant losses to the portfolio which exceeds the amount invested in the currency instruments. In addition, exchange rate risk between the U.S. dollar and foreign currencies may cause the value of the fund’s investments to decline. Investing in foreign securities presents certain risks that may not be present in domestic securities. For example, investments in foreign and emerging markets present special risks, including currency fluctuation, the potential for diplomatic and potential instability, regulatory and liquidity risks, foreign taxation and differences in auditing and other financial standards. Some complementary strategies and real assets may be available to pre-qualified investors only. Real estate investments carry a certain degree of risk and may not be suitable for all investors. © 2014 Wells Fargo Bank, N.A. All rights reserved. 6
© Copyright 2026 Paperzz