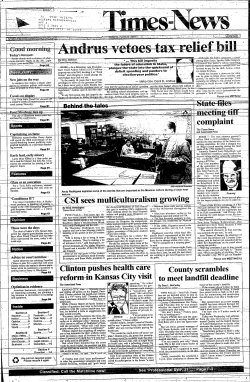
9-603-066 REV: JUNE 29. 2006 RICHARD M. J. BOHMER AMY C. EDMONDSON Intermountain Health Care Dr. Brent James, executive director of Intermountain Health Care's (IHC’s) Institute for Health Care Delivery Research, explained to a group of IHC's clinical leaders gathered around the conference room table that the more often physicians and nurses complied with IHC’s Clinical Integration care delivery protocols, the more patient-care quality improved. He summarized his thoughts: “Anytime I get physicians to use them, I’m basically tracking them into an evidence-based, standardized line of clinical thought.” One nurse appeared reluctant and—perhaps overstating her case to emphasize that each patient was unique and could not be treated in an assembly line manner—exclaimed, “We're not making widgets here!” Unexpectedly, James countered, “Oh yes we are!” Clinical Integration referred to an organizational structure and network of tools, including paper and electronic protocols and a centralized patient database that organized the delivery of clinical care at IHC Health Services. Clinical Integration was presented as a set of care- and productivityenhancing tools that would “Make it easy to do it right.” For example, diabetes management was most effective among patients whose physicians had full electronic clinical-decision support; not inconsequentially, those physicians were directly employed by IHC. Even though no one—neither practitioners employed by IHC nor non-employee physicians who admitted patients to IHC facilities—was required to adhere strictly to the Clinical Integration caredelivery protocols, critics saw an insidious element to them, calling them a Taylorist1 system that stripped away the autonomy of those who practiced the craft of medicine. James acknowledged that following the protocols increased the interdependence between the physician and the health care team, but believed that Clinical Integration was a crucial component of IHC’s affordable and high quality clinical care. James reflected: The big strategic issue I face is how to bring the affiliated [non-employee] physicians on board. Some of the affiliated physicians vociferously hate our evidence-based care-delivery protocols. Using the protocols moves previously independent physicians into de facto group practice. They see such group practice, where they are directly and transparently accountable for their treatment decisions, as a loss of traditional physician autonomy, prestige, power, and income. . . . But you see, I can protect their money, and they will retain autonomy—although at 1 Referring to the ideas of Frederick Taylor, author of The Principles of Scientific Management (1911). Taylor had a profound influence on U.S. manufacturing practices, preferring discrete, highly controlled tasks to the craft-based practices that had preceded the assembly line. An analogous phrase to Taylorism in medical practice is the derogatory “cookbook medicine.” ________________________________________________________________________________________________________________ Professors Richard M. J. Bohmer and Amy C. Edmondson, and Research Associate Laura R. Feldman prepared this case. HBS cases are developed solely as the basis for class discussion. Cases are not intended to serve as endorsements, sources of primary data, or illustrations of effective or ineffective management. Copyright © 2002 President and Fellows of Harvard College. To order copies or request permission to reproduce materials, call 1-800-545-7685, write Harvard Business School Publishing, Boston, MA 02163, or go to http://www.hbsp.harvard.edu. No part of this publication may be reproduced, stored in a retrieval system, used in a spreadsheet, or transmitted in any form or by any means—electronic, mechanical, photocopying, recording, or otherwise—without the permission of Harvard Business School. Purchased by Chris Mitchell ([email protected]) on January 21, 2013 603-066 Intermountain Health Care a professional, not an individual level. But, they have to be willing to function as part of a group. Intermountain Health Care: Structure Intermountain Health Care was established in 1975 by volunteer trustees as a nonprofit system of fifteen hospitals in the state of Utah. Most of the hospitals were established after 1905 (when LDS Hospital in Salt Lake City was founded) by local communities in partnership with the Church of Jesus Christ of Latter-Day Saints (LDS). When the LDS Church decided that the operation of health care facilities was no longer critical to its religious mission, IHC was created as a secular, nonprofit organization to own the hospitals on behalf of the community.2 In 1983, IHC transitioned from being exclusively a hospital company and became an insurer. The provider arm was known as IHC Health Services. (Exhibit 1 describes IHC’s insurance business.) By 2001, IHC Health Plans directly enrolled 460,000 members or about 40% of the Utah commercial market.3 (Exhibit 2 provides more detail on the population of Utah.) IHC Health Services was an award-winning vertically integrated health care organization, recipient of Healthcare Forum’s Witt Award in 1991 and the NCQHC Quality Health Care Award in 1996. IHC was named by Modern Healthcare as the premier organization of its kind for three consecutive years. Facilities By 2002, IHC Health Services comprised more than 150 facilities, including 22 hospitals, 25 health centers, and over 70 outpatient clinics, counseling centers, and group practice offices, located across Utah and southeastern Idaho. IHC had invested $1.9 billion over nine years for renovation and expansion of existing facilities and for construction of a new flagship campus for the Salt Lake Valley, scheduled to open in 2006. Information technology IHC was nationally recognized for its information systems, the backbone of which was the Health Evaluation through Logical Processing system (HELP) for inpatient care, and Clinical Workstation (CW) for use in outpatient clinics and physician offices.4 HELP was a clinical information system first conceptualized in the early 1960s as an automated diagnostic tool for physiologic monitoring.5 Over time, the system evolved to provide practitioners clinical-decision 2 IHC’s mission stated “Excellence in the provision of health care services to the communities in the Intermountain region” and the vision promised “The best clinical practice delivered in a consistent and integrated way; lowest appropriate cost to the population we serve; a service experience, supported by systems and processes, that focuses on the patient and enrollee; a genuine caring and concern in our interactions with patients, enrollees, families, and one another.” 3 While IHC did not track race or income within their Health Plans population, they estimated their enrollees mirrored the general employed population of Utah. 4 When first introduced thirty years ago, hospital computing systems were almost exclusively billing and financial functions; clinical computing systems, which manage medical data, were much less common. Forerunners in clinical computing systems were the HELP system at IHC, the Regenstrief Medical Record System at the Regenstrief Institute (IN), and the Brigham Integrated Computing System at Brigham and Women’s Hospital (Boston, MA). For more detail on clinical information systems see the International Journal of Medical Informatics, 54 (1999): 3. 5 H.R. Warner, A.F. Toronto, L.G. Veasey, R.A. Stephenson, “A mathematical approach to medical diagnosis: application to congenital heart disease.” Journal of the American Medical Association. 177 (1961): 177–183. 2 Purchased by Chris Mitchell ([email protected]) on January 21, 2013 Intermountain Health Care 603-066 support: in the early 1970s, pharmacists entered prescriptions into the system to screen for drugdrug, drug-lab, and drug-radiology interactions; in the early 1990s, an electronic medical record (EMR) was introduced, enabling ICU patient monitoring, surgery scheduling, and transcription; by 1994, the Antibiotic Assistant, one of several clinical-decision support modules built within HELP, could essentially “read” a patient’s medical history and suggest appropriate antibiotics and dosage schedules for patients suffering from infections.6 In early 2001, IHC added Results Review, a function that gave physicians Web-based online access to appointment books, patient consult notes and charts, and patients’ laboratory results. By 2001, the EMR allowed users to perform structured queries and in three clicks of the mouse go from reviewing a patient’s clinical data to the pertinent medical literature. In 2001, the system featured 18,000 workstations and 16,000 clinical users. (See Exhibit 3 for a diagram of IHC’s information system.) Regions IHC Health Services was organized into four regions: Urban North, Urban Central, Urban South, and Rural. Each Urban Region was centered around a large tertiary “collector” hospital, with a series of smaller feeder hospitals and outpatient facilities. Each urban region coordinated with geographically associated rural region facilities. Regions were led by a regional vice president, one or a team of medical hospital directors, and one or a team of medical directors representing the facilitybased physician groups. Regional senior management teams included a chief medical officer, medical directors from each of the Clinical Integration Clinical Programs, and a variety of staff with financial and data management expertise. Physician Rings Professional staff at IHC Health Services were arranged in three rings. Ring 1 compromised about 1,200 practicing primary care and specialist physicians, 400 of whom were salaried IHC employees (60+% of the 400 were primary care physicians) working under the auspices of the IHC Physician Division. The Physician Division had 1,457,000 outpatient encounters in 2001 and accounted for about half of all outpatient and inpatient care delivered within IHC during 2001.7 An additional 800 “affiliated” or “non employed” physicians completed Ring 1. Although the 800 were private community-based practitioners, 80% of their patients were insured by IHC Health Plans or received care at IHC institutions. An analysis of patient volume performed by Dr. David Burton, IHC’s vice president for Health Care Delivery Research, found that 94% of all patients (inpatient and outpatient) treated at IHC facilities were under the care of one of the 1,200 Ring 1 physicians. Ring 2 comprised a small group of 50—100 “splitter” physicians, who derived between 40% and 60% of their practices from IHC-associated patients. Ring 3 totaled more than 1,500 additional physicians who were only loosely associated with IHC, admitting patients to IHC facilities, referring patients to IHC-employed physicians, or occasionally treating IHC-insured patients. Practitioner groups within the Physician’s Division—most often in the form of regionally-based multi-specialty clinics—were fairly common. The two largest multi specialty groups employed about 150 Physician Division physicians. There were half a dozen specialty groups; Greg Poulsen, MBA, 6 R.S. Evans, S.L. Pestotnik, D.C. Classen, et al. “A computer-assisted management program for antibiotics and other antiinfective agents.” New England Journal of Medicine 338 (1998): 232–238. 7 The provider garnered 65% prospective payments (33% for Medicare, 11% for Medicaid, 15% for IHC Health Plan enrollees, and a small savings from self-pay, or charity, care) from its enrollees, compared to an average of 30–35% on the East Coast. 3 Purchased by Chris Mitchell ([email protected]) on January 21, 2013 603-066 Intermountain Health Care vice president for Strategic Planning and Research, anticipated more would be formed in the future. Physician’s Division primary care practitioners were spread among 30 locations. IHC Health Services frequently contracted out to other insurers who were too small (with fewer than 30,000 enrollees) to create their own physician network. A subset of tightly aligned, independent insurance plans, accounting for more than 500,000 additional commercial insurance lives, used IHC’s facilities and physician networks almost exclusively. IHC gave those insurance plans the same footing and rates as its own internal health plans. Compensation The compensation structure for employed physicians was divided into four parts: salary (30%), Fee For Service (FFS) payments (40–50%), and a performance-based bonus (10%). Although specific criteria for the bonus varied from group to group (i.e., clinic to clinic), it generally reflected grouplevel financial performance and clinical quality indicators. The fourth component, “profit sharing” for overall organizational profitability, sometimes bumped physician salaries above 100%. The 800 affiliated physicians were paid by a discounted FFS system and did not have performance incentives. None of the 1,200 physicians worked under capitation. Governance In 1993, IHC invited physicians to participate more fully in the operation and governance of the organization. Half of the 28 member IHC board of trustees were selected from Ring 1 physicians; the remaining seats were occupied by volunteer members of the community and IHC senior management. In addition, about 300 community members served on the boards of local facilities. Brent James, MD, M.Stat Brent James, a surgeon and biostatistician by training, was executive director of Intermountain Health Care's Institute for Health Care Delivery Research (IHCDR, or the Institute) and served as IHC's vice president for Medical Research and Continuing Medical Education. He came to IHC in 1986 from the Harvard School of Public Health, where he taught biomedical computing and biostatistics. James returned to Utah (he received his undergraduate, medical, and masters degrees from the University of Utah) because he believed IHC had one of the finest data systems in the country. Presented with the task of leading a clinical research program at IHC, James became intrigued by the quality of health care services. The Institute—employing 15 staff, roughly one-half of whom were trained as biostatisticians and analysts—was founded in 1990 to support James’ work around organizing for clinical management. It was co-located with IHC senior administration in a downtown Salt Lake City facility. The Institute was a hub for internal research on the management of clinical medicine. Another arm of the Institute ran 2-, 9-, and 20-day training sessions on quality management and clinical quality improvement for physicians and health care system administrators within IHC and from around the world. James’ calendar was always booked: in addition to conducting research, honoring speaking engagements, 4 Purchased by Chris Mitchell ([email protected]) on January 21, 2013 Intermountain Health Care 603-066 and serving on several national task forces on health care quality, he facilitated all the classes offered by the Institute.8 History of Clinical Care Management at IHC Nationally lauded as a leader in clinical quality improvement among delivery systems, IHC’s approach to clinical-care management changed course in 1995 when then IHC executive vice president Bill Nelson (now CEO) challenged James to fuse his “science projects”—Nelson’s pet term for the proliferation of clinical and managerial quality improvement projects across IHC over the past nine years—into a comprehensive clinical management model. James explained, “There was a sentinel moment when we realized that our business was clinical medicine.” He continued, “A big hindrance to quality improvement in health care centers around deployment . . . you tend to get these silo projects that just don’t spread.” Clinical process management would replace the previous piecemeal approach to improvement in health care delivery. Early Interest in Quality Improvement Reflecting on his tenure at IHC, James noted that IHC had begun to tinker with the concept of clinical-care management in 1986, with a series of investigations called QUE (Quality, Utilization, and Efficiency) studies, which was classic health services research examining variation in clinical practice. While conducting the QUE studies, James attended a lecture by Dr. W. Edwards Deming, known as the father of TQM, who introduced a “crazy” idea: Deming argued that higher quality could lead to lower cost.9 James returned to Salt Lake City and tested Deming’s cost-quality hypothesis in preexisting IHC clinical trials: “We just started to add cost outcomes to our traditional clinical trials and proved it true within a few months.” James realized that it was due to a “godsend” that he was able to collect cost outcomes: in the early 1980s Steven Busboom in Finance and Poulsen in business strategic planning had decided they had to be able to measure the cost of clinical care. Busboom and Poulsen built an activity-based cost accounting system and implemented it across all facilities in the IHC system. James was able to attach costs to individual clinical activities and then build a cost profile of different strategies for managing a particular clinical condition. Senior management within IHC felt they could realize Deming’s maxim by allowing their physician population to self-manage. In 1986, Dr. Steve Lewis, a pulmonary intensivist and IHC’s senior vice president for medical affairs, lead the formation of The Great Basin Physician Corporation, similar to a Preferred Provider Organization (PPO) structure for community physicians within IHC. According to James, the model’s emphasis on self-governance and protocols for care “helped pull the physicians together, but it never really materialized. It sort of died quietly on its own.” The quality movement As a follow-up to the 1991 annual management conference, IHC CEO Scott Parker sent around a memo with the subject line “Is quality improvement important for IHC?” Eighty percent of the respondents, representing IHC’s top 200 managers, said “Yes.” Many 8 James served on the Institute of Medicine’s National Roundtable on Quality, and its subsequent Committee on Quality of Healthcare in America, and contributed to their nationally heralded reports, To Err Is Human (1999) and Crossing the Quality Chasm (2001). 9 Deming (1900–1994) founded Total Quality Management, a widely used method of statistical process control to ensure consistency in production industries. Credited for invigorating the Japanese economy following WWII, he received the Second Order Medal of the Sacred Treasure from the Emperor of Japan in 1960. 5 Purchased by Chris Mitchell ([email protected]) on January 21, 2013 603-066 Intermountain Health Care referenced IHC’s mission statement in their responses. Parker consulted James as to what sort of action they should take, and James suggested all managers should attend IHC’s internal quality improvement training, where they could “rub shoulders with rank and file.” James reasoned that such a clear indication of top-management support could deliver a very positive quality message to all IHC employees. Parker declined; instead, he asked James to conduct a special session of the IHC Facilitator Workshop Series (totaling 8 days over 4 sessions) for the top 40 managers in IHC. Parker mandated attendance and was present himself in all sessions. James presented a concept (e.g., the use of protocols to control care delivery, how service quality affected the business, and models of leadership and participation) and then opened the floor for discussion. He said to the group: “Here’s a central concept. Does it apply to IHC? How would it look as it plays out within IHC? What things would we need in place?” Later, James commented, “Here’s the crazy thing: we never reached any formal conclusions. But it’s fair to say that the shared vision that we came away with from that series of meetings has informed our decision making ever since.” The clinical counterpart to the Facilitator Workshop series, developed in 1992, offered senior physician leadership the opportunity to learn about clinical quality improvement. Participants in the 20-day, biannual Advanced Training Program in Health Care Delivery Improvement (ATP) workshops were required to do a clinical-improvement project, such as implementation of an evidence-based best practice protocol for diabetes mellitus, or reduction of post operative wound infections in elective surgical cases. In James’ words, “[the] ATP acted as magnet to draw what today I would call early adopters. Physicians and nurses would come out of the ATP as absolute quality zealots, convinced that this was something the profession needed to do.” The project phase Enthusiasm for clinical management swelled between 1992 and 1995 as more clinical and managerial staff were exposed to ATP and the Facilitator Workshop Series. On the administrative side of IHC, literally thousands of improvement projects were undertaken to reduce costs and solve facilities-management problems. (For example, one project streamlined installation and maintenance of IHC’s extensive telecommunications network.) In 1995, at Nelson’s request, James identified 65 clinical protocols that had been developed and implemented, producing about $20 million in net annual savings in a clinical operating budget of about $1.5 billion, as well as significant gains in clinical quality. (See Exhibit 4). Developing a Strategic Plan The second attempt at physician self-management was in 1993, when a newly hired senior vice president for medical affairs tried to establish a clinical management structure by hiring physician leaders and providing them with management tools. By the time he was called away to serve a mission for the LDS Church, several million dollars had been spent without any significant changes in management practice. James felt that in order to build a successful clinical management system there had to be an overarching guidance structure. He approached Burton, himself just returned from a three-year Church mission, and began to form a strategic quality plan for IHC. James reflected on previous attempts to have physicians manage clinical operations: In each of the [two prior] programs, we found physicians willing to manage. We trained them in management skills, gave them the financial data we used for the administrative operations, and then asked them to go manage physicians. In retrospect, it was the wrong data—or, at least, not enough of the right data. It was financial data organized for facilities management. At best, it was health plans claims data that gave a full financial history of a patient’s care 6 Purchased by Chris Mitchell ([email protected]) on January 21, 2013 Intermountain Health Care 603-066 without the associated clinical detail. But even that didn’t even come close. That’s the reason we failed the first two times we tried to introduce clinical management. James continued: “You manage what you measure . . . Doctors manage patients, not money. The data [that we provided them] didn’t have anything to do with those tasks, as physicians and nurses saw them.” The key to engaging physicians in clinical management was to make it meaningful by aligning data collection to work processes. This represented a pivotal shift in mental model and in practice. James explained: “Managers think in terms of cost-per-facility, which, in health care, translates to cost-per-unit [e.g., ICU, phlebotomy, or surgery]. By contrast, doctors think in terms of resources, or tests and treatments required for a specific condition.” Families of care The strategic plan developed by Burton and James organized IHC Health Services into (1) clinical conditions, (2) clinical support services, (3) service quality (internally referred to as Patient Perceptions of Quality), and (4) administrative support processes. When looking at clinical conditions, Burton and James used four criteria to identify key work processes and families of care that comprised the bulk of care provided at IHC facilities. They identified key processes according to patient volume, intensity of care (cost per day), variability, and what were termed “socially important conditions” (e.g., conditions common in ethnic minorities and women). They found that 62 of over 600 clinical work processes accounted for 93% of inpatient clinical volume and about 30 processes (15 chronic, 15 acute) comprised about 85% of outpatient clinical volume. They named the resulting series of clinical-process-based families “Clinical Programs,” and used them to group the most common Diagnosis Related Group (DRGs) for which hospitals sought third-party payment.10 Burton and James identified eight families of care for hospital-based procedures, then added a ninth Clinical Program (the Primary Care Clinical Program) to cover the 30 conditions most commonly managed in the outpatient setting. Each Clinical Program comprised a series of high-priority, tightly related clinical-care processes. For example, the nine most common clinical treatment processes performed in the Cardiovascular (CV) Clinical Program (to treat ischemic heart disease or congestive heart failure) represented 18.5% of IHC’s inpatient and outpatient expenditures in 1997. (See Exhibit 5 for a list of the eight referral care clinical programs and the CV clinical processes.) The strategic plan used a similar method to identify key work processes in the other three areas. For example, Clinical Support Services included non-condition-specific clinical work processes. Major divisions in Clinical Support Services reflected traditional facility management groupings such as pharmacy operations, pathology, procedure rooms (e.g., anesthesiology, operating rooms, and labor and delivery rooms), imaging, ICUs, and nursing units. Respiratory therapy, for example, was found to have five key processes among the more than 40 routinely performed: (1) oxygen therapy, (2) aerosolized bronchodilators, (3) chest physical therapy, (4) incentive spirometry, and (5) support for ventilator management, which accounted for more than 90% of all work performed by that group. The strategic plan, called “Clinical Integration,” was approved by the IHC board of trustees in 1996 and represented a major shift for IHC. Its aim was to establish quality (defined as process management with measured outcomes) as IHC’s core business approach and to extend full management accountability to IHC’s clinical functions. The plan unfolded over the next four years. In 1997, Burton and James tested, on a pilot basis, whether it was possible and practical to build clinical-outcomes-tracking data systems representing the two largest clinical activities within IHC: Pregnancy, Labor, and Delivery, which represented 11% of all inpatient care within IHC, in the 10 DRGs, or Diagnosis Related Groups, are standard codes used by health care providers for billing purposes. Developed for use by Medicare in 1983, DRGs represent prospective payment based on diagnosis (regardless of resources actually utilized), assuming a given diagnosis will require a basic packet of resources, tests, and days in the hospital. 7 Purchased by Chris Mitchell ([email protected]) on January 21, 2013 603-066 Intermountain Health Care Women and Newborn Clinical Program and ischemic heart disease (10% of all inpatient care delivery within the system, in the Cardiovascular Clinical Program). In 1998, they began to use outcomes data to hold IHC-associated employed and non employed professionals accountable for their clinical performance and to enable IHC to set and achieve clinical improvement goals. In 1999, the strategic task was to align financial incentives. To avoid passing on all the savings generated by clinical improvement to the payers, Burton and James found it necessary to build and test strategies to harvest part of those savings back to IHC Health Services and IHC’s associated independent physicians, thereby making clinical management financially stable. Finally, in 2000, the board of trustees instructed IHC’s senior management to roll Clinical Integration out across all operational functions. Change Infrastructure To facilitate the transition from a traditional management structure focused on managing the facilities within which clinical care took place, to one oriented around clinical quality and clinical processes, Burton and James built a clinical administrative structure to be the clinical counterpart of the administrative structure at each level in the organization. Clinical-Care Management Guidance Councils In 1998, pilot Guidance Councils were established for the Cardiovascular Clinical Program (initially focused on management of ischemic heart disease) and the Women and Newborn Clinical Program to coordinate program goals, management strategies, and data collection across an integrated system. The Guidance Councils were built around physician/nurse leadership dyads based in IHC’s three urban regions. In each region, a Clinical Program physician leader was selected from practicing physicians. IHC bought one-quarter of their time for Clinical Program leadership activities, and provided additional training in quality management, leadership, and financial skills. A full-time nurse manager dealt with routine administrative matters and provided a direct link to clinical staff. The physician/nurse dyads within each region had two major responsibilities: meeting with clinicalcare delivery groups that executed any of the key clinical processes in their Clinical Program and meeting with line administrative management structures in the region. (For more details on program governance see Exhibit 6.) Monthly Guidance Council meetings always included a report on current level of performance, progress towards meeting clinical goals, and the identification of barriers towards realizing the goals. Guidance Councils were authorized to approve guideline updates. Development Teams Within each of the Guidance Councils were one or more permanent Development Teams that focused on select clinical processes.11 Guidelines, or protocols for specific procedures, were created by Development Teams, sent to the front lines for implementation, data collection, and review, and updated as results traveled back up the pyramid. Exhibit 7 shows one such protocol. 11 For example, in 2001 the Primary Care Clinical Program had Development Teams in place for Diabetes, Adult Asthma, Pediatric Asthma, Lower Respiratory Infection (Community Acquired Pneumonia, plus Acute Bronchitis), Otitis Media, Chronic Anticoagulation, Depression, Congestive Heart Failure (also part of CV Clinical Program), Ischemic Heart Disease (also part of CV Clinical Program), and Low Back Pain (also part of Neuromusculoskeletal Clinical Program). 8 Purchased by Chris Mitchell ([email protected]) on January 21, 2013 Intermountain Health Care 603-066 Each Development Team comprised a physician leader, nurse, and physician team members drawn from front-line care deliverers who would actually implement any protocols the team developed, and a “core work group” of three or four expert physicians dedicated to following research around that specific key clinical process. IHC reimbursed all Development Team members for time spent working on the team. (Many were independent, community-based, practitioners.) IHC also supplied staff support for the development teams to (1) help design outcomes tracking systems (with assistance from the Institute’s statisticians, as well as representatives from IHC’s Electronic Data Warehouse group), using a set of formal design tools; (2) generate educational materials for professionals and for patients; (3) design and implement electronic medical record and clinical decision support systems (through IHC’s Medical Informatics group); and (4) plan and support operational implementation at the front line. Specialist physicians serving on core work groups had salaried time to fill four specific roles: (1) provide expertise to develop the initial evidence-based best practice protocol; (2) keep the protocol current over time by applying new findings from the medical literature, from similar practice groups in other institutions, and by closely tracking and leading discussions based on IHC’s internal outcome and protocol variation data; (3) detail front-line practitioners on “state of the art care” for their particular protocol through regular CME sessions; and (4) operate a specialty clinic for patients who could not be well-managed within the primary care setting. The pyramidal structure facilitated transference of best practice and most recent developments in the field to front-line practitioners. Similar to the work performed by the Development Teams, processes occurring within the clinical support services were analyzed, standardized, and specified. For example, twelve key processes defined the care delivered in the Shock Trauma Respiratory ICU (a Level 1 trauma unit). The standardization of key processes extended to all clinical pathology laboratories across all IHC inpatient and outpatient settings. An electronic laboratory reporting system, based on standard reporting language, made all results quickly available at any location within the system, regardless of its point of origin. Protocol development James identified three sources of ideas for developing and updating protocols: the medical literature, variance in outcomes data, and “spontaneous neat ideas.” In the first situation, for example, the Development Team for cardiovascular care scoured the medical literature (or guidelines published by professional societies, such as the American College of Cardiology) and found that IHC’s rates of appropriate use of discharge medications for cardiovascular disease—57% for beta blockers—while significantly better than national average performance of 41%, or even the average major academic hospital of 49%, was still well below theoretic perfect performance of 100%. In response, the CV team created a check sheet with indications and contraindications for patient discharge medications. In the new system, the nurse wrote the order on the medication sheet and presented it to the physician for approval and signature. Exhibit 8 shows improvement in appropriate use of discharge medication following implementation of the new protocol. In the second example, aggregated variance data were used to update protocols. Development Teams would look for statistically significant patterns of variance in process and outcome, with the view that they presented opportunities to improve the protocols. In 1995, in the course of analyzing outcomes data, a physician in family medicine recognized a split among the physician population in choice of antibiotics for Community Acquired Pneumonia (CAP). Part of the variance was attributed to a debate between two macrolides: clarithromicin and azithromicin. The development team conducted a literature review, which suggested no difference in efficacy. Dissatisfied with the medical literature, the group launched a randomized controlled trial and found improved outcomes were associated with azithromicin or a second class of antibiotics called quinolones, and specifically, 9 Purchased by Chris Mitchell ([email protected]) on January 21, 2013 603-066 Intermountain Health Care levoflocacin. The protocol was written to indicate azithromicin or levoflocacin as default antibiotics for the outpatient management of CAP.12 Finally, as James explained, “Sometimes people just come up with a neat idea,” a result of many years of practice and the accumulation of subtle observations about patient care. James cited LDS Hospital internist Dr. Alan Morris as an example: “Morris has all sorts of hunches that he tests. His ICU is a little learning lab. At one point he had three trials running, all using his standard ventilator hypoxemia protocol as the control arm.” To assess the effectiveness of protocols and other clinical management strategies, James and his colleagues developed an outcomes tracking system based on a “drill down” mentality. Starting with key clinical processes, they iteratively refined the set to identify the most pertinent measures. They took care to develop a set of balanced measures, including medical outcomes,13 patient perceptions of functional status, service quality, and cost. (See Exhibit 9 for an example of outcomes tracking for CAP.) James explained, “The aim was to develop data that showed appropriate intermediate and final outcomes within those categories aligned along the clinical processes of care.” The pilot programs allowed James and Burton to test the Clinical Program Guidance Council structure for organizing families of care, developing flow charts, setting annual clinical goals (focused on one aspect of care), and gathering data on current practice while simultaneously working to standardize and improve it. Integrated Management Structure Having built a new clinical management structure parallel to the existing line management, James planned to merge the two over time. His strategy for merging the two structures was to encourage interdependence so the groups would realize “they have to be joined at the hip.” Both branches of the parallel structure reviewed clinical goals and assessed outcome data according to their level of focus (i.e., individual physician, practice group, or region; Exhibit 10 provides more detail). James continued: We build it up parallel, give the medical management structure tight links and shared goals with the traditional administration, and then let the two management structures collapse together, into a single structure. We hope that over time they will experience and see the redundancy and ask themselves, “Why are we holding two meetings?” and merge of their own accord. IHC’s integrated management structure was cemented in 1998 when the format of the annual board-level goals was revised to include two or three goals per clinical program. (Exhibit 11 lists goals for the CV program.) James stated that one-third of board meeting time was devoted to clinical outcomes, which was far above the norm; the remaining two-thirds were focused on service quality performance and a traditional financial performance review. Finally, IHC senior management’s existing withhold-incentive-pay system was changed to reflect the new, balanced priorities. The board established a median salary for each senior management position based on a survey of other not-for-profit delivery systems similar in size to IHC. Twenty12 Following this, significant resistance (as high as 20%) to azithromicin developed among inpatients treated for CAP within IHC, leading to further modifications to the protocol. 13 Medical outcomes is defined as appropriateness of referral and procedures (indications guidelines), complications, and achievement of therapeutic goals developed among inpatients treated for CAP within IHC, leading to further modifications to the protocol. 10 Purchased by Chris Mitchell ([email protected]) on January 21, 2013 Intermountain Health Care 603-066 five percent of the median salary was withheld from senior management but could be won back by meeting goals. Prior to Nelson assuming the role of CEO, nearly all goals were financial, but he changed the withhold so that one-third was based on medical-outcome goals, one-third on service outcomes, and one-third on cost outcomes. In James’ words, this had “a very positive effect on getting the administrators to look at the clinical side of things.” Clinical Care Management: Operations Most health care delivery systems ran two parallel, redundant, data systems. Clinicians (i.e., physicians and nurses) maintained a medical record, while administrators tracked financial measures for billing and facility management. The financial information was captured, in large part, from the clinical process. Data were moved from clinical activities to financial operations through, (1), chart abstraction, and (2) by recording all billable clinical services (e.g., a dose of a drug, an imaging examination, or use of a procedure room).14 James noted that “such parallel data systems violate a key principle of data management—to obtain accurate data, collect data once, at its point of origin.” Moreover, such redundancy was wasteful. At one point, IHC estimated that as much as 15% of its single largest business expense, salary for operational staff, was devoted to entering data into the billing/financial tracking system. The Patient Care Management System The Patient Care Management System (PCMS) was conceived in 1997 when Burton and James asked themselves if it would be possible to organize nursing services by task and then structure an electronic clinical data collection system accordingly. James explained, “It’s that old idea of work processes that has worked so well in industry. PCMS is a new thing for health care but it’s not new to Alcoa Aluminum.” Part of the impetus for the PCMS was to reduce redundant data collection. Once nursing services (and all support services) were defined by type of task they could create one data system for clinical charting that would automatically generate billing data. The PCMS would also embed clinical protocols in a clinical workstation (a computer). Burton and James’ team identified four subcategories of nursing tasks: assessment, intervention, monitoring, and patient comfort and education. These categories were derived from a hierarchy of clinical reasoning that began with a functional problem list (making a diagnosis) to a goal list (how should the problem be controlled), and finally, a task list (actions to achieve the goal). For example, a patient presenting with an acute myocardial infarction (heart attack) would be entered into the computer system with left ventricular myocardial infarction (the functional problem). A window with a series of sub problems would pop up on the screen. Some of the subproblems, such as decreased coronary blood flow and oxygenation, were automatically generated, while an optional series of other problems could be checked off by the physician. Identification of the functional problem and sub problem would trigger a list of goals, including pain management and restoring blood flow through the heart. Each goal was directly linked to a series of orders or tasks, including follow-up patient monitoring tasks, to be performed by physicians and nursing staff. (See Exhibit 12 for an example of clinical care management interventions for diabetes.) The PCMS 14 Chart abstraction in most hospitals was notoriously inaccurate and a potential source of significant management problems relative to fraud and abuse in health care payment. The average hospital took more than three months to prepare a final bill, with every bill seeing a large number of corrections and changes after the fact. One study of bill accuracy estimated that over 50% of all final hospital bills contained at least one significant error. 11 Purchased by Chris Mitchell ([email protected]) on January 21, 2013 603-066 Intermountain Health Care incorporated decision support into the order set so that the system could automatically calculate, for example, morphine dosing for pain control. In 2001, IHC partnered with the Mayo Clinic and Stanford to develop the protocols (goal and task lists for major diagnoses) and with the health care information-systems firm IDX Systems Corporation to develop the software platform. IHC planned to go live on a pilot basis at Primary Children’s Hospital, two floors of LDS Hospital, and the medical surgery floor at American Fork Hospital in April of 2003. Clinical Information Systems James believed that IHC could “make it easy to do it right” by embedding protocols in the PCMS and making them the default option for care. The next step, after successful paper-based pilots of the PCMS, was to automate patient medical records and make them dynamic electronic documents that could interact with the electronic PCMS. To achieve this level of standardization, James turned to IHC’s IT system, and more specifically, the EMR. The Electronic Medical Record Two heuristics governed James’ strategy to encourage physician usage of the EMR: (1) every stage paid for itself, and (2) it had to fit into the flow of practice. James explained, “The rule is you can’t destroy clinical productivity.” A major strength of the EMR was that usage was largely intuitive and each step in the adoption process prepared the user for the next. (See Exhibit 13.) James elaborated: When one of our physicians got to this point [using the EMR for clinical charting] we didn’t have to even tell him about [the order function]. He found it on his own and it was literally a week to go from electronic charting to online medication orders. The EMR doesn’t require that you rethink the structure of the medical record—it’s enough to ask you to move from paper to computer. In addition to encouraging PCMS compliance, the EMR had several features for specialists—for example, the Antibiotic Assistant and automated ventilator settings—that supported the decisionmaking associated with routine care. Antibiotic Assistant One of IHC’s more popular decision support tools was the Antibiotic Assistant.15 Given a list of possible sources of infection, Antibiotic Assistant applied a protocol to perform a customized epidemiologic assessment of a patient, producing (1) a list of “most likely” causative pathogens, and (2) a list of the most appropriate antibiotic regimens to treat that set of possible sources of infection, including such factors as allergies, drug-drug interactions, and ideal patient-specific dosing. The program incorporated current antibiotic sensitivities in the hospital population. Dr. Colin Grissom, an academic attending in the ICU at LDS Hospital, stated, “I use this as a guide. I generally make my own decisions, but the great thing about it is the drug information.” Ventilator settings A second function of the EMR, available in the ICU of LDS Hospital, advised physicians and nurses about optimal ventilator settings customized to a particular patient. Additionally, it standardized the procedures followed by respiratory therapists for taking patients off the ventilator: for example, one ventilator weaning rule stipulated that a patient should always be taken off in the morning so that they could be off the ventilator during daytime hours, when more physicians were in-house. 15 Antibiotic Assistant was available across all of IHC’s major facilities, including outpatient clinics. 12 Purchased by Chris Mitchell ([email protected]) on January 21, 2013 Intermountain Health Care 603-066 Encouraging Physician Buy-in Two features attracted physicians to the EMR: increased productivity and protocol override. Increased productivity Physician use of the automated Diabetes Work Sheet bumped up a typical outpatient visit from Level 1 to Level 4,16 allowing physicians to document and appropriately bill $75 for a visit instead of $35. (Use of the Work Sheets, shown in Exhibit 12, also boosted a patient’s abilities to self-manage and reduced the incidence and prevalence of diabetes-related complications.) Additionally, entering data into the system during a patient consult meant that fewer resources were spent on transcription. In one study, a group of six physicians decreased their average transcription cost per relative value unit (RVU) from $2.50 to $.20.17 Clinical note-taking was facilitated by the default options on each screen which represented the most common care strategy. Override capability James’ vision for the PCMS hinged on the idea that one “designed for the common and managed the uncommon cases individually.”18 He clarified, “No protocol fits every patient, and no protocol perfectly fits any patient.” All physicians were granted override capability; if they did not want to follow the recommended orders automatically generated for a particular patient, they were prompted to type their reason for varying into the system. IHC designed this function not as a way to track instances of physician “disobedience” but to learn from exceptions. There were two options for variation from the protocol: the protocol was wrong and it should be modified; or the protocol was correct but the patient presented with significant complications so the protocol was not applicable. To James, the latter situation was “random noise.” Realizing the Benefits of Clinical Management By the mid-1990s, IHC clinical-improvement projects routinely showed significant cost savings, but system administrators kept complaining that they were not seeing concomitant improvements in their operating budgets; net operating income was not improving, even though documented cost reductions suggested that they should be. The puzzle was resolved when James was preparing results of a new protocol for community acquired pneumonia (CAP). (See Exhibit 14.) For the first time, James ran reimbursement as well as cost figures and found that if a CAP patient had a major complication, it changed their DRG. The most common switch was from DRG 89 (uncomplicated CAP) to DRG 475 (ventilator support). DRG 475 paid about $16,400 per case; by contrast, reimbursement for DRG 89 was $4,600, with an average real cost to the facility of $5,400. The protocol saved money by changing physicians’ choice of antibiotics to treat CAP, resulting in significantly lower complication and mortality rates. While costs had dropped by about $1.2 million, Medicare reimbursement, secondary to the shifts in DRG categories, had dropped by almost $1.7 million. James presented this finding—outstanding clinical outcomes and distressing financial news—to IHC’s top 25 managers. He remembered: I took them down through all the clinical changes, how the protocol worked, change in complication and mortality rates, the cost data and, finally, the reimbursement data. Then I 16 The workload associated with a consultation was graded into four levels based on a relative value scale. For more detail see W.C. Hsaio, “The Resource-Based Relative Value Scale: Toward the development of an alternative physician payment system.” Journal of the American Medical Association 258(6), (1987): 799–802. 17 S.D. Narus, and P. D. Clayton, “Clinical Information Systems at Intermountain Health Care,” Decisions in Imaging Economics, Special Projects Supplement, February 2002. 18 Institute of Medicine, Crossing the Quality Chasm (National Academy Press, 2001) p. 128. 13 Purchased by Chris Mitchell ([email protected]) on January 21, 2013 603-066 Intermountain Health Care apologized, basically. It turned out all the savings floated back to CMS, leaving us holding the bag for the cost of the project and a net loss of [Medicare] reimbursement. Bill Nelson, our CEO, publicly chastised me for apologizing, but it’s one of the few times that it felt good to be scolded. He said, “You will not apologize for better patient outcomes.” What he was really doing was using this to deliver a message to the rest of the managers. Bill said, “I expect clinical management like that to be done. It’s our job as administration to figure out how to balance the finances.” Building on that initial experience, IHC developed three strategies by which the clinical management system could harvest savings back from payers and boost revenues: (1) picking projects based on their ability to bring back savings to the health care provider; (2) contracting strategies to insurers that sold on the basis of true price, not discount; and (3) “shared benefit” contracts under which IHC Health Services (the delivery organization), IHC Health Plans (the payer), and Clinical Program physicians equally split quality-derived savings. James explained: The first strategy is not very attractive—you end up leaving too many good projects on the table. Under the second strategy, you start to sell [health care delivery services to insurers] on the basis of true price, not on the size of the discount. In most commercial medical markets in the country today, you get the contract based on the size of your discount. In essence, you tell a purchaser, �Last year we gave you a 9% discount from billed charges. This year, we propose to give you only a 7% discount—but because of our clinical improvement, you will still be ahead financially.’ The third strategy is the best of all, because all of the key players have some skin in the improvement game. In 1999, Burton and Sidney Paulson, Health Plans CEO, piloted the third strategy as a three-way risk and benefit-sharing arrangement between physicians, IHC, and the insurer if a given clinical program came in below their actuarial projections by demonstrating improvements in care.19 However, the physician population was wary of the proposal: while IHC originally proposed that the physicians, as a group, accept 20% of the risk, the physicians ultimately accepted a smaller upside benefit to avoid any direct downside risk. The health plan and IHC Health Services split the downside risk evenly. James estimated that within the Primary Care Clinical Program pilot, the annual payout per physician was about $3,000. James anticipated expansion of risk sharing to specialty physicians as they implemented the outcomes tracking system. In 2002, IHC’s senior management began “marketing” Clinical Integration and its shared-benefit cost models to their larger insurance partners. Prior to that, it had been used only for the health plans’ large employer segment—large, self-insured employers who purchased all insurance services through IHC Health Plans. The Long-term Plan Reflecting on the Clinical Integration meeting and the nurse's alarm about standardizing care, James realized that he had been hosting an internal debate on this topic for years. Would physicians adopt best practices on their own, or must best practice be paired with measurement and accountability systems? In addition to thinking about incentives, about what constituted “best practice,” and about how to develop systems that would simultaneously increase the quality of care and decrease cost, James listed progress on the implementation of the clinical care management system. In mid-2002, five of the Clinical Programs (CV, Neuromusculoskeletal, Women & Newborn, 19 The shared benefit approach routed distribution of the savings through the insurance arm of the organization—IHC Health Plans—so that the final approach could meet federal fraud and abuse standards. 14 Purchased by Chris Mitchell ([email protected]) on January 21, 2013 Intermountain Health Care 603-066 Oncology, and Primary Care) were in use; the remaining four would be up by 2007. Four of 500 conditions (acute myocardial infarction, bronchitis, CAP, and total hip replacement) in the PCMS were running, albeit on paper. The IT department hoped to have 35 conditions charted by the end of 2002 and 75 by the end of 2003, at which point the PCMS would go live. James realized that it would take at least ten years to fully consolidate the clinical management structure and get all components of Clinical Integration running; however, that period was negligible compared to how long it would take to get IHC’s physicians to subscribe to the concept. He commented: Dr. W. Edwards Deming once said, “If you want to convert the culture of an organization, and that organization contains n people you first need to convert the square root of n.” Well, he should have added, “You specifically need the early adopters.” It’s not just any square root of n. I’ve got about 1,200 core physicians, so the square root is somewhere between 30 and 40. There was a palpable change in the medical staff when we crossed that number. It wasn’t just Brent James, partially tainted by being over in the administration offices, saying that physicians as a profession needed to do this. It was a long list of respected physicians who could say, “Guys, I’ve done this in my practice and it really makes sense. It’s better care for our patients, a better lifestyle for me, and more productive.” 15 Purchased by Chris Mitchell ([email protected]) on January 21, 2013 603-066 Exhibit 1 Intermountain Health Care Intermountain Health Care: Insurance IHC Health Plans IHC entered the insurer market in 1983 at the behest of Dr. David Burton, an internal medicine doctor leading a private emergency medicine group that covered Cottonwood and AltaView Hospitals. While running the group, he anticipated the role insurance companies were going to come to play in the United States. Burton presented a business plan pro forma to the board and IHC management to start IHC Health Plans and was appointed CEO for its first three years of operation. In 2001, IHC offered five traditional HMO health plans. Three of the plans were available as a POS-HMO (Point of Service) option under the PLUS moniker. The POS was similar to a Preferred Provider Organization (PPO), a form of health insurance in which the enrollee paid a higher premium and had to meet a larger deductible in exchange for access to an expanded set of physicians. By contrast, enrollees in the traditional HMO paid less for a basic and more restrictive package of health care services. IHC Med, a traditional HMO (also available as Med PLUS), was touted as the most economical plan with a 600-physician panel of PCPs and specialists. SelectMed and SelectMedPLUS featured 1,500 PCPs and specialists. IHC Care (also available as IHC Care PLUS) was a large panel HMO with a network of 2,600 PCPS and specialists. There was a step-wise increase in the out-of-pocket cost—and a pool of physicians from which to choose—from IHC Med to SelectMed to IHC Care. Health Choice was a nonpanel option that allowed enrollees to receive care outside the panel at a lower level of coverage. IHC Access was for Medicaid enrollees who were required to select a physician from a set provider list. The Health Plans boasted a longer tenure per enrollee (5–6 years average) compared to a national average of 1–2 years. Competition In 2001, IHC Health Plans enrolled 40% of the insured population of Utah. Blue Cross Blue Shield, Altius, and United HealthCare were the other major market players with 425,000, 180,000, and 150,000 enrollees respectively. A second tier of smaller insurers included Public Employees (85,000 enrollees), Educators (73,000), CIGNA (60,000), Mailhandlers (52,000), Aetna (48,000), and Deseret Mutual (45,000). Beyond the second tier were many smaller insurers with fewer than 20,000 enrollees; most enrolled fewer than 10,000. IHC management wanted the Health Plans to maintain a 40%–60% market share of the insured population. Pricing of the insurance product Consistent with their nonprofit status the Health Plans maintained break-even prices against which second tier insurers could compete and were willing to accept a loss in the short-term in order to be a permanent player in the Utah insurer market. As a consequence, the Health Plans forced their competitors’ prices down. The Health Plans aimed to encourage competition based on quality, not cost, in order to create a positive pressure to raise the standard of health care. Source: Casewriter. 16 Purchased by Chris Mitchell ([email protected]) on January 21, 2013 Intermountain Health Care Exhibit 2 603-066 The Population of Utah in 2000 Utah 2,269,789 1.6% 29.6% United States 284,796,887 1.2% 13.1% Persons under 5 years old Persons under 18 years old Persons 65 years old and over 9.4% 32.2% 8.5% 6.8% 25.7% 12.4% White personsa Black or African American personsa American Indian and Alaska Native personsa Asian personsa Native Hawaiian and Other Pacific Islandera Persons reporting some other racea Persons reporting two or more races Persons of Hispanic or Latino originb White persons, not of Hispanic/Latino origin 89.2% 0.8% 1.3% 1.7% 0.7% 4.2% 2.1% 9.0% 85.3% 75.1% 12.3% 0.9% 3.6% 0.1% 5.5% 2.4% 12.5% 69.1% Female persons 49.9% 50.9% High school graduates and higher, persons 25 years and over Bachelor’s degrees and higher, persons 25 years and over 87.7% 26.1% 80.4% 24.4% Housing units Homeownership rate Households Persons per household Households with persons under 18 768,594 71.5% 701,281 3.13 45.8% 115,904,641 66.2% 105,480,101 2.59 36.0% Median household money income, 1997 model-based estimate Persons below poverty, 1997 model-based estimate Children below poverty, 1997 model-based estimate $38,884 10.0% 12.5% $37,005 13.3% 19.9% 1,600,279 69.0% 65.3% 5.0% 31.0% 217,168,077 63.9% 59.7% 5.8% 36.1% Population, 2001 estimate Population, percent change, April 1, 2000–July 1, 2001 Population, percent change, 1990 to 2000 Employment Status Population 16 years and over In labor force Employed civilian labor force Unemployed civilian labor force Not in labor force Sources: U.S. Census Bureau: State and County QuickFacts. Data derived from Population Estimates, 2000 Census of Population and Housing, 1990 Census of Population and Housing, Small Area Income and Poverty Estimates, County Business Patterns, 1997 Economic Census, Minority- and Women-Owned Business, Building Permits, Consolidated Federal Funds Report, 1997 Census of Governments, available at <http://quickfacts.census.gov/qfd/states/49000.html>, accessed July 30, 2002; U.S. Census Bureau, Census 2000 Summary File 3, Matrices P30, P32, P33, P43, P46, P49, P50, P51, P52, P53, P58, P62, P63, P64, P65, P67, P71, P72, P73, P74, P76, P77, P82, P87, P90, PCT47, PCT52, and PCT53, available at <http://factfinder.census.gov/bf/_lang=en_vt_name=DEC_2000_SF3_U_DP3_geo_id=01000US.html>, accessed September 25, 2002. a Includes persons reporting only one race. b Hispanics may be of any race, so also are included in applicable race categories. 17 Purchased by Chris Mitchell ([email protected]) on January 21, 2013 603-066 Exhibit 3 Intermountain Health Care IHC’s Clinical Information System Note: Cylinders represent databases. All inpatient and outpatient clinical information resided together in the IHC Clinical Data Repository (CDR, or “lifetime patient record”). The CDR included a series of key sub-functions essential to the operation of an EMR, such as an electronic master patient index (EMPI), and a database of shared field definitions (the Vocabulary Server, or VOCSER). These data interacted with medical knowledge—compiled from the medical literature, physician consensus, and best practice guidelines and protocols—to provide real-time clinical decision support in applications such as the Antibiotic Assistant. An electronic data warehouse (EDW) pulled together all clinical data, as well as financial transaction data, insurance claims data, patient outcomes data, and all other information used across the entire enterprise, into condition-specific data marts. The data marts, in turn, generated clinical and administrative management information to drive management within the IHC system. In effect, the CDR was the core information resource for the whole system, and HELP (inpatient), Clinical Workstation (outpatient), and Results Review were tools used to view and update that shared resource. Source: Intermountain Health Care. 18 Purchased by Chris Mitchell ([email protected]) on January 21, 2013 Intermountain Health Care Exhibit 4 603-066 Performance Improvement Outcome Data Savings from Clinical Projects, 1995 Clinical Project Fast-track extubation in TICU Long-term ventilator management HFOV (RDS in premature newborns) Shock Trauma Respiratory ICU (12 protocols) Antibiotic Assistant Pediatric ICU (8+ protocols) Infection prophylaxis in surgery Adverse drug event prevention Community-acquired pneumonia Ventilator support for hypoxemia Group B strep sepsis of newborn Subtotal + 30 additional successful clinical projects without cost savings analysis Cost structure improvement, ($ millions) $5.5 4.7 3.7 2.5 1.2 .7 .6 .5 .5 .5 .3 20.7 ? Source: Intermountain Health Care. 19 Purchased by Chris Mitchell ([email protected]) on January 21, 2013 603-066 Exhibit 5 Intermountain Health Care Referral Care Clinical Programs IHC Referral Care Clinical Programs as percent of hospital cost Clinical Programa Cardiovascular Neuromusculoskeletal Surgical Specialties Women and Newborn Medical Specialties Pediatric Specialties Behavioral Health ICU + Trauma Unassigned Total Hospital inpatient and outpatient cost $129,442,947 128,675,965 116,646,327 114,984,231 94,773,645 44,552,204 17,185,283 31,079,870 22,759,375 700,099,847 % of total cost 18.5 18.4 16.7 16.4 13.5 6.4 2.5 4.4 3.3 100 Cumulative % 18.5 36.9 53.6 70.0 83.5 89.9 92.3 96.7 100 100 a Note: the 9th clinical program was for Primary Care medicine, the domain of general practitioners. Based on 1997 Case Mix Database; cost data organized by APR-DRG. Cardiovascular Clinical Program Family of Processes Process Ischemic heart disease CABG et al. Dx cath, PTCA, stents, etc. Acute chest pain Congestive heart failure Valves CHF Transplant Arrhythmias/ pacemakers Peripherial vascular surg Resp Ca/ pulmonary surg Other Cardiovascular Total Hospital inpatient and outpatient cost % of Total cost 106-108, 110-111 112, 124-125 121-123, 132-133, 140, 143 $34,228,066 24, 213,792 9,293,639 28.9 20.5 7.9 28.9 49.4 57.2 104-105 87, 127 103 116-118, 129, 138-139, 141-142 5, 130-131, 478-479 75-77, 82-84, 94-95 120, 126, 135-136, 144-145 -- 13,417,746 5,348,209 4,243,428 9,015,295 11.3 4.5 3.6 7.6 68.5 73.1 76.7 84.3 8,374,590 7,343,294 2,879,647 7.1 6.2 2.4 91.4 97.6 100 118,857,706 100 100 DRGs Source: Intermountain Health Care. 20 Purchased by Chris Mitchell ([email protected]) on January 21, 2013 Cumulative % Intermountain Health Care Exhibit 6 603-066 Guidance Council Structure Clinical Integration Executive Team Everybody !Sr VP - hospitals, clinics, MDs !Clinical Program leaders !Finance !Senior admin execs !support staff Development Team Core Work Group Clinical Program Guidance Council !Clinical Program MD leader (+ 1/4 FTE) !Nurse administrator !Info Systems ! regional Clinical Program !Finance MD, nurse admin leaders !support staff ! regional administrators !Cardiovascular !Neuromusculoskeletal !Women & Newborn !Primary Care !Oncology Urban North Region Urban Central Region Urban South Region !Medical director (1/4 FTE) !Medical director (1/4 FTE) !Medical director (1/4 FTE) !Nurse administrator (full time) MDs MDs MDs !Nurse administrator (full time) MDs MDs MDs !Nurse administrator (full time) MDs MDs MDs Source: Intermountain Health Care. 21 Purchased by Chris Mitchell ([email protected]) on January 21, 2013 603-066 Exhibit 7 Intermountain Health Care Clinical Protocol for Cardiovascular Care 22 Purchased by Chris Mitchell ([email protected]) on January 21, 2013 Intermountain Health Care 603-066 Exhibit 7 (continued) Source: Intermountain Health Care. 23 Purchased by Chris Mitchell ([email protected]) on January 21, 2013 603-066 Intermountain Health Care Exhibit 8 Protocol for Discharge Medication 2000 Hospital Discharge Medicine Goals: Patients discharged from the cardiovascular (or main medical) unit(s) achieve at least 90% compliance with appropriate discharge medications: 1. 2. 3. Ischemic Heart disease (aspirin, HMG agent; beta blocker post-Myocardial Infarction (MI)) Heart failure due to Left Ventricular dysfunction (ACE inhibitor) Atrial fibrillation (Coumadin) Percent eligible patients treated at discharge with appropriate medications, 2000 Before After National protocol protocol rate Beta blockers 57% 91% 41% ACE/ ARB inhibitors 63 94 62 Statins 75 95 37 Antiplatelet 42 99 70 Wafarin 10 90 <10 Mortality and Readmissions within one year of discharge Mortality Readmissions Before After Before After protocol protocol protocol protocol Chronic Heart Failure 22.7% 17.8% 46.5% 38.5% (n=19,083) Ischemic Heart Disease 4.5 3.5 20.4 17.7 (n=43,841) Source: Intermountain Health Care. 24 Purchased by Chris Mitchell ([email protected]) on January 21, 2013 Intermountain Health Care 603-066 Exhibit 9 CAP Outcomes Tracking Implementation Group -- Loose Abx Compliance 0.8 Proportion compliant 0.8 Baseline Implementation 0.7 0.7 0.6 0.6 0.5 0.5 0.4 0.4 0.3 0.3 0.2 0.2 0.1 0.1 0 0 -23 -21 -19 -17 -15 -13 -11 -9 -7 -5 -3 -1 1 3 5 7 9 11 13 15 17 Month relative to CPM implementation P chart - 0.01 control limits Source: Intermountain Health Care. 25 Purchased by Chris Mitchell ([email protected]) on January 21, 2013 603-066 Exhibit 10 Intermountain Health Care Parallel Administrative Structure Board of Trustees • • 28 members 6 annual meetings Administrative Executive Management Council • Operators, Senior Management, CFO, CEO, Senior Vice President, Regional Vice Presidents, Vice Presidents and division leaders Regional Operations Council • Regional clinical and administration teams; regional representatives from Finance, Health Plans, Quality Mgt, Nursing, IT, clinical MD- Nurse dyads Clinical Clinical Integration Executive Team • • Clinical Program Guidance Council • • • Clinical Program Administrative meetings • Physician and nurse administrator dyad meet with line administrators Review of current clinical performance, progress on goals, then discussion of strategies, plans, and resource allocation to address implementation issues around system-wide clinical program goals Monthly meetings • • Chairs of all clinical programs and IHC senior management Approve and transmit clinical program guidance council goals to Board of Trustees Clinical leadership dyad, development and implementation team leaders, and central support staff; system wide representatives from Finance, Health Plans, Quality Mgt, Nursing, IT, and administration, one of IHCDR’s masters-level statistician Coordinate data collection, program goals and budgets; report on system-wide clinical performance, review progress on goals. Development team leaders report on problems and progress within conditionspecific areas of clinical mgt. On an annual basis, identified opportunities for significant improvement in clinical, service, and cost outcomes and set annual goals Monthly meetings Regional Clinical Program Clinicians’ meetings • • • Clinical program regional medical director and nurse administrator dyad meet with practitioners at each site (clinic or hospital) Full review of current performance levels using real-time data from outcomes tracking system. Review progress towards clinical improvement goals, with a focus on front-line barriers to implementation Monthly or quarterly meetings Source: Casewriter. 26 Purchased by Chris Mitchell ([email protected]) on January 21, 2013 Intermountain Health Care Exhibit 11 603-066 2001 System Goals for Cardiovascular Clinical Program • Exceed national standards for timeliness of reperfusion for ST-Elevation MI’s • Prescribe appropriate hospital discharge medicines for CAD, heart failure, atrial fibrillation • Stabilize readmission rate after hospitalization for ischemic syndromes • Achieve CV surgical mortality rate lower than national standards • Achieve average extubation time after CV surgery of 7.5 hours or lower • Improve CV surgical costs • Implement evidence-based indications/ guidelines for 13 CV procedures • Inpatients with heart failure document LV ejection fraction and provide diet, smoking cessation, weight, and medication management instructions Source: Intermountain Health Care. 27 Purchased by Chris Mitchell ([email protected]) on January 21, 2013 603-066 Exhibit 12 Intermountain Health Care Examples of Clinical-Care Management Intervention Source: Intermountain Health Care. 28 Purchased by Chris Mitchell ([email protected]) on January 21, 2013 Purchased by Chris Mitchell ([email protected]) on January 21, 2013 1 • • • • • Level 1 (Formal) encoding Stores entire medical record; encoding superfluous Paper records scanned or entered into the system by dictation and transcription Uses “hot-text,” or standardized keywords Electronic filing cabinet High priority disease management Diabetes Work Sheets – check individuals’ progress against set criteria Level 2 encoding Some free-text necessary to capture detail on patients’ social situations Automated clinical support services: Practitioner performs simple orders that integrate patient-level data with “knowledge” stored in the system Includes a focused problem list for chronic diseases, common medications prescribed by the physician (“pick list”) patient allergies, screens for drug-drug interactions • • • • • • EMR - Encoded patient demographic data Automated scheduling and billing Clinical support services include: pharmacy operations (already fully encoded), clinical laboratory (pathology, microbiology, and surgical pathology) data, imaging (both digital including image storage and reporting), and consultation reports Data entered as free text or fully encoded data (a hindrance to encoded data was the lack of standardization of syntax (named fields and order of fields) and semantics (which defined the content of a field)) 4 5 6 Level 3 encoding - Fully encoded IHC and most HC delivery organizations have long achieved this step 3 EMR Roll-out Source: Casewriter 2 Exhibit 13 603-066 -29- 603-066 Intermountain Health Care Exhibit 14 Community Acquired Pneumonia Protocol Compliance, 1994–1995 Percent patients admitted Average length of stay (days) Time to antibiotic (hours) Average cost per case ($) 1994 Before protocol 39 6.4 2.1 2,752 1995 With protocol 29 4.3 1.5 1,424 Source: Intermountain Health Care. 30 Purchased by Chris Mitchell ([email protected]) on January 21, 2013
© Copyright 2026 Paperzz