星の重力崩壊に伴う爆発的天体現象
2008.12.15-17 理論懇シンポ@NAO
東理大 理工 鈴木英之
H
He
ONeMg
CO
Fe
Si
M>8M
'
!
"
#
$
%
&
重力崩壊型超新星爆発
3
14
超新星コア中心部 (T ∼ 10MeV, ρ >
∼ 10 g/cm )
• コア中心部 τweak ¿ τdyn ニュートリノトラッピング
ν も熱平衡、化学平衡、nν ∼ nγ ∼ ne
平均自由行程 λν À λγ , λe , λN ⇒ ニュートリノ輸送が重要
• 一般相対論
• 有限温度高密度物質の状態方程式とニュートリノ反応
VC(r) [MeV]
空構造とクォーク力
つの大きな枠組みで統一的に理解・解決される。こ
力、核力と原子核構
宇宙に於ける重元素合成のメカニズムの解明という
100
1
600
天体現象、爆発的天
S
3 0
の解決に繋がるだけでなく、物質構造を複数の階層
S1
500
OPEP
重層的な物質構造を、
50
て統一的に研究・理解するという全く新しい研究方
400
的技法を最大限活用
ケース を与えることになる。
300
0
つ分野融合型の新し
200
術的背景:近年の計算機の急速な発展とそれに伴う
-50
の研究により、今ま
100
0.0
0.5
1.0
1.5
2.0
精密化は、例えば、領域代表者らの研究グループに
0
物質の起源に関する
による核力ポテンシャルの計算」という画期的
0.0
0.5
1.0
1.5
2.0
解・解決される。こ
r [fm]
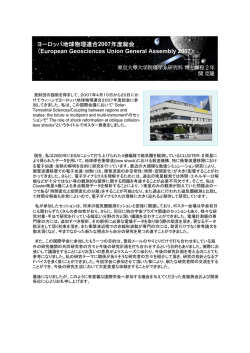
を打ち出した 。図 の上は散乱実験の結果から構
ニズムの解明という
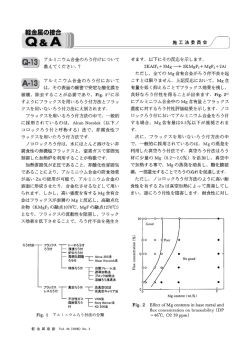
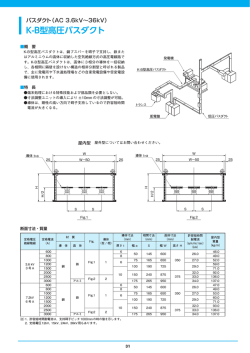
核力ポテンシャル:現象論的モデルと格子
QCD の計算結果
象論的核力ポテンシャルであり、下は格子
の数 図
上:現象論的核力ポテンシャ
質構造を複数の階層 N. Ishii, S. Aoki and T. Hatsuda, Phys. Rev. Lett. 90 (2007) 022001
ーションによって理論的に計算されたものである。更
ル。下:格子
による核力ポ
う全く新しい研究方
はもちろん必要であるが、格子
の結果は期待 テンシャル。
平成 20-24 年度新学術領域科研費
ポテンシャルの定性的性質を良く再現している。こ
「素核宇宙融合による計算科学に基づいた重層的物質構造の解明」
な発展とそれに伴う
クォーク間の力学である
から、クォークの束縛
らの研究グループに
核子の間のポテンシャルという1つ上の階層の相互作用を導きだしたものであり、計算
A01 量子色力学に基づく真空構造とクォーク力学
計算」という画期的
無しには有り得なかったものである。その重要性は、この論文がネイチャーの2007
乱実験の結果から構
A02 クォーク力学に基づく原子核構造。ここで示された「基本的な物質
ト研究21件の1つに選ばれたことにも現れている
、下は格子
の数 図
上:現象論的核力ポテンシャ
からより上の階層の複雑な相互作用を導く」ということの必要性・重要性は、科学の多
A03
クォーク力学・原子核構造に基づく爆発的天体現象と元素合成
れたものである。更 ル。下:格子
による核力ポ
認められているが、その難しさからなかなか実現されていないのが実状である。そこで、
鈴木英之、研究分担者:
柴田大、梶野敏貴、住吉光介、梅田秀之
の結果は期待 テンシャル。
をきっかけにして、計算科学という新しい手法を用いて物質の異なった階層の性質を統
連携研究者: 大西明、山田章一、瓜生康史、千葉敏、岩本信之、吉田敬、親
く再現している。こ
・理解するという新しい研究分野の構築を着想するに至ったわけである。
松和浩、鷹野正利
ら、クォークの束縛
研究目的:(1)格子
に基づいたハドロン相互作用の理解、特に核子間相互作用、
1つ上の階層の相互作用を導きだしたものであり、計算
A04 分野横断アルゴリズムと計算機シミュレーション で決められた
トレンジクォークを含んだ一般的なバリオン間相互作用の決定、
ある。その重要性は、この論文がネイチャーの2007
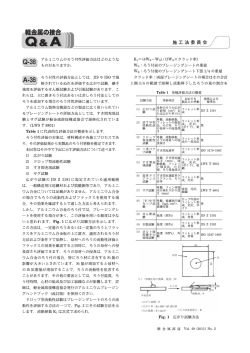
宇宙の観測
• 電磁波: すばる望遠鏡など
金属欠乏星の元素組成 → 個々の超新星の元素合成
• ニュートリノ: Super-KAMIOKANDE など
→ 天体現象モデル、核物質の性質
• 重力波: LIGO など
→ 天体現象モデル、核物質の性質
• 宇宙線: TA, Cangaroo など
高密度物質の状態方程式・原子核構造モデル・反応率
m
⇑
天体現象モデルの構築
数値シミュレーション
爆発的天体現象
元素合成
⇐⇒
観測データ
元素組成,ニュートリノ,重力波
1
SN1987A 以前
• ∼1930 年代
中性子の発見、中性子星のアイデア、
重力崩壊による超新星爆発と中性子星形成のシナリオ (Baade and Zwicky)
• 1960∼70 年代
数値シミュレーションによる重力崩壊型超新星爆発の研究
(Colgate、Arnett、Wilson ら)
バウンスによる衝撃波形成とニュートリノによるエネルギーデポジット
• 1970∼80 年代
弱い相互作用における中性カレントの発見、
超新星コアにおけるニュートリノ閉じ込め (佐藤、Mazurek)、
ニュートリノ輸送 (MGFLD まで) を考慮した 1D(球対称) 数値シミュレーショ
ン
Prompt Explosion or Delayed Explosion(Wilson)?
原始中性子星の冷却 (Burrows and Lattimer)
状態方程式 (EOS)、ニュートリノ反応、一般相対論、対流、磁場 (2D) の影響
Prompt explosion (Hillebrandt, Nomoto and Wolff 1984). MMS = 9M¯
Failed Prompt explosion (Hillebrandt 1987). MMS = 20M¯
Wilson’s Delayed explosion model (Colgate 1989).
SN1987A
星の進化,重力崩壊型超新星爆発、超新星ニュートリノに関するモデルの大枠が正
しいことが確認された
2
SN1987A 以降
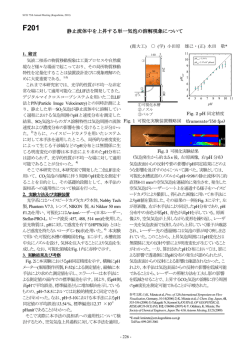
非球対称性の観測
• 偏光観測 polarization
• 物質混合 mixing (large vFe > 3000km/sec(Fe II IR line), early detection of
X-ray, 847keV/1238keV 60 Co line), slow H velocity (∼ 800km/sec)
• asymmetric image
⇒ 流体不安定性、回転、磁場
HST image of SN1987A on 1994.2 and 2003.11.28
(Janka 1997)
gain radius: 正味のニュートリノ加熱率 (加熱 − 冷却)=0
• 原始中性子星内部 (∼ neutrinosphere 内部) での不安定性
• 衝撃波と neutrinosphere 間における不安定性
PNS Convection: convection inside the proto neutron star:
hot lepton-rich material deep inside → surface/neutrinosphere
→ Lν %, neutrino heating in the hot bubble %
• Wilson’s Delayed explosion model
dYL
neutrinosphere 内部での neutron finger( dS
>
0,
dr
dr < 0, Ledoux stable but
τS < τYL ) による対流を考慮しないと、ちゃんと爆発しない。
• Bruenn et al., 95,04: τS > τYL no neutron finger
inward flow of ν̄e transports YL outward
• Buras et al., 03: Ledoux convection is too deep to increase Lν
machanism/effects of PNS convection is still controversial
2D hydro with radial-ray
(1D) ν transfer(SGFLD)
NR
NR
Φ = ΦGR
+
(Φ
−
Φ
1D
2D
1D )
YL -driven convection evolves
(whole PNS)
Lν % factor 2,
hων i % factor 1.1-1.2
Fν angular variation 5∼10%
⇒ vkick ∼ 10km/s ¿ vPSR
Keil, Janka and Müller, ApJ 473 (1996) L111, Fig.3
Postshock Convection: 衝撃波と neutrinosphere 間における不安定性
1. 超音速で落下する物質 (原子核)
1000
3. ゆっくりと落下: Rshock > r > Rgain
(νe n → e− p, ν̄e p → e+ n による加熱)
4. gain radius を通過: r < Rgain
(ニュートリノ放出により冷却)
heating rate [erg/g/s]
2. 衝撃波面を通過 (A → np)
0
-1000
-2000x10
18
10
100
1000
radius [km]
5. 原始中性子星の上に降着
重力エネルギー ⇒ ニュートリノ放出
Sumiyoshi et al., ApJ629(2005)922 Fig.7
dS/dr(Rgain < r < Rshock ) < 0: S-driven = ν-driven convection
対流が、Rgain で暖められた物質を、ニュートリノ放出 (∝ T 6 , T 9 ) によって
冷えてしまう前に衝撃波面へ運ぶ。
accretion による Lν の維持と、外向きの運動の両立
Burrows, Hayes and Fryxell 1995 (2D + radial-ray ν tr.)
本質的な爆発機構かどうかは不明
Sensitivity to Neutrino Heating Rate
FIG. 1.—Explosion energies vs. time after the start of the simulations (125
ms after bounce) for exploding one-dimensional (dotted lines) and twodimensional models (solid lines). The numbers denote the initial n e and n̄ e
luminosities in 10 52 ergs s 21 .
1D/2.10: no exp. ⇔ 1D/2.20: exp.
(Janka and Müller, ApJ 448 (1995) L109, Fig.1)
球対称ニュートリノ輸送計算の進歩
• FLD (Flux Limited Diffusion)
Max-Planck, Burrows ’80s
nν (t, r), uν (t, r)
Fν
cΛν ∂uν
= −
=
3 ∂r
{
− cλ3ν
cuν
∂uν
∂r
diffusion(λ → 0)
free streaming(λ → ∞)
• MGFLD (Multigroup FLD) Scheme
Wilson, Bruenn, Suzuki ’80-’90s
dnν
(t, r, ω)
dω
ニュートリノ加熱率を過小評価 (Yamada et al.97)
⇓
• Boltzmann solver (Mezzacappa, Burrows, Janka, 住吉・山田
fν (t, r, ω, µ) 球対称の輸送方程式を直接解く
>
∼
2000)
Opacity: ニュートリノ反応率
3
3
D
10
2
C
10
10
Radius [km]
B
radius [km]
Newton+O(v/c)
Relativistic
A
1
2
10
1
10
0
0.05
0.1
time after bounce [ms]
10
0.15
0
mistake: σ(νN → νN) too small ⇒ Explosion!.
Liebendörfer et al., astro-ph/0006418 v1 Fig.4
Neutrino Interactions (standard:
e− p ←→ νe n e+ n ←→ ν̄e p
e− e+ ←→ ν ν̄ plasmon ←→ ν ν̄
νN −→ νN
νA −→ νA
0.1
0.2
0.3
Time After Bounce [s]
0.4
0.5
No Explosion!. NH 13M¯ , GR Boltzman, LS
EOS+Si burning, S = 103, E = 12, A = 6, 3ν
GR→ compact PNS → T % Lν %,
Boltzmann → heating rate %
Liebendörfer et al., Phys.Rev.
D63 (2001)
103004 (astro-ph/0006418 v2) Fig.6
Bruenn’85)
e− A −→ νe A0
NN −→ NNν ν̄
νe± −→ νe±
e+ A −→ ν̄e A0
νe ν̄e ←→ νx ν̄x
νν 0 −→ νν 0
反応率の精密化
• 核子制動輻射 NN0 ←→ NN0 ν ν̄
Suzuki and Ishizuka: One Pion Exchange model
νx ν̄x 生成: ρ > 1013 g/cm , T ∼ 10MeV で低エネルギーν に対して e− e+ →
νx ν̄x を上回る。
3
低エネルギーニュートリノを enhance Lνx %、hωνx i &
一方 multiple scattering suppression (Raffelt and Seckel 1991) は低エネル
ギーニュートリノの核子制動輻射を抑制
(Hannestad and Raffelt, Raffelt and Seckel 1998, Shen and Suzuki, Burrows
et al. 2000)
• down scattering (νe− → νe− , νA → νA∗ ) により、ων &, S % → λν %
YL,trap &, Eshock &
• ion screening (Horowitz 1997, Bruenn and Mezzacappa 1997)
Coulomb effect → ions in correlated states
σ(νA → νA) decreases when the wave length of neutrinos > ion seperation
3
• νN 散乱によるエネルギー交換: ρ > 1011 g/cm , ων > 10MeV で ES を上回り
hωνx i &
• νNN 散乱によるエネルギー交換: νN 散乱の影響に埋もれる
• νN ↔ eN0 に対する weak magnetism (← 核子の異常磁気モーメント):
σν̄e p (20MeV) : −15%
• νe ν̄e ↔ νx ν̄x , νν 0 −→ νν 0 ⇒ hωνx i ∼ hων̄e i
• 多体効果 effective mass, nucleon density/spin fluctuations
⇒ reduction of opacity → Lν %
(Sawyer 1995, München group 1995-1998, Burrows and Sawyer 1998-1999,
Reddy et al. 1998-1999, Yamada and Toki 1999-2000)
多体効果は状態方程式と密接に関連
• shell model に基づく新しい電子捕獲率/β 崩壊率の計算 (LMP: Langanke and
Martinez-Pinedo)
LMSH: N > 40 の原子核による電子捕獲率を評価
Bruenn’85: p(f7/2 ) → n(f5/2 ) の Gamow-Teller transition
N < 40: possible, N ≥ 40: impossible
Xp だけが重要ではない、電子捕獲率 %
YL trap &
有限温度高密度物質状態方程式 (EOS)
e.g. P (ρ, S, Ye ) for 流体の運動、T (ρ, S, Ye ), µi (ρ, S, Ye ) for ν 反応率
1. Wolff 数値テーブル (非相対論的 Hartree-Fock): 現在入手不可
< 1010−12.6 K, 106 < ρ < 1015 g/cm3 , 0.025 < Y < 0.525: 不十分
109−11 <
T
∼
∼
∼ B∼
∼ e∼
2. Shen et al. 1998: 数値テーブル
相対論的平均場理論 (n,p,σ, ρ, ω)
TM1 パラメーターセット (gρ , · · ·) ⇐ 不安定核を含む実験データ
一様物質相 (ρ >
∼ ρ0 ) と原子核相 (Thomas-Fermi 近似)
entries: ρB , nB , Ye , T , F , U , P , S, A, Z, M ∗ , Xn , Xp , Xα , XA , µn , µp
grids: 広い対応範囲
T = 0, 0.1 ∼ 100MeV
Ye = 0, 0.01 ∼ 0.56
3
ρB = 105.1 ∼ 1015.4 g/cm
∆ log T = 0.1
∆ log Ye = 0.025
∆ log ρB = 0.1
非圧縮率 Ks = 281MeV, 対称エネルギー Sv = 36.9MeV
3. Lattimer-Swesty 1991: FORTRAN サブルーチン (一般的に使用されてきた)
非相対論的液滴モデル: Ks = 180, 220, 375MeV, Sv = 29.3MeV
E/n ∼ −B + Ks (1 − n/ns )2 /18 + Sv (1 − 2Ye )2 + · · ·
3
7
>
対応範囲: T >
∼ 0.5MeV, ρB ∼ 10 g/cm , 0.03 < Ye < 0.55:
原始中性子星冷却計算には拡張が必要 ⇒ Ye = 0 を含むテーブルを作成
Wilson: パイ中間子によるソフト化?、大西グループ: ハイペロン、鷹野グループ: 変分法
Recent simulations with GR 1D Boltzmann ν-transfer(普通のコアは爆発しない)
Newton+O(v/c)
Relativistic
3
Radius [km]
10
2
10
Fig. 1.—Trajectories of selected mass shells vs. time from the start of the
simulation. The shells are equidistantly spaced in steps of 0.02 M,, and the
trajectories of the outer boundaries of the iron core (at 1.28 M,) and of the
silicon shell (at 1.77 M,) are indicated by thick lines. The shock is formed
at 211 ms. Its position is also marked by a thick line. The dashed curve shows
the position of the gain radius.
1
10
0
0.1
0.2
0.3
Time After Bounce [s]
0.4
0.5
NH 13M¯ , GR Boltzman, LS EOS+Si burning
Liebendörfer et al., Phys.Rev. D63 (2001) 103004
(astro-ph/0006418 v2) Fig.6
WW 15M¯ , MFe = 1.28M¯ , NR Boltzmann
(tangent-ray method), only νe ,ν̄e , without
e− e+ ↔ ν ν̄, LS EOS, Rampp et al., ApJ 539
(2000) L33 Fig.1
4
10
3
radius [km]
10
102
101
100
Fig. 5.—Radial position (in km) of selected mass shells as a function of
time in our fiducial 11 M model.
0.0
0.2
0.4
0.6
0.8
1.0
time [sec]
15M¯ , Shen EOS, Sumiyoshi et al., 2005.
NR 1D Boltzmann ν-transfer, Thompson et al.,
ApJ 592 (2003) 434 Fig.5
Boltzmann solver の比較
Fig. 5.—(a) Shock position as a function of time for model N13. The shock in VERTEX (thin line) propagates initially faster and nicely converges after its maximum
expansion to the position of the shock in AGILE-BOLTZTRAN (thick line). (b) Neutrino luminosities and rms energies for model N13 are presented as functions of
time. The values are sampled at a radius of 500 km in the comoving frame. The solid lines belong to electron neutrinos and the dashed lines to electron antineutrinos. The
line width distinguishes between the results from AGILE-BOLTZTRAN and VERTEX in the same way as in (a). The luminosity peaks are nearly identical; the rms
energies have the tendency to be larger in AGILE-BOLTZTRAN.
Liebendörfer et al., ApJ620(2005)840 Fig.5
状態方程式 (Lattimer-Swesty, Shen et al. など)、ニュートリノ反応率も、かつてよ
り標準化されてきた。
軽い ONeMg core + CO shell(1.38M¯ ) の弱い (O(1050 )erg) 球対称爆発
(Progenitor: Nomoto 8-10M¯ )
衝撃波面を通過する物質の密度の減少と CO-He 層境界の急激な密度勾配により、
衝撃波が進む。ν-wind と核燃焼による弱い爆発
ores (prompt explosions,
oups (Fryer et al. 1999).
ional
Fig. 1. Mass trajectories for the simulation with the W&H EoS as a
function of post-bounce time (tpb ). Also plotted: shock position (thick
solid line starting at time zero and rising to the upper right corner),
gain radius (thin dashed line), and neutrinospheres (νe : thick solid;
ν̄e : thick dashed; νµ , ν̄µ , ντ , ν̄τ : thick dash-dotted). In addition, the
composition interfaces are plotted with different bold, labelled lines:
the inner boundaries of the O-Ne-Mg layer at ∼0.77 M⊙ , of the C-O
layer at ∼1.26 M⊙ , and of the He layer at 1.3769 M⊙ . The two dotted lines represent the mass shells where the mass spacing between
the plotted trajectories changes. An equidistant spacing of 5 × 10⁻² M⊙
was chosen up to 1.3579M⊙ , between that value and 1.3765M⊙ it was
1.3 × 10⁻³ M⊙ , and 8 × 10⁻⁵ M⊙ outside.
Fig. 3. Velocity profiles as functions of radius for different postbounce times for the simulation with the W&H EoS. The insert shows
the velocity profile vs. enclosed mass at the end of our simulation.
Kitaura et al., AAp 450(2006)345
(Mezzacappa’07: 11.2M¯ モデルも核燃焼入れて 1sec くらいで爆発)
Nomoto et al., astro-ph/0308136
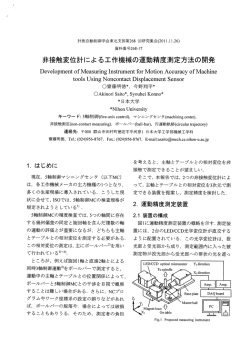
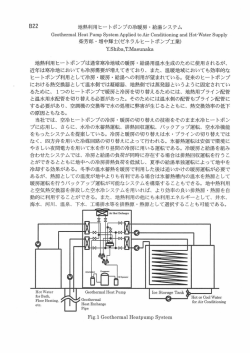
重いコアの球対称重力崩壊によるブラックホール形成とニュートリノシグナル
住吉,山田、鈴木、千葉
Fig. 1.—Radial trajectories of mass elements of the core of a 40 M star as a
function of time after bounce in the SH model. The location of the shock wave is
shown by a thick dashed line.
2x1053
luminosity [erg/s]
luminosity [erg/s]
2x1053
1
0
Fig. 2.—Radial trajectories of mass elements of the core of a 40 M star as a
function of time after bounce in the LS model. The location of the shock wave is
shown by a thick dashed line.
0.0
0.5
1.0
time after bounce [sec]
1.5
1
0
0.0
0.5
1.0
time after bounce [sec]
Progenitor 40M¯ , left: Shen EOS, right: Lattimer-Swesty EOS 180
1.5
ニュートリノ振動パラメターと SK での観測イベント予想。
Nakazato et al., Phys.Rev.D78:083014,2008
FIG. 8: Time-integrated total event number of failed supernova neutrinos for the normal mass hierarchy (left) and the inverted
mass hierarchy (right). Error bars represents the upper and lower limits owing to the different nadir angles. The upper and
lower sets represent models W40S and W40L, respectively.
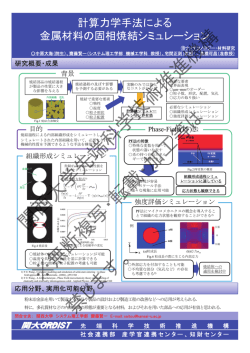
ハイペロン状態方程式 (石塚,大西による Shen EOS の拡張)
50
0
0
10
10
n
p
10
Σ−
Λ
-1
10
Λ
10-2
n
Σ
Ξ
10-2
α
10-3
Σ
Ξ
10
-4
10
+
Σ
0
Ξ
10
radius [km]
Σ0
0
5
20
20x10
10-5
53
2x10
Ξ0
−
-4
0
α
−
10-3
0
20
p
−
0
30
10
Lν [erg/s]
-1
10-5
< Eν > [MeV]
40
Σ+
10
radius [km]
20 5
20x10
Fig. 2.— Mass fractions of hyperons in model IS are shown as a function of radius at tpb =500
(left) and 680 ms (right).
Sumiyoshi et al., Astrophys. J. 690 (2009) L43-L46
1
0
0.0
0.5
1.0
1.5
time after bounce [sec]
Fig. 3.— Average energies and luminosities of νe (solid), ν̄e (dashed) and νµ/τ (dash-dotted)
for model IS are shown as a function of time after bounce. The results for model SH and LS
are shown by thin lines with the same notation.
有限温度高密度物質の状態方程式と球対称爆発的天体現象
• 格子 QCD 計算で得られたバリオン間ポテンシャルを用いた高密度物質の状
態方程式、特にクォークやハイペロンを含む有限温度の状態方程式や核構造
の情報 (電子捕獲反応率やニュートリノ原子核反応率) を用いた超新星爆発・
中性子星冷却・ブラックホール形成の数値シミュレーション
⇓
これらのハドロン物理が天体現象に及ぼす影響
観測プローブとなるニュートリノの振舞 (特に BH 形成時は ρ À ρ0 )
親星モデル (質量、金属量、物質混合モデルなど) などからくる不定性の範囲
放出される元素組成への影響
• 核統計平衡状態の状態方程式やニュートリノ反応率と高密度物質の状態方程
式の整合
再び、2/3 次元
2D/3D Hydrodynamics + さまざまなレベルのν-transfer
ニュートリノ輸送 fν (t, ~r, p
~ν ) (⇔ 球対称 f (t, r, pν , cos θν ))
τν (core) ¿ τdyn ⇒ 陰解法が必要
SASI: Standing Accretion Shock Instability
GR 効果は近似的
Blondin et al., 2003
停滞衝撃波と原始中性子星の間の領域で ` = 1, 2 などの不安定性が成長
(amplifying advective-accoustic cycle)
ニュートリノ加熱を助け軽いコアは弱い爆発?普通のコアは?
Accoustic Explosion?
Burrows et al., 2006
accretion → excitation of g-mode in PNS → sound wave
→ dissipation behind the shock front → robust explosion
↔ g-mode の振幅は小さいのでは?
自転/磁場? コアの角運動量は小さい? (Heger et al., 2005)
非等方ニュートリノ放出によるジェット状爆発
自転による対流不安定性の抑制
マグネター (B = 1015 G) 形成時は、磁場が効く
Janka et al.., 2006, 非回転 11.2M¯ 星の 2D 計算
⇒ weak explosion due to SASI+ν-heating
π
4
≤θ≤
3π
4
の計算は爆発せず、0 ≤ θ ≤ π の計算は爆発
l = 1, 2 の非対称性 (SASI) が発達 → kick velocity?
Figure 4: Four stages (at postbounce times
of 141.1 et
ms, al.,
175.2 ms,
200.1 ms, and 225.7 ms) during the evolution
エントロピー分布の時間発展。
Janka
astro-ph/0612072
of a (non-rotating), exploding two-dimensional 11.2 M⊙ model [12], visualized in terms of the entropy. The scale
is in km and the entropies per nucleon vary from about 5 kB (deep blue), to 10 (green), 15 (red and orange),
adv up to more than
heat
25 kB (bright yellow). The dense neutron star is visible as low-entropy ( < 5 kB per nucleon)
τ
%> τ
: SASI はν-heating を補助
500
400
300
200
100
0
100
200
300
400
500
north pole
south pole
0
100
200
300
time [ms]
400
500
600
50
40
30
20
10
0
50
40
30
20
10
0
entropy [kB /by]
radius [km]
Marek and Janka, 2007: 15M¯ SASI+ν 加熱で爆発しそう
Fig. 2.— Evolution of Model M15LS-rot. Left: Mass shells versus time. In this 2D simulation with rotation, the mass-shell lines mark the
radii that enclose certain values of the rest mass. The bold solid line indicates the (arithmetically) averaged shock position, the blue lines
represent the mean neutrinospheres of νe (solid), ν̄e (dashed), and heavy-lepton neutrinos (dash-dotted), the black dashed curve indicates
the mean gain radius, and the composition boundary between silicon shell and oxygen-enriched Si-layer at 1.42 M⊙ is highlighted by a red
dashed line. Dark grey denotes regions where the mass fraction of oxygen is larger than 10%, medium grey where the mass fraction of heavy
nuclei with mass numbers A ≥ 56 exceeds 10%, and light grey those regions where more than 30% of the mass is in α-particles. Right:
Radial positions of the shock near the north and south poles as functions of post-bounce time (white lines). The color coding represents
the entropy per nucleon of the stellar gas. The quasi-periodic, bi-polar shock expansion and contraction due to the SASI can be clearly
seen.
Marek and Janka, astro-ph/0708.3372 Fig.2
Blondin and Mezzacappa, astro-ph/0611680: 3D SASI (without ν-transfer) → NS spin?
Figure 1 | The evolution of the supernova accretion shock illustrates the rotation of the spiral mode of
the SASI. The blue portion of the shock surface represents the leading portion of the spiral SASI wave, seen
here propagating from right to left across the front face of the shock. The discontinuity between the blue and
white surfaces is the shock triple point marking the leading edge of the SASI wave. An animation of this
evolution is available in Supplementary Information.
Figure 2 | The flow in the equatorial plane of the spiral SASI mode drives accretion of angular
momentum onto the PNS. a, This diagram illustrates the shock structure and corresponding post-shock
accretion flow created by the spiral SASI wave. The location of the accretion shock is taken from the
equatorial plane of a three-dimensional simulation with the shock pattern (the SASI wave) propagating in a
clockwise direction. The leading edge of the internal SASI wave is marked by a shock-shock13: a shock wave
formed by the steepening of a pressure wave propagating along the inside surface of the accretion shock. This
shock-shock connects to the accretion shock at a triple point, seen as a discontinuity in the surface of the
accretion shock. In three dimensions this triple point is a line segment on the surface of the accretion shock
that spans roughly half the circumference, as seen in Fig. 1. b, The flow vectors highlight two strong
rotational flows. On the right the flow is moving clockwise along with the shock pattern, whereas at the
bottom left the post-shock flow is being diverted into a narrow stream moving anticlockwise, fuelling the
accretion of angular momentum onto the PNS.
Bruenn et al., astro-ph/0709.0537 Fig.2: 15M¯ NR 2D MGFLD(ray-by-ray plus)
ν-driven convection + SASI + O burning
Burrows: Accoustic Explosion ?
accretion → excitation of g-mode in PNS → sound wave
→ dissipation behind the shock front → robust explosion
Fig. 4.— Time evolution of the outer shock radius (in km) along the poles for the 11.2-M⊙ (black), 13-M⊙ (magenta), and 20-M⊙ (green)
models of WHW02. The radii extend from 2000 km to -2000 km.
ApJ 655(2007) 416 Fig.4
↔ g-mode の振幅は小さいのでは?
回転?
• Yamada and Sato 1994. 回転周期 & 遠心力 % ρbounce & Eshock &
• Shimizu et al. 1994,2001: asymmetric neutrino emission from the rotating
protoneutron star (deformed)
→ jet-like explosion Eshock %
球対称モデルと比べて、加熱率はあまり変わらないが、冷却率が下がっている。
FIG. 8.ÈPlots of the entropy distribution in time sequence for the model of l /l \ 1.05 and T \ 4.7 MeV ( facg10547) during the relatively early stages.
z x
l
The growth of the hot bubble is essentially the same as that of facg1247 (Fig. 6), except for slow evolution in this less anisotropic case.
FIG. 9.ÈSame as Fig. 8 ( facg10547), except at the late stages. Note the jetlike motion in the high-entropy hot bubble.
Shimizu et al., ApJ 552 (2001) 756, Fig.8,9
• Janka et al., 2001
2D Rotating PNS. (Janka et al., Lect.Notes Phys. 578 (2001) 333, Fig.14)
suppression of convective motion near the rotation axis. (Solberg-Høiland criterion
定化)
2
djz
: dx
が安
• Fryer and Warren, astro-ph/0309539 Fig.8
3D SPH, EIFLD, tree-based gravity algorithm → quick explosions
PNS 回りの shocked region では、回転により赤道面の対流が抑制される。
Takiwaki et al., 2004: 磁場と自転
Fig. 2.—Profiles of the shock propagation in the various models: B12TW2 at 60 ms from core bounce (top left), B10.5TW1 at 127 ms (top right), B10.5TW2 at
219 ms (bottom left), and B9TW4 at 404 ms (bottom right). Profiles show color-coded contour plots of entropy (kB) per nucleon. Various profiles are found by
changing the strength of the initial magnetic field and rotation.
Takiwaki et al., ApJ 616 (2004) 1086 Fig.2
Fig. 9.— Partial cutaway view of the iso-entropy surfaces and the velocity vectors on
the cutting plane at t = 800ms (a), (b) without rotation for Models C0 and (c), (d) with
rotation for Model C1. One can see (a), (c) the object having three cutting planes from the
−y direction and (b), (d) its equatorial section from z direction.
Iwakami et al., 2008: SASI と回転
F IG . 21.— 2D entropy colormaps portraying the postbounce evolution of the rapidly-rotating model s20.π between 160 ms (top-left panel) and 550 ms (bottomright panel) after core bounce. Fluid-velocity vectors are superposed to relay an impression of the flow and convey the partial suppression of convective overturn
in regions of positive specific angular momentum gradient. As in Fig. 20, we plot the MGFLD result on the left-hand side and the Sn result on the right-hand
side of each panel. Easily discernible is the immediate increase in the polar shock radius in the Sn calculation. This is a direct consequence of the increased polar
neutrino heating in this variant (Figs. 15 and 16). At intermediate times, Sn and MGFLD shock positions grow closer, but later on in the postbounce evolution,
the Sn variant begins to develop larger top-bottom SASI-like asymmetry and polar shock excursions at earlier time than its MGFLD counterpart.
In summary, our results show that 2D multi-angle neutrino
of flux limiter and will consider different progenitor models.
Ott et al., 2008: 2D rotation + SN ν-tr.
Burrows et al., 2007: 磁場と自転とニュートリノ
Fig. 12.— On the left-hand-side is a colormap of the entropy at 444 ms after bounce for model M15B11DP2A1H on a 4000 km×4000
~ ×B
~ vector field, with a length of 15% of the width of the display corresponding to a saturation value of
km scale. We overplot the (∇ × B)
18
−2
−2
10 g cm s . This term enters the momentum equation and thus represents the acceleration due to the magnetic field, revealing here,
in particular, the role of hoop stresses in confining the jet as it moves to large distances. The right panel is the same as the left panel, but
for the inner 1000 km×1000 km region.
ApJ 664(2007) 416 Fig.12
Summary
• state-of-the-art inputs(EOS, ν int.) とボルツマンコードによるニュートリノ
輸送を使った球対称シミュレーション
⇒ no prompt explosion
軽いコアの弱い爆発
∼ 20M¯ の星の 1051 erg の爆発は、未再現
further sophistication of inputs?
(weak int. rates of nuclei and many body effects consistent with EOS)
非球対称性 convetion? SASI? rotation? magnetic field?
• きちんとした入力物理を使った長時間の多次元数値シミュレーション
SASI +ν heating explosion? accoustic explosion? EOS モデルの影響?
NS kick velocity, ejecta mixing, GW, pulsar spin?
14.5
100
14.5
14
80
80
13.5
12
40
11.5
60
12.5
12
40
11.5
11
20
20
(a)
40
60
X [km]
80
0
100
12.5
12
40
11.5
11
20
10.5
0
14.5
10
0
9.5
20
(b)
100
60
10
9.5
20
13
10.5
10
0
13.5
11
10.5
0
14
13
Z [km]
Z [km]
12.5
14.5
80
13.5
13
60
100
14
Z [km]
100
40
60
X [km]
80
100
9.5
0
20
(c)
150
15
40
60
X [km]
80
100
200
15
14
150
12.5
12
40
11.5
100
20
12
50
11
13
13
Z [km]
Z [km]
13
60
14
14
13.5
Z [km]
80
12
100
11
11
10
50
10.5
10
9
10
0
9.5
0
20
(d)
40
60
X [km]
80
100
100
150
10
50
8
0
50
(g)
100
X [km]
150
200
200
15
13
12
100
11
10
50
9
0
150
200
14
150
Z [km]
11
100
X [km]
15
13
12
50
(f)
200
14
100
8
0
X [km]
15
150
Z [km]
50
(e)
200
0
9
0
14
13
150
Z [km]
0
12
100
11
10
50
9
0
8
0
50
(h)
100
150
X [km]
200
9
0
8
0
50
(i)
100
150
X [km]
200
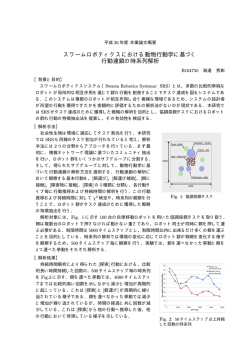
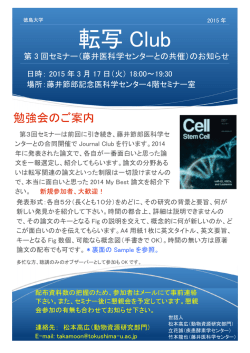
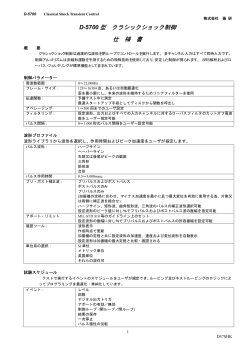
Fig. 10. Snapshots of the density contours and the velocity fields in the x-z plane for model S24 at
(a) t = 283.7, (b) 285.7, (c) 286.7, (d) 288.2, (e) 291.1, (f) 294.2, (g) 300.2 , (h) 301.8, (i) 304.7
ms.
Sekiguchi 2008, 24M¯ , GR+Shen EOS+e-capture+leakage ν-tr.
• 恒星の進化 (元素合成と崩壊前のコア)
第一世代星、自転、対流モデル、核反応率、質量放出、磁場
• 高密度物質の状態方程式
核統計平衡状態、パスタ状態,一様核物質、ハイペロン,クォーク?
• ニュートリノ反応率
様々な原子核による電子捕獲率、ニュートリノ加熱率、状態方程式とコンシ
ステントな多体効果を考慮したニュートリノ反応率
• 非球対称性?
対流,SASI、自転,磁場
• 一般相対論
ブラックホール形成,重力波
• 動的段階の元素合成ネットワーク計算
超新星、極超新星、高密度天体合体、ニュートリノ駆動風、下限質量中性子
星の爆発などにおける密度,温度、電子フラクションの変化、Mass Cut の決
定、不安定核の崩壊率と反応率、核分裂の影響
• 流体計算
• ニュートリノ輸送計算アルゴリズム
• 観測からのフィードバック、観測データテンプレート
ニュートリノ検出反応、重力波検出器、νν 相互作用を含むニュートリノ振動
!"#A03$%&'%()G./012*+,-HIJKLMN>OPQR3
STUVWX"#YZ[\
]^_`XOPQRXabcde
fgXh5XigXjkXlm
]^no9
pqrB%s
tuvwxXy(z
{gX|}
~^HIX%'9RX
C';
iXg
c
X5X
!"#A02$%&'%()*+,-./0123
!"#A04$456789:;<=> ?@ABCD'AEF3
さらなる連携を
MHD, GRB, · · ·
© Copyright 2026 Paperzz