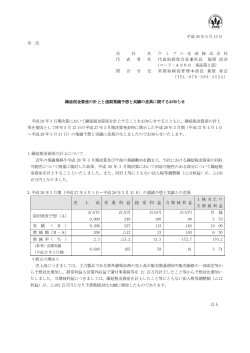
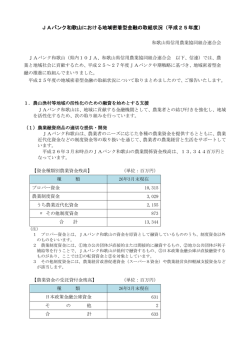
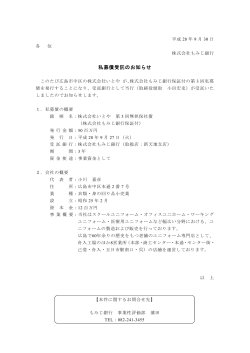
売上高(百万円)
経常利益(百万円)
親会社株主に帰属する当期純利益(百万円)
Net Sales
Ordinary Income
Profit Attributable to Owners of Parent
(Millions of yen)
600,000
500,000
510,923 505,205
541,897 530,164
506,631
7,008
6,353
5,465
3,000
3,156
2,967
3,400
2,000
5,000
300,000
974
1,000
0
3,000
’12/3
’13/3 ’14/3 ’15/3 ’16/3
-1,000
2,000
100,000
-2,309
0
’12/3 ’13/3 ’14/3 ’15/3
’16/3
¥510,923
¥505,205
¥541,897
¥530,164
¥506,631
$4,496
営業利益
(百万円/百万米ドル)
Operating income (Millions of yen/Millions of U.S. dollars)
5,456
6,718
7,844
6,491
6,380
$57
経常利益
(百万円/百万米ドル)
Ordinary income (Millions of yen/Millions of U.S. dollars)
5,465
6,855
7,794
6,353
7,008
$62
2,967
-2,309
974
3,156
3,400
$30
1,996
2,637
6,137
8,999
-1,417
$-13
68,573
69,011
74,717
82,523
76,705
$681
282,899
276,891
292,686
310,058
297,493
$2,640
453.71
460.35
498.02
543.36
524.09
$4.65
1株当たり当期純利益
(円/米ドル)
Net income per share (Yen/U.S. dollars)
20.28
-15.88
6.78
21.96
24.44
$0.22
潜在株式調整後1株当たり当期純利益
(円/米ドル)
Diluted net income per share (Yen/U.S. dollars)
20.25
—
6.75
21.84
24.30
$0.22
10
10
10
10
10
$0.09
-3,000
’12/3 ’13/3 ’14/3 ’15/3
配当性向
(%)
Payout ratio (%)
49.3
—
147.5
45.5
40.9
自己資本比率
(%)
Equity ratio (%)
23.5
23.9
24.5
25.2
24.3
4.5
‒3.5
1.4
4.2
4.5
14.6
—
51.6
14.8
13.2
-1,609
16,410
7,559
7,545
12,929
$115
221
-2,686
-10,762
-18,517
-7,817
$-69
1,223
-12,789
2,707
11,004
-5,448
$-48
3,645
4,751
4,863
5,569
5,328
$47
2,985
3,135
3,146
3,164
3,110
親会社株主に帰属する当期純利益
(百万円/百万米ドル)
Profit attributable to owners of parent
(Millions of yen/Millions of U.S. dollars)
包括利益
(百万円/百万米ドル)
Comprehensive income
(Millions of yen/Millions of U.S. dollars)
総資産
(百万円/百万米ドル)
Total assets (Millions of yen/Millions of U.S. dollars)
’16/3
事業セグメント別売上高構成比
商品別売上高構成比
地域別売上高構成比
自己資本当期純利益率〈ROE〉
(%)
Return on equity (%)
Sales by Business Segment
2016/3
Sales by Product Segment
2016/3
Sales by Geographic Segment
2016/3
株価収益率
(倍)
Price/Earnings ratio (PER) (Times)
不動産賃貸
Real estate leasing
製紙及び加工等
Paper manufacturing
and processing
その他の事業
Other
古紙
Recovered
paper
パルプ
Pulp
その他の北米及び欧州
Other North
America & Europe
その他
Other
在外卸売
Wholesaling:
Non-Japan
国内卸売
Wholesaling:
Japan
板紙
Paperboard
(百万円)(Millions of yen)
紙
Paper
アジア
Asia
(百万円)(Millions of yen)
紙
Paper
日本
Japan
2,594 (0.5%)
341,286 (67.4%)
パルプ
Pulp
在外卸売
Wholesaling: Non-Japan
その他の事業
Other
板紙
Paperboard
その他
Other
アジア
Asia
3,325 (0.7%)
製紙及び加工等
Paper manufacturing and processing
22,258 (4.4%)
*卸売は事業拠点の所在地により国内と在外に区分して
います。
* Wholesaling is segmented as Japan or Non-Japan in
accordance with the location of the business base.
72,676 (14.3%)
古紙
Recovered paper
18,242 (3.6%)
6,628 (1.3%)
67,799 (13.4%)
日本
Japan
323,246
その他の北米及び欧州
Other North
(63.8%) America & Europe
67,394 (13.3%)
米国
USA
営業活動によるキャッシュ・フロー
(百万円/百万米ドル)
Net cash provided by (used in) operating activities
(Millions of yen/Millions of U.S. dollars)
投資活動によるキャッシュ・フロー
(百万円/百万米ドル)
Net cash provided by (used in) investing activities
(Millions of yen/Millions of U.S. dollars)
財務活動によるキャッシュ・フロー
(百万円/百万米ドル)
Net cash provided by (used in) financing activities
(Millions of yen/Millions of U.S. dollars)
現金及び現金同等物の期末残高
(百万円/百万米ドル)
Cash and cash equivalents at end of period
(Millions of yen/Millions of U.S. dollars)
(百万円)(Millions of yen)
不動産賃貸
Real estate leasing
145,515 (28.7%)
その他地域
Other areas
米国
USA
国内卸売
Wholesaling: Japan
332,939 (65.7%)
30
2016/3
1株当たり配当金
(円/米ドル)
Cash dividends per share (Yen/U.S. dollars)
-2,000
1,000
0
2015/3
1株当たり純資産
(円/米ドル)
Net assets per share (Yen/U.S. dollars)
4,000
200,000
2014/3
純資産
(百万円/百万米ドル)
Net assets (Millions of yen/Millions of U.S. dollars)
4,000
6,855
7,000
6,000
400,000
(Millions of yen)
7,794
8,000
2013/3
売上高
(百万円/百万米ドル)
Net sales (Millions of yen/Millions of U.S. dollars)
連 結 財 務 ハイライト
(Millions of yen)
2012/3
26,189 (5.2%)
その他地域
Other areas
12,350 (2.4%)
77,452 (15.3%)
*顧客の所在地により区分しています。
* Segments are based on the location of customers.
従業員数
(名)
Number of employees
注:
1) この財務情報は、日本において一般に公正妥当と認められる会計基準に沿って開示し
ております。
2) 売上高には消費税等は含まれておりません。
3) 当社の組織変更による経費の表示方法を見直したシステム変更を2012年4月に実施
したため、2012年3月期の営業利益の数値は再計算しています。
4) 2013年3月期は、投資有価証券評価損5,986百万円の計上により2,309百万円の親
会社株主に帰属する当期純損失となりました。
5) 2014年3月期の親会社株主に帰属する当期純利益は、年度末にかけて、中国及び欧
州にて債権の取立不能または取立遅延のおそれが生じ、3,139百万円の特別損失を
計上したことにより974百万円となりました。
6) 2013年3月期の株価収益率については、親会社株主に帰属する当期純損失であるた
め記載しておりません。
7) 参考までに、米ドルによる金額を表示していますが、換算レートは2016年3月31日
の円相場(仲値)1米ドル=112.68を用いています。
Consolidated Financial Highlights
Consolidated Financial Highlights
Notes:
1) This financial information is presented based on generally accepted accounting
principles in Japan.
2) Consumption tax has not been included in net sales.
3) In April 2012, the Company made a system change that readjusted the
method for stating costs due to a change to the Company’s organization.
Therefore, the figures for operating income for 2012/3 (the fiscal year ended
March 31, 2012) are recalculated.
4) Regarding profit attributable to owners of parent for the fiscal year ended
March 31, 2013, the Company recorded a loss attributable to owners of parent of
¥2,309 million due to a ¥5,986 million write-down of investment securities.
5) Profit attributable to owners of parent for the fiscal year ended March 31,
2014 was ¥974 million after the recording of an extraordinary loss of ¥3,139
million due to the occurrence of uncollectable or overdue receivables in both
China and Europe.
6) The price/earnings ratio (PER) for the fiscal year ended March 31, 2013 has not
been stated since the Company recorded a loss attributable to owners of parent.
7) All U.S. dollar amounts are presented solely for the readers' convenience and are
converted at the exchange rate (TTM) of 112.68 yen to the dollar as of March 31, 2016.
Japan Pulp and Paper Company Limited
31
© Copyright 2026 Paperzz