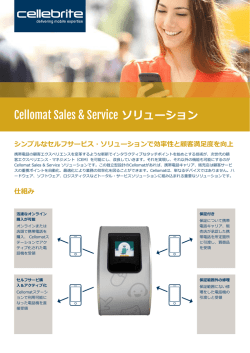
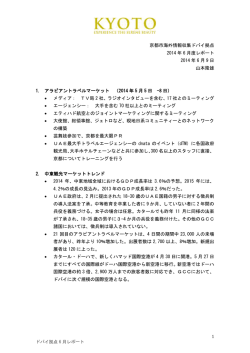
COMPANY PROFILE
MAY-2004
Resident Evil Outbreak
Onimusha 3
Resident Evil 4
Devil May Cry 3
【目 次 Content】
・・・・・・P2
1. ゲームソフト市場概況
Game Software Market Overview
・・・・・・P7
2. 機構改革への取り組み Management Reforms
3. グローバルな成長に向けた事業戦略
・・・・・・P12
Business Strategy for growth in the global market
・・・・・・P22
4. DATA FILE
1 ゲームソフト市場概況
Game
Game Software
Software Market
Market Overview
Overview
2 ゲームソフト市場規模 Market Size of Console and PC Software
(単位:億ドル 100 Millions Dollars)
180
160
140
120
100
80
136
60
40
78
156
159
2003
2004E
140
144
2005E
2006E
165
93
20
0
2000
2001
2002
2007E
※E: 推定 Estimate ※出所 Source: “IDG Report”
“ゲームソフト市場は、2004、2005年度の新ハードの登場を境に再成長”
“Growth of console software to be triggered by new console hardware”
3 ゲームソフト市場のグローバル化 Globalization of Game Software Market
主要ゲームソフト市場の販売金額推移 Sales of major game software markets by year
日本市場 Japanese Market
北米市場 North American Market
(単位:億ドル 100 Millions Dollars)
90
欧州市場 European Market
(単位:億ドル 100 Millions Dollars)
90
80
80
80
70
70
70
60
60
60
50
50
50
40
40
70
65
30
30
80
76
75
67
(単位:億ドル 100 Millions Dollars)
90
40
30
55
49
20
10
19
18
2000
2001
24
27
33
20
28
29
31
20
33
10
0
10
0
2002
2003 2004E 2005E 2006E 2007E
43
27
31
2000
2001
52
48
48
54
0
2000
2001
2002
2003
2004E 2005E 2006E 2007E
2002
2003 2004E 2005E 2006E 2007E
※E: 推定 Estimate ※出所 Source: “IDG Report”
“ゲームソフトの市場は、日・米・欧で2:5:3のシェア”
“Share ratio by each software market; Japan 2 : North America 5 : Europe 3”
4 国内ゲームソフト市場での当社の位置付け Capcom’s position in Japanese video game market
家庭用ソフト事業売上高(2003/3期 国内メーカー)
日本市場におけるマーケットシェア(2003年) Home Video Game Sales in FY2002(Japanese Game Software Company)
Japanese market share based on actual sales in CY2003
(単位:百万円 Millions of yen)
(単位:百万円 Millions of yen)
メーカー
売上高
シェア
Company Name
Sales
Share
1. コ ナ ミ
2. セ ガ
3. スクウェア・エニックス
4. カ プ コ ン
5. ナ ム コ
6. コ ー エ ー
合
計
Konami
Sega
Square-Enix
Capcom
Namco
Koei
Total
90,129
85,160
48,397
47,769
35,520
17,785
324,760
※出所 「2002/3期 決算短信」 Source:"Financial Results"
※スクウェア・エニックスの売上は合併前のスクウェアとエニックスの単純売上合計
Net Sales of “Square-Enix” is simply adding ex-Square and ex-Enix.
27.75%
26.22%
14.90%
14.71%
10.94%
5.48%
100.00%
メーカー
販売金額
シェア
シェア増減
Company Name
Sales
Share
Growth Rate
1. スクウェア・エニックス Square-Enix
Nintendo
2. 任 天 堂
Konami
3. コ ナ ミ
Bandai
4. バ ン ダ イ
Capcom
5. カ プ コ ン
Namco
6. ナ ム コ
Sega
7. セ ガ
Koei
8. コ ー エ ー
SCE
9. S C E
10. ポ ケ モ ン Pokemon
Others
そ の 他
Total
合
計
42,488 13.74%
39,694 12.83%
30,400
9.83%
26,172
8.46%
21,250
6.87%
19,723
6.38%
16,690
5.40%
15,162
4.90%
15,081
4.88%
13,596
4.40%
69,015 22.32%
309,271 100.00%
4.00%
△0.88%
△3.04%
0.20%
△1.08%
0.61%
△0.91%
0.76%
0.57%
0.01%
-
※出所 「Annual Console Research Data」 Source:"Annual Console Research Data"
“日本市場では、成熟化に対応した事業展開を行い、更なるシェアアップを目指す”
“Enhancement of Capcom’s share in matured Japanese market through various challenging efforts”
5 海外ゲームソフト市場での当社の位置付け Capcom’s position in overseas video game markets
北米市場におけるマーケットシェア(2003年) 欧州市場におけるマーケットシェア(2002年) North American market share based on actual sales in CY2003
European market share based on actual sales in CY2002
(単位:千ドル Unit:US$1,000)
(単位:千ドル Unit:US$1,000)
メーカー
販売金額
シェア
シェア増減
メーカー
販売金額
シェア
シェア増減
Company Name
Sales
Share
Growth Rate
Company Name
Sales
Share
Growth Rate
1.エレクトロニックアーツ
2.任 天 堂
3.T
H
Q
4.アクティビジョン
5. ソ ニ ー
6. A T A R I
7.テ イ ク 2
8.コ ナ ミ
EA
Nintendo
THQ
Activision
Sony
Atari
Take2
Konami
14.カ プ コ ン Capcom
そ の 他 Others
Total
合
計
1,240,083
619,257
360,537
338,076
331,335
283,737
266,820
225,109
22.66%
3.30%
11.32%
2.55%
6.59%
0.61%
6.18% △0.67%
6.06% △1.33%
5.19%
0.42%
4.88% △2.01%
4.11%
0.51%
109,768
2.01% △0.60%
1,697,039 31.01%
5,471,763 100.00%
-
*出所「TRSTS レポート」 Source:TRSTS Repor
EA
1.エレクトロニックアーツ
2. ソ ニ ー Sony
Take2
3.テ イ ク 2
4.任 天 堂 Nintendo
5. インフォグラムズ Infogrames
Konami
6.コ ナ ミ
7.アクティビジョン Activision
THQ
8.T
H
Q
418,465
276,487
205,512
187,505
140,210
134,159
132,013
106,739
17.98%
4.30%
11.88%
1.21%
8.83%
4.35%
8.06%△10.15%
6.03% △0.19%
5.77%
0.97%
5.67%
0.13%
4.59% △0.97%
45,652
1.96% △0.15%
15.カ プ コ ン Capcom
680,093 29.23%
そ の 他 Others
合
計
Total
2,326,835 100.00%
*出所「IDG レポート」 Source:IDG Report
*英国、ドイツ、フランス3カ国の合計 Total of UK, German and French Markets
“最大市場でのシェア拡大に向けてグローバルな経営体制の強化”
“Reinforcement of global management for share-increase in the growing markets”
6 機構改革への取り組み
Management
Management Reforms
Reforms
7 全社的な機構改革(開発・経営・マーケティング)の進展
Progress on Structural Reforms (R&D/ Management/ Marketing)
2003.3
2002.10
機構改革の着手
Start on structural reforms
2003.6
開発体制
再構築
Reformation of
2004.04
2003.12
欧米現地法人
経営・マーケティング
体制再構築
R&D structure
Reforms of management and
marketing in U.S.A. and Europe
本社主導による経営管理体
制の強化
開発体制の抜本的な見直
しに着手
本社主導による欧米現地
法人の経営体制の見直し
Head Office takes the initiative of enhancing
business management system
Start on review of R&D structure Head Office takes the initiative of reviewing
management structures of U.S.A. and Europe
制作管理体制の強化(中期
タイトルマップ)
欧米現地法人の経営陣の
交代
Strengthen title schedule control system (Midterm R&D schedule)
Change on the top management of U.S.A. and
Europe
全社組織改編
Corporate
Structural Reform
経営・管理部門組織改編
Structural changes on management as well as
administrative areas
(開発)編成室の設置
Establishment of R&D total coordination room
開発部門の分社化
Business Division of R&D
“2002年10月以降、グローバル市場での更なる成長を実現するため
開発、経営、マーケティングを中核とした全社的な機構改革を実施”
“Implementation of corporate structural reform since October 2002 for growth in the global market”
8 全社的な機構改革-1.日米欧経営体制の強化 Strengthening of Management Structure
日本 Japan
■全社組織改編 Corporate Structural Reform
・効率的組織運営を志向した開発・管理全部門を対象とした組織改編を実施
Structural reforms of R&D and administrative division toward efficient implementation of business strategy
・カンパニー制の弊害部分の見直し Streamlining non-functioning divisions
・チーム制採用等により、責任・役割を更に明確化
Clear responsibility and accountability by each team structure
■コストマネジメントの進展 Thorough cost management implementation
・ゼロベースでの業務見直しと重点管理項目の明確化
Review on function from scratch and distinction of important objectives
北米・欧州現地法人 U.S.A. and Europe subsidiaries
■海外現地法人でのマネジメント体制を刷新 Change on top management of U.S.A. and Europe
・グローバルな拡張に対応すべく経営陣を補強、体制を刷新
Change and reinforcements for global business growth
■欧米販売体制改革に着手 Start on review of sales distribution systems
・北米・欧州での流通体制の見直しなど、販売体制強化へ
Review on distribution system in U.S.A. and Europe for increase of sales
9 全社的な機構改革-2.開発体制の強化 Strengthening of R&D
■ 2段階承認におけるチェック機能の強化 Tightening checking function by dual approval system
・ リスクヘッジを目的に、制作プロセスを試作開発→本開発と明確に定義
Distinction between proper R&D process and experiment process
・ 工程ごとの品質、コスト等を徹底的にチェックする仕組みを構築
Enhancement of system to check quality and cost at every process
■ 中期タイトルマップの策定 Drawing up of midmid-term R&D Schedule
・ 中期経営計画に基づき中期タイトルマップを作成
Drawing up of mid-term R&D schedule based on mid-term management strategy
■ 編成室の設置
R&D total coordination Room
・ 編成・プロデュース機能と制作機能の分離
Segregation of “R&D total coordination” function and “Production” function
・ 全体最適を実現すべく開発ポートフォリオを編成
R&D portfolio management to realize optimization
■ 開発部門の分社化 Business Division of R&D
・ 新機軸ジャンル、オリジナルタイトルの創出
10 Creation of new genre and original titles
全社的な機構改革-3.マーケティング体制強化 Strengthening of marketing structure ■ 日米欧マーケティング体制の構築 Establish marketing structure in Japan, U.S.A., and Europe
・ 各々のマーケットで製販一体となった体制構築のための土台づくり
Building of tie-in structure between creative process and sales information in each market
・ 日米欧各地域にマーケティング担当者を配置 Marketing staff in each territory
・ 各地域の担当者が連携し、グループ全体の最適化を目指したマーケティング
体制の構築
Coordinate and optimize marketing efforts from each region for enhancement of business results
■ マーケティングの専門家を欧米各現地法人で補強
Reinforcement
Reinforcement of professional marketing staff in U.S.A. and Europe
Europe
・ 北米 バリ・アブダル (COO) U.S.A.: Bari Abdul (COO)
・ 欧州 ギャリー・デール (マネージングディレクター) Europe: Gary Dale (Managing Director) 11 グローバルな成長に向けた
各事業別戦略
Segment
Segment Strategy
Strategy for
for growth
growth
in
in the
the global
global market
market
12 1-(1) コンシューマ用機器事業 経営目標 Consumer Business Objective
“経営目標を達成するため、下記3つの開発戦略を構築し、
中期タイトルマップで具現化”
“Establishment of R&D three strategies as below and implementations
in Mid-term R&D Map to achieve consumer business objective”
■ 中期経営目標
MidMid-term Business Objective
市場規模に対応した売上・利益比率を目指す(米国:5、欧州:3、日本:2)
Enhancement of sales and profits to each market size(USA:5, Europe:3, Japan:2)
■ プラットフォーム戦略
■ フランチャイズ戦略
■ ジャンル戦略
Platform Strategy
Franchise Strategy
Genre Strategy
–– 普及台数を重視したソフト開
普及台数を重視したソフト開
発を原則化
発を原則化 R&D
R&Dfor
formost
mostprevailing
prevailing
platforms
platformsininthe
themarket
market
–– マルチプラットフォーム対応
マルチプラットフォーム対応
Multiple
MultiplePlatforms
PlatformsSupport
Support
–– 有力フランチャイズを毎年発売できる体
有力フランチャイズを毎年発売できる体
制の確立
制の確立 ToTorelease
releasemajor
majorfranchises
franchisesevery
everyfiscal
fiscalyear
year
–– フランチャイズタイトルのクオリティ確保
フランチャイズタイトルのクオリティ確保
Secure
Securethe
thequality
qualityofoffranchise
franchisetitles
titles
■ 中期タイトルマップ
–– オリジナルタイトルへの
オリジナルタイトルへの
投資
投資 Investment
Investmenttotooriginal
originaltitles
titles
–– 他社製品の販売
他社製品の販売 Publishing
Publishingselected
selectedtitles
titlesfrom
fromothers
others
MidMid-term R&D Schedule
・上記3つの戦略の具体化およびモニタリングを中期タイトルマップにより実施
・上記3つの戦略の具体化およびモニタリングを中期タイトルマップにより実施
Implementation
ImplementationofofR&D
R&Dstrategies
strategiesand
andits
itsmonitoring
monitoringprocess
processthrough
throughMid-term
Mid-termR&D
R&Dschedule
schedule
13 1-(2) コンシューマ用機器事業 開発戦略
1.プラットフォーム戦略
Consumer Business R&D Strategy
Platform Strategy
“普及台数を重視したソフト開発の原則化およびマルチプラットフォーム戦略の継続”
“R&D for most prevailing platform in the market and multi-platform strategy”
・ PS2 「バイオハザード アウトブレイク」シリーズ
・ PS2, GC 「ビューティフル ジョー2」
・ PS2, GC 「キラーセブン」
2.フランチャイズ戦略
“Resident Evil Outbreak” Series
“Viewtiful Joe 2”
“Killer Seven”
Franchise Strategy
“有力フランチャイズを毎期発売する体制の確立および開発継続基準の明確化”
“To release major franchises in every fiscal year and define criteria for title development”
(1) 有力フランチャイズ
Major Franchises
・ 「バイオハザード」 “Resident Evil” ・「鬼武者」 “Onimusha”
・ 「デビルメイクライ」 “Devil May Cry” ・「ロックマン」 “Megaman”
(2) 開発継続基準 Criteria for titles as to its continuation
・ 販売本数20万本、タイトル収益率15%
Sales units more than 200,000 and total profit more than 15%
14 1-(3) コンシューマ用機器事業 開発戦略 Consumer Business
R&D Strategy
3.ジャンル戦略 Genre Strategy
“新機軸ジャンル、オリジナルタイトルを開発、育成” “Develop and create new genre and original titles”
(1) 開発部門の分社化 Business Division of R&D
・ クローバースタジオ株式会社で「新しい価値の創造」に集中
To focus on “Creation of New Value” at Clover Studio
(2) 「価値を生み出すタイトル」と「収益を刈り取るタイトル」のバランス
Balance
Balance between “New Original Titles”
Titles” to create new brands, and “Sequel Titles”
Titles” to produce profits
オリジナル New Original Titles : シリーズ
(3) 他社製品の販売にも注力
Sequel Titles= 3 : 7
Publishing selected titles from other software companies
・ 「グランド・セフト・オート・バイスシティ」
モンスターハンター Monster Hunter
15 “Grand Theft Auto Vice City”
大神 Okami
2-(1) アミューズメント施設運営事業 市場分析 Arcade Operation Market Analysis
アミューズメント施設事業売上高(2003/3期) Arcade Operation Sales in FY2002
(単位 : 億円
売上高
シェア率
営業利益
Net Sales
% of Share
Operating Income
営業利益率
% of Operating
Income
Unit : 100Millions Yen)
前年売上比
Year-on-year sales
カプコン Capcom
92.4
1.5%
21.4
23.2%
111.0%
タイトー Taito
423.4
7.0%
50.0
11.8%
107.4%
セガ Sega
693.3
11.5%
80.5
11.6%
101.2%
ナムコ Namco
759.0
12.5%
47.7
6.3%
98.0%
その他 Others
4,084.9
67.5%
合計 Total
6,053.0
100.0%
※出所:各社決算短信および補足資料 -
-
-
Source: Financial Results for 2002 by respective company and support documentation
戦略的な出店展開により営業利益率は大きく同業他社をリード
今後は営業利益率を維持しつつ、シェア向上を図る
“Greater operating profit based on strategy for opening new stores.
Further improvement on operating income”
16 102.6%
2-(2) アミューズメント施設運営事業 戦略 Arcade Operation Business Strategy
“出店戦略の徹底による更なる事業拡大“
Expansion of Business through New Store Opening and improvement on operation
■ 出店戦略 Strategy for Opening New Store
・ 年間売上120億円以上、駐車場台数2,000台以上の大型複合商業施設内に店舗展開
Open arcades in large commercial complexes, of which annual sales are more than ¥1.2 billion with parking space
over 2,000 cars
・ スクラップ&ビルドによる収益展開
Pursuing profit increase by implementing scrap-and-build plan
■ アミューズメント施設店舗数 Number of arcade stores
2002/3
出 店
New Stores
退 店
Closing Stores
店舗数
Total
2
10
40
2003/3
2
9
33
17 2004/3
4
5
32
2005/3(Plan)
1
1
32
3-(1) 業務用機器事業 市場分析 Arcade Games Sales Market Analysis
業務用機器市場規模 Over-all market size of Arcade Sales
(単位:億円 100Million Yen)
2002/3
プライズ
Prize
メダル
Medal
メイキング
Printing
専用筐体
Dedicated
基板ソフト
Video
音楽ゲーム
Music Game
その他
Others
合 計
Total
2003/3
352
223
180
93
152
49
151
1,200
構成比
増減率
Component
Growth Rate
472 35.1% 34.1%
271 20.1% 21.5%
188 14.0%
4.4%
134 10.0% 44.1%
93
6.9% -38.8%
34
2.5% -30.6%
154 11.4%
2.0%
1,346 100.0% 12.2%
※出所「アミューズメント産業界の実態調査報告書」 Source:"Report in Amusement Industry"
市場ニーズの高いメダルゲーム、プライズゲームに競争力の高い商品を投入
“The key to increase sales on arcade games is to put high competitive
products into medal games and prize-winning games“
18 3-(2) 業務用機器事業 戦略 Arcade Games Sales Business Strategy
“市場ニーズの高いプライズゲームやメダルゲームの開発に注力“
“Focus on developing prize-winning and medal games”
■ 主要なラインナップ
Main Titles coming up in FY2004
(1) プライズゲーム PrizePrize-winning Games
・ 「メチャトレ3」 “Mecha-Tore3”
(2) メダルゲーム Medal Games
・ 「スーパーマリオ 不思議のジャンジャンランド」
“Super Mario Jan-Jan Wonder Land”
(3) ビデオゲーム Video Games
・ 「機動戦士Zガンダム エゥーゴ V.S. ティターンズ DX」
“Mobile Suite Z Gundam A.E.U.G. vs. Tittans DX”
■ 業務用機器販売事業
Arcade Game Sales
2002/3
売
上
営業利益率
Net Sales
of Opreting
Profit
36
(単位:億円 100Million Yen)
2003/3
10
2004/3
2005/3(Plan)
44
62
-12.8% -55.7% 32.1%
22.1%
19 4. キャラクターライツ事業 戦略 Licensing-Out Business Strategy
“トータルマーチャンダイジングの構築”
(ゲーム、アニメ、映画、出版、キャラクター等との相乗展開)
“Establishment of Total Merchandise” (Expansion of business opportunities
with synergy of games, animations, movies, publication and characters etc…)
■ 出版事業へ進出(2004/1~)
Step up into the Publication Business from 2004/1
・ 自社出版による収益率の向上 Improvement of profit by own publication
・ 攻略本以外での出版事業の拡大
Expansion of Publication Business
■ ライセンス事業の強化 Strengthen LicensingLicensing-Out Business
・ 米国でのキャラクターライセンス事業の拡大 Maximization of characters and contents by region
・ 自社コンテンツのアニメ化、映画化 Collaboration with animations and movies of our original contents
→ TVアニメ「ロックマン エグゼ」を日本、米国、欧州で展開
TV animation “Megaman NT Warriors” in Japan, U.S.A. and Europe
→「バイオハザード アポカリプス」 2004年9月に日米で公開予定 “Resident Evil Apocalypse” to be released in October 2004 (plan)
20 5. モバイルコンテンツ事業 戦略 Mobile Contents Business Strategy
“海外市場と新製品への対応による事業拡大”
“Expand Business Opportunities in Overseas and explore new products “
■ 海外市場へ積極的に展開 Business Exploitation of Mobile contents in Overseas markets
・ 欧米を中心に市場規模は拡大 Mobile contents distribution are growing in Europe and U.S.A. markets
・ 2002年9月から海外での配信開始 Mobile contents have been delivered since September 2002
・ 15タイトルを欧米、アジアなど17カ国に配信中
Distribution of 15 titles in 17 countries among U.S.A., Europe and Asian regions
→ 「ロックマン」、「魔界村」、「戦場の狼」、「1942」、「1943」、「ガンスモーク」等
“Megaman”, “Ghost’n Goblin, “Commando”, “1942”, “1943”, “Gun Smoke”etc.
■ 次世代モバイルに対応したコンテンツ開発 Development of game contents for 3G mobile phone
・ 第3世代市場を踏まえたゲームの開発
・ ゲーム以外のコンテンツの配信
Development of game contents for 3G market
Distribute the new contents besides games
21 DATA FILE
22 主要経営指標 Consolidated Financial Review on FY 2002, 2003 and Projection for FY 2004
23
© Copyright 2026 Paperzz