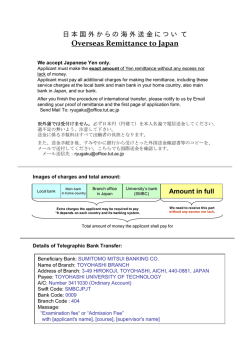
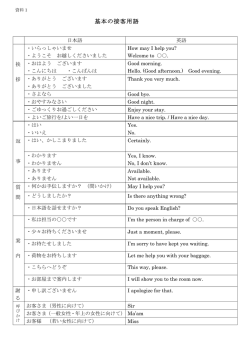
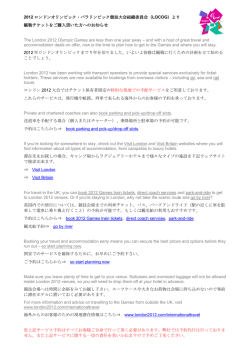
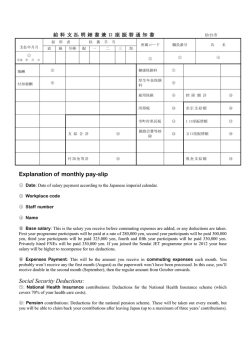
Inbound Tourism Statistics 4.July.2011 Japan Tourism Agency Consumption Trend Survey for Foreigners Visiting Japan -2- 1 Major official statistics on tourism ※Red : Conducted by the Japan Tourism Agency Domestic Inbound ○Number of inbound tourists ・・・Announced by JNTO (Japan National Tourism Organization) on a monthly basis. ○JNTO Survey on Travel Destinations by Foreigners Visiting Japan ・・・Survey on travel rate by prefecture and purpose of travel. ○Consumption Trend Survey for Foreigners Visiting Japan ・・・The amount of travel consumption by foreign tourists (transportation and accommodation costs,etc.) is surveyed by nationality and region every quarter and its results are announced. Outbound ○Number of Japanese tourists who travel abroad ・・・Announced by JNTO on a monthly basis. ○National Tourism Survey (general statistics) ・・・Survey on the amount of domestic travel consumption and number of overnight and day trips by Japanese nationals. Economic ripple effects and TSA are analyzed based on this survey and its results are announced. ○Accommodation Survey (general statistics) ・・・The number of total and real guests by region, capacity and occupancy rate are surveyed every quarter and its results are announced. ○Statistics on Inbound Tourists by Prefecture ・・・The Japan Tourism Agency has set the common standards for statistical methods to count the number of tourists. The survey has been conducted in prefectures since FY2010. It is possible to compare results by region. Tourism-related industries ○ Status of handling by major travel agents ・・・The total handling amount and status of handling of group tours are announced. ○ Survey on Status of Ryokan(Japanese-style inn) Operation ・・・ Based on results of the Survey on Status of Ryokan Operation conducted by the Japan Ryokan and Hotel Association, a trend of occupancy rate by region is announced. ○ Regional Tourism Economic Survey (planned) ・・・Survey methods to understand a basic structure of the tourism industry (number of offices, volume of sales, status of employment, etc.) are verified by conducting test surveys. -3- Overview of the Consumption Trend Survey for Foreigners Visiting Japan • The amount of travel consumption (transportation and accommodation costs, etc.) spent by foreigners visiting Japan (mainly the 15 countries and regions designated as the VJC priority market) and status of change are surveyed by nationality, quarter and region Content of survey <Outline> ◆ Number of survey conducted:4 times a year ◆ Place:11 Airports and ports ◆ Target:Foreigners who depart from Japan ◆ Number of samples: Total 26,000 (6,500 each quarter) ◆ Method:CAPI (using ipad) ◆ Items to be surveyed Status of travel activities Attribute + Nationality, gender, age, etc. Place of entry into the country, number of times of visit to Japan, number of companion(s), places visited, etc. + Status of consumption 【Item x amount of spending】, means of settlement, etc. + Others satisfaction, rate in each activities, intention of return to Japan, recognition of logo, etc. (Image of survey) Utilization methods ○ Planning of inbound policies based on needs of foreigners visiting Japan Implementation of promotion activities based on PDCA cycle taking into account the trend of travel of foreigners visiting Japan Development of a system of accepting foreigners according to their consumption patterns and needs (understanding of major routes by nationality, etc.) Economic effect (effects in terms of employment and tax revenues) by foreigners visiting Japan and analysis of cost-benefit performance ○ Revitalization of businesses for foreigners visiting Japan Utilization for effective tourism marketing (establishment of new travel routes, etc.) Utilization for formulating locating strategies for commercial facilities -4- 2 Items to be surveyed Attitude survey, etc. General statistics (approved by the Ministry of Internal Affairs and Communications) Attribute Status of travel activities Degree of satisfaction Status of consumption Satisfied products, prices and reasons Status of consumption by foreigners visiting Japan is surveyed in terms of amount by nationality and region Rating of satisfaction by activity and intention to return to Japan 【Item × Consumption amount】 Total amount and hearing by major destination Date of entry Place of entry Nationality Number of visits to Japan Place of residence Companion Place of shopping Gender and age Purpose of visit Financial institution(s) used ・Means of settlement Places visited and number of stays Overall rating of satisfaction Intention to return to Japan Information source Useful information source before visiting to Japan Useful information source after visiting to Japan Lacked Information Type of accommodation Recognition of promotion Type of travel Recognition of logo Recognition of tourism nation navigator -5- Amount of travel consumption by foreigners visiting Japan The amount of travel consumption by foreigners visiting Japan in 2010 is estimated to be 11.49 billion yen The amount spent during the stay in Japan (April to December 2010) is 113,005 yen per person. The amount of domestic revenue included in package tour costs (April to December 2010) is 20,761 yen per person The amount of travel consumption is estimated to be 882.3 billion yen by multiplying the amount above by the number of foreigners who visited Japan (6.596 million) from April to December 2010 Estimation of amount of travel consumption by foreigners who visited Japan in 2010 (calendar year) Yen/person a. Amount of travel consumption during the stay in Japan Yen/person b. Domestic revenue amount included in package tour costs Yen/person Person 100 million yen c. Amount of e. Total amount of travel travel consumption consumption by d. Number of including the foreigners foreigners visited domestic revenue Japan (JNTO)*2 (including the amount in breakdown of package tour package tour costs costs) (=c x d) January to March 2010*1 111,949 20,365 132,314 2,015,012 2,666 April to June 2010 104,003 23,344 127,347 2,186,624 2,785 July to September 2010 119,605 20,603 140,208 2,399,063 3,364 October to December 2010 April to December 2010 114,921 18,140 133,061 2,010,476 2,675 113,005 20,761 133,766 6,596,163 8,823 2010 (calendar year) 112,758 20,668 133,426 8,611,175 11,490 *1 For the travel consumption by nationality from January to March 2010, the travel consumption by nationality from April to December 2010 was used *2 The number of foreigners visiting Japan by JNTO is provisional ※ The values in the calendar year columns includes accommodation and meals fees spent in Japan included in the package tour costs. However, it does not include international passenger fares paid to Japanese airlines and ship companies Source: Japan Tourism Agency 2010 Annual Report “Consumption Trend Survey for Foreigners Visiting Japan 3 Breakdown of amount of travel consumption by nationality Amount of travel consumption in terms of calendar year and its breakdown by nationality are as follows; 1) China 249.8 billion yen (21.7%), 2) Korea 197.3 billion yen (17.2%), 3) Taiwan 131.8 billion yen (11.5%), 4) United States 115.9 billion yen (10.1%), 5) Hong Kong 59.3 billion yen (5.2%) Breakdown of amount of travel consumption by nationality 旅行消費額の国籍別構成比 (including the breakdown of package tours costs (excluding (パッケージツアー参加費内訳(国際旅客運賃以外)を含む) international passenger fees)) Australia 3% Others 13% Korea 17% Canada 2% Russia 1% United States 10% Taiwan 11% Amount of travel consumption: 1149 billion yen Hong Kong 5% France 3% Germany 2% China 22% United Kingdom 3% India 1% Singapore 3% Malaysia 1% Thailand 3% Source: Japan Tourism Agency 2010 Annual Report “Consumption Trend Survey for Foreigners Visiting Japan Travel consumption by foreigners who visited Japan (amount of consumption by item) Amount of travel consumption by item in 2010 (calendar year) and its breakdown (by nationality, including the domestic revenue of package tour costs) Amount of consumption by item Yen/Person Transport Entertain Shopping ation cost ment/serv cost ice costs Total amount of travel consumption Accomm odation cost 133,426 41,659 26,598 14,120 6,803 41,273 2,973 80,875 27,565 18,163 9,456 3,739 20,458 1,494 Taiwan 103,888 26,700 18,584 7,529 6,424 39,129 5,521 Hong Kong 116,582 31,575 25,080 10,541 4,580 43,956 850 China 176,784 36,543 25,393 10,338 12,601 86,752 5,157 Thailand 143,424 40,542 33,455 14,816 3,824 47,186 3,600 Singapore 164,937 53,772 30,782 14,944 11,733 52,839 867 Malaysia 131,075 49,501 24,029 14,296 4,497 37,966 785 India 177,315 90,021 37,288 21,011 2,976 22,856 3,164 United Kingdom 160,603 78,551 32,373 18,073 5,475 25,038 1,094 Germany 160,505 64,596 34,728 23,203 5,468 30,992 1,517 France 232,668 68,560 52,254 32,448 12,711 65,324 1,371 Russia 223,052 58,311 49,359 33,226 11,839 68,413 1,904 United States 159,414 61,851 36,353 23,161 6,580 30,036 1,432 Canada 124,316 50,213 26,811 18,451 3,554 24,992 296 Australia 169,445 64,360 35,898 22,132 5,495 33,124 8,437 Others 195,512 72,093 44,663 28,687 8,554 38,570 2,946 Nationality All Nationality Korea Dining cost Others ※ The values of calendar year includes accommodation and meals fees spent in Japan included in the package tour costs. However, it does not include international passenger fares paid to Japanese airlines and ship companies 8 Source: Japan Tourism Agency 2010 Annual Report “Consumption Trend Survey for Foreigners Visiting Japan 4 Travel consumption by foreigners who visited Japan (propotion of consumption by item) Amount of travel consumption費目別旅行支出額と構成費(国籍別、パッケージツアー参加費の内国内収入分含む) rate by item in 2010 (calendar year) and its breakdown (by nationality, including the domestic revenue of package tour costs) 2010年(暦年) Amount of consumption by item Accomm odation cost Nationality (%) Trans port Entertain Shopping ation cos t m ent/s erv cos t ice cos ts Dining cos t Others All Nationality 31.2 19.9 10.6 5.1 30.9 2.2 Korea 34.1 22.5 11.7 4.6 25.3 1.8 Taiwan 25.7 17.9 7.2 6.2 37.7 5.3 Hong Kong 27.1 21.5 9.0 3.9 37.7 0.7 China 20.7 14.4 5.8 7.1 49.1 2.9 Thailand 28.3 23.3 10.3 2.7 32.9 2.5 Singapore 32.6 18.7 9.1 7.1 32.0 0.5 Malaysia 37.8 18.3 10.9 3.4 29.0 0.6 India 50.8 21.0 11.8 1.7 12.9 1.8 United Kingdom 48.9 20.2 11.3 3.4 15.6 0.7 Germany 40.2 21.6 14.5 3.4 19.3 0.9 France 29.5 22.5 13.9 5.5 28.1 0.6 Russia 26.1 22.1 14.9 5.3 30.7 0.9 United States 38.8 22.8 14.5 4.1 18.8 0.9 Canada 40.4 21.6 14.8 2.9 20.1 0.2 Australia 38.0 21.2 13.1 3.2 19.5 5.0 Others 36.9 22.8 14.7 4.4 19.7 1.5 ※ The values of calendar year includes accommodation and meals fees spent in Japan included in the package tour costs. However, it does not include international ※旅行消費額の暦年値には、パッケージツアー参加費に含まれる日本国内に支払われる宿泊費や飲食費などが含まれる。なお、日本の航空会社や passenger fares paid to Japanese airlines and ship companies 船舶会社に支払われる国際旅客運賃は含まない。 出所:観光庁「訪日外国人消費動向調査」2010年年次報告書 Source: Japan Tourism Agency 2010 Annual Report “Consumption Trend Survey for Foreigners Visiting Japan Travel consumption rate by foreigners visiting Japan (breakdown by item and nationality) 【Breakdown by item】 by nationality All nationality 0% 20% 韓国(81000 (8.1万円) Korea yen) 台湾 (104000 (10.4万円) Taiwan yen) 香港 Hong Kong (11.7万円) (117000 yen) 中国(177000 (17.7万円) China yen) タイ (143000 (14.3万円) Thailand yen) シンガポール (16.5万円) Singapore (165000 yen) マレーシア (13.1万円) Malaysia (131000 yen) 17.9 27.1 14.4 37.8 22.1 40.4 Accommo 宿泊費 dation 36.9 cost 22.8 Transportat 交通費 ion cost 30.7 14.5 4.1 18.8 14.8 2.9 20.1 13.1 3.2 14.7 Entertainment and 15.6 0.7 19.3 28.1 5.3 21.6 21.2 3.4 5.5 22.8 38.0 Dining 飲食費 14.9 0.6 11.8 1.7 12.9 1.8 14.5 13.9 0.5 29.0 11.3 3.4 21.6 22.5 2.5 32.0 21.0 29.5 38.8 32.9 7.1 20.2 40.2 0.7 2.9 10.9 3.4 50.8 カナダ (12.4万円) Canada (124000 yen) その他 (19.6万円) Others (196000 yen) 18.3 48.9 26.1 37.7 10.3 2.7 9.1 1.8 5.3 49.1 18.7 米国(159000 (15.9万円) United States yen) Australia (169000 yen) オーストラリア (16.9万円) 9.0 3.9 23.3 32.6 100% 25.3 37.7 5.8 7.1 28.3 ドイツ (16.1万円) Germany (161000 yen) 80% 11.7 4.6 7.2 6.2 21.5 20.7 インド (17.7万円) India (177000 yen) ロシア (22.3万円) Russia (223000 yen) 60% 22.5 25.7 英国 (16.1万円) United Kingdom (161000 yen) フランス (23.3万円) France (233000 yen) 40% 34.1 娯楽サービス費 service costs 19.5 4.4 19.7 Shopping 買物代 cost 0.9 0.6 0.9 0.9 0.2 5.0 1.5 Others その他 10 cost 出所:観光庁「訪日外国人消費動向調査」2010年年次報告書 Source: Japan Tourism Agency 2010 Annual Report “Consumption Trend Survey for Foreigners Visiting Japan 5 Total amount of travel consumption by foreigners visiting Japan (by item) (5 major countries) 【Amount of travel consumption by item】 by major nationality Ten thousand yen 20 Others 18 16 Shopping cost 0.5 Others 0.1 Entertainment/service costs Transportation cost 14 Shopping cost 3.0 Dining cost 8.7 12 Entertainment/servi ce cost 0.7 Accommodation cost 0.1 Transportation cost 2.3 0.6 10 4.4 Dining cost 0.1 8 3.9 1.3 0.5 2.0 3.6 1.0 1.1 6 0.4 0.9 0.6 0.8 1.8 1.9 2.8 2.7 Korea (81000yen) Taiwan (104000yen) 2.5 2.5 4 2 Accommodation cost 6.2 3.7 3.2 0 Hong Kong(117000yen) China (177000yen) United States (159000yen) Source: Japan Tourism Agency 出所:観光庁「訪日外国人消費動向調査」2010年年次報告書 2010 Annual Report “Consumption Trend Survey for Foreigners Visiting Japan Example of output: Trend of travel consumption of Chinese people (number of visits to Japan and number of days) The rate of first visit is as high as 61.5% in the case of Chinese people The number of stays is usually 4-6 days for tourists 【Number of visits】 【Number of days】 0% 50% 100% 10th to 19th 20th time or time 3.3% more 4.2% 全目的 3.6 Sixth-Ninth time 3.9% Second-fifth times 27.2% 57.4 All purposes 観光・レジャー 1.7 78.3 Sightseeing/leisure First time 61.5% 35.5 業務 7.0 40.9 Business 3.5 19.9 0.2 47.3 4.8 3日間以内 4~6日間 7~90日間 91日以上1年未満 Up to 3 days 4-6 days 7-90 days 91 days to 1 year Source: Japan Tourism Agency 出所:観光庁「訪日外国人消費動向調査」2010年年次報告書 2010 Annual Report “Consumption Trend Survey for Foreigners Visiting Japan 6 Example of output: Trend of travel consumption of Chinese visitors (travel expenditure) Chinese tourists spend about 50% of the travel expenditure for shopping 【 Travel expenditure 】 Others 5,157 ( 2.9%) Unit:yen Accommodatio n cost 36,543 ( 20.7%) Shopping cost 86,752 ( 49.1%) Dining cost 25,393 ( 14.4%) Entertainment /service costs 12,601 ( 7.1%) Transportation cost 10,338 ( 5.8%) Total: 176,784円 Source: Japan Tourism Agency 出所:観光庁「訪日外国人消費動向調査」2010年年次報告書 2010 Annual Report “Consumption Trend Survey for Foreigners Visiting Japan Example of output: Trend of travel consumption of Chinese people (ranking of shopping) The most popular souvenirs the Chinese people purchase are cosmetics, medicines and toiletry products and about 65% of them purchase those products ◆Purchased products◆ (multiple answers) ◆Satisfied products purchased◆ (single answer) Unit price by purchaser (yen) Ranking of purchas e rate Items 1st Cosmetics,medicines,to iletry products 64.5 36,127 1st Cosmetics 20.6 2nd Confectioneries 58.2 11,611 2nd Fashion goods 14.8 3rd Otherfoods,Beverage, Liquor,Cigarette 40.1 16,831 3rd Camera 13.8 4th Clothing(other than kimono),Bag,Shoes 29.6 50,832 5th Camera,Videocamera, Watch 29.2 67,229 Ranking Sub-division of product 6th Electric appliances (personal computers, acoustic equipment) 21.1 55,652 1st Duty free shop at Airport 78.4 7th Kimono/Traditional craft products 11.6 14,901 2nd Department store 65.2 8th Comic/DVD/animation related products 6.4 11,225 3rd Supermarket/Shopping center 65.2 Respon se rate (%) Ranking Sub-division of product Response rate (%) ◆Place of shopping◆ (multiple answers) Response rate (%) Source: Japan Tourism Agency 出所:観光庁「訪日外国人消費動向調査」2010年年次報告書 2010 Annual Report “Consumption Trend Survey for Foreigners Visiting Japan 7
© Copyright 2026 Paperzz