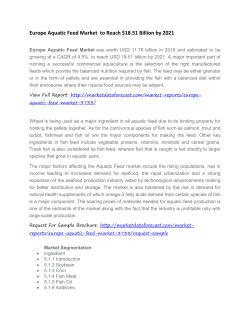
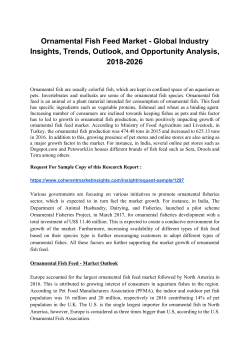
65
Scientia Africana, Vol. 11 (No.2), December 2012. Pp 65-73
© Faculty of Science, University of Port Harcourt, Printed in Nigeria
ISSN 1118 - 1931
THE EFFECT OF FEED TYPE ON THE GROWTH OF CATFISH (CLARIAGARIEPINUS) USING A 2K FACTORIAL DESIGN
P. E. Omosioni and M. P. Iwundu
Department of Mathematics and Statistics
University of Port Harcourt
Rivers State - Nigeria.
Received: 01-06-12
Accepted: 07-11-12
ABSTRACT
The effect of feed type on the growth of pond raised catfish (Clarias- garienpinus) is examined using a 2k
factorial design. A period of four weeks was used in experimentation. The four factors represent four feed
types namely Sharp, Coppens, Euro, Dizeng-golf. Analysis of the experiment reveal a great variation in
the growth for pond raised catfish using a combination of low level of Sharp, high level of Coppens, high
level of Euro, and high level of Dizeng-golf.
Key Words: feed types, 2k factorial design.
INTRODUCTION
In Nigeria, the development of aquaculture has
been identified as a national way of augmenting
the dwindling fish supply from capture fisheries.
The increased intensification of culture methods
for warm water fish such as tilapia and cat-fish
species has necessitated the provision of balance
rations to satisfy their dietary requirements.
Natural and artificial feeds are important in
aquaculture to promote body building and high
yields, particularly under intensive fish culture
systems where all nutrients are supplied in
complete feeds.
According to Krichgessner et al (1986),
the value of supplementary feeds depends on their
compositions and the digestibility of the
individual feed ingredient. Hence adequate
combinations of the various individual feed
components would enhance the digestibility and
utilization of mixed feeds. Investigations have
revealed that protein is the most important
component of fish feeds and should therefore be
adequately provided both in quantity and quality
in order to ensure protein of high biological value
in the formulation of feed which will support
optimum fish growth and yield (Hepher et al
(1979)).
Falaye and Akinyemi (1985) highlighted
that shortage of fish feed, constitutes one of the
major obstacles to accelerated fish production in
the country. Robison and Rushing (1994)
compared different feeding strategies for the pond
raised channel cat fish (once daily, every other
day (EOD), and once daily to half satiation ETD).
They reported that maximum production was
achieved by feeding to apparent satiation on a
daily basis. Further, they observed a 50% and
65% increase in feed consumption (on days feed)
of fish fed EOD or ETD, respectively, compared
with those fed daily. These data are partly
supported by those of Li et al (2004, 2006) in that
production tends to be highest when channel
catfish are fed daily to apparent satiation, and feed
conversion ratio (FRC) is improved when fish are
66
Omosioni, P. E. and Iwundu, M. P.; The Effect of Feed Type on the Growth of Catfish (Claria-Gariepinus)………
fed less than daily. The primary difference in the
three studies was the size of fish used. Robinson
and Rushing (1994) used larger fish (270-320
grams) whereas Li, et al (2004) used fish of about
93-grams, and Li et al (2006) used 64-grams fish.
An increase in fish harvest per unit area of
production can only be achieved by intensification
of the culture methods, which is accompanied by
increased addition of balanced supplementary
diets to the system. Under certain economic
circumstances catfish, producers (farmers) may
feed with low quality feed to reduce cost and
minimize economic losses. It is on this basis we
consider to conduct a 24 factorial experiment to
know the feed combination best suited to produce
good results within the shortest possible time.
MATERIALS AND METHODS
The data for this research work were obtained
from a simple designed 24 factorial experiment.
The 24 factorial experiment was conducted to
evaluate the effect of treatment combination on
the growth of catfish. Three sizes of catfish –
averaging 800, 600 and 500 grams per fish – were
stocked into 16 ponds with each pond measuring
2x1.5 meter square. The duration for the
experiment was one month. Each fish was fed to
apparent satiation with a commercial – 42%
protein feeds.
The four randomly selected feed types
namely Sharp, Coppens, Euro and Dizen-golf
were each at two – levels, namely low and high
levels. The low level of the factor is signified by
the use of 5 grams of the feed while the high level
of the factor is signified by the use of 10 grams of
the feed. Feeds were distributed into each pond
manually and the fishes were allowed to eat as
much as they would consume in 20 minutes to
achieve apparent satiation. The fishes were fed
twice daily 8.00am and 6.00pm and the amounts
of feed consumed by the fishes in each pond were
recorded daily. Observation on the body weight
and the length of individual fish was taken weekly
for the period of one month using two standard
scales and a measuring tape. Data on body weight
were analyzed using analysis of variance and
graphical techniques.
Data Presentation
The data collected on the weight of pond-raised
fish are summarized in table 1 below. The
treatment combinations are written in standard
order. The interpretation of the standard notation
is written alongside. The letter S represents Sharp
feed, C represents Coppens feed, E represents
Euro feed, D represents Dizeng-Golf feed, H
represents High level (10grams) and L represents
Low level (5grams).
67
Scientia Africana, Vol. 11 (No.2), December 2012. Pp 65-73
© Faculty of Science, University of Port Harcourt, Printed in Nigeria
ISSN 1118 - 1931
Table 1: Weight of Pond-Raised Fish over the Period of the Experiment
Treatment
Treatment
Combination
Treatment
Combination
Interpretation
Fish1
1
2
3
4
5
6
7
8
9
10
11
12
13
14
15
16
(1)
a
b
ab
c
ac
bc
abc
d
ad
bd
abd
cd
acd
bcd
abcd
SLCLELDL
SHCLELDL
SLCHELDL
SHCHELDL
SLCLEHDL
SHCLEHDL
SLCHEHDL
SHCHEHDL
SLCLELDH
SHCLELDH
SLCHELDH
SHCHELDH
SLCLEHDH
SHCLEHDH
SLCHEHDH
SHCHEHDH
Data Analysis
We employ the Yates’ algorithm for the analysis
of variance we also present some graphical
analysis. Considering the data in Table 1, columns
designated fish 1, fish 2 and fish 3 are
redesignated, Replicate I, Replicate II and
Replicate III, respectively, in table 2. The column
labeled “Response” contains the total of all
observations under the respective treatment
combinations. Since there are four factors in the
experiments, we shall create four columns labeled
Column1, Column2, Column3, and Column4.
The first half of column1 is obtained by adding
the responses in adjacent pairs. The second half of
column1 is obtained by changing the sign of the
first entry in each pairs in the response column
and adding the adjacent pairs. Column2 is
obtained from column1 in the same way as
column (1) is obtained from the response column.
Column (3) is obtained from column (2) and
column (4) is obtained from column (3) similarly.
50
100
200
125
75
100
200
150
50
100
200
100
75
100
300
200
Fish2
Fish3
125
100
125
100
100
125
175
100
100
75
150
150
125
100
150
125
100
125
125
150
100
150
125
100
75
125
150
125
75
125
200
175
Table 2 below is obtained using n = 3, k = 4 and
N = 48.
Hence,
n2k-1 = 24
n2k = 48
SSµ
=∑ y2ijk / N = 60752 = 36905625 =
48
48
768867.19
SST
=
502 + 1252 + …..1752 - SSµ
=
869375 – 768867.19 = 100507.81
SSE
=
SST – SSABCD –SSABC –SSABD –
SSACD –SS BCD – SSAB – SSAC – SSAD – SSBC –
SSCD – SSA –SS B –SS C – SSD
=
100507.81 – 325.52 – 325.52 – 13.02 –
13.02 – 1054.69 - 12513.02 – 117.19 – 117.19 –
638.02 – 4700.52 – 1575.52 - 1054.69 – 36575.52
– 3763.02 – 1054.69
=
3666.6
68
Omosioni, P. E. and Iwundu, M. P.; The Effect of Feed Type on the Growth of Catfish (Claria-Gariepinus)………
Table 2: Estimates of Effects and Sum of Squares Using Yates’ Algorithm
Treatment
Combination
Response
Column
Column
Column
Column
Effects
Estimate
of effects
col(k)÷
n2k-1
1
2
3
4
(1)
275
600
1425
2925
a
325
825
1500
b
450
650
ab
375
c
Estimate of
sum of
square
col(k)2÷n2k
6075
1
-
3150
-225
A
-9.38
1054.69
1400
-75
1325
B
55.21
36575.52
850
1750
-150
-775
AB
-32.29
12513.02
275
525
-25
425
425
C
17.71
3763.02
ac
375
875
-50
900
-75
AC
-3.13
117.19
bc
500
600
-50
-375
175
BC
7.29
638.02
abc
350
1150
-100
-400
-125
ABC
-5.21
325.52
d
225
50
225
75
225
D
9.38
1054.69
ad
300
-75
200
350
-75
AD
-3.13
117.19
bd
500
100
350
-25
475
BD
19.79
4700.52
abd
375
-150
550
-50
-25
ABD
-1.04
13.02
cd
275
75
-125
-25
275
CD
11.46
1575.52
acd
325
-125
-250
200
-25
ACD
-1.04
13.02
bcd
650
50
-200
-125
225
BCD
9.38
1054.69
abcd
500
-150
-200
0
125
ABCD
5.21
325.52
-
The analysis of variance is summarized in table 3 below. The normal probability plot of effects is
presented in Figure 1.
69
Scientia Africana, Vol. 11 (No.2), December 2012. Pp 65-73
© Faculty of Science, University of Port Harcourt, Printed in Nigeria
ISSN 1118 - 1931
Table 3: Anova Table for the 24 Factorial Experiment
SV
df
SS
MS
F-ratio
Trt A
1
1054.69
1054.69
0.92
Trt B
1
36575.52
36575.52
31.92 *
Trt C
1
3763.02
3763.02
3.28 **
Trt D
1
1054.69
1054.69
0.92
Inter AB
1
12513.02
12513.02
10.92 *
Inter AC
1
117.19
117.19
0.10
Inter AD
1
117.19
117.19
0.10
Inter BC
1
638.02
638.02
0.56
Inter BD
1
4700.52
4700.52
4.10 **
Inter CD
1
1575.52
1575.52
1.38
Inter ABC
1
325.52
325.52
0.28
Inter ABD
1
13.02
13.02
0.01
Inter ACD
1
13.02
13.02
0.01
Inter BCD
1
1054.68
1054.68
0.92
Inter ABCD
1
325.52
325.52
0.28
Error
32
36666.67
1145
-
Total
47
100507.81
-
-
f1,32 (0.05) = 4.17 ; f1,32 (0.10) = 2.88
* Significant at 5% Level ; ** Significant at 10% Level
70
Omosioni, P. E. and Iwundu, M. P.; The Effect of Feed Type on the Growth of Catfish (Claria-Gariepinus)………
P r o b a b ility P lo t o f E ffe c ts
Norm a l
99
M ean
S tD e v
N
AD
P - V a lu e
95
90
- 0 .0 1 9 3 3
2.122
15
0.733
0.044
Percent
80
70
60
50
40
30
20
10
5
1
- 5 .0
- 2 .5
Fig1:
0 .0
Effe c t s
2 .5
5 .0
Normal Probability Plot of Effects
The p-value 0.044 indicates that the effects are statistically significant. From the normal probability plot
of effects, we see that the effects that seem to be statistically significant are the main effects B and C and
the interaction effects AB and BD. These effects lie far away from the line.
We shall examine the graphs of main effects and interaction effects presented in Figure 2 below.
500
450
400
350
300
250
200
150
100
50
*
*
-
B
Fig. 2a: Graph of main effect B
+
71
Scientia Africana, Vol. 11 (No.2), December 2012. Pp 65-73
© Faculty of Science, University of Port Harcourt, Printed in Nigeria
500
450
400
350
300
250
200
150
100
50
ISSN 1118 - 1931
*
*
-
C
+
Fig. 2b: Graph of main effect C
500
450
400
350
300
250
200
150
100
50
*
*
-
D
Fig. 2c: Graph of main effect D
+
72
Omosioni, P. E. and Iwundu, M. P.; The Effect of Feed Type on the Growth of Catfish (Claria-Gariepinus)………
500
450
400
350
300
250
200
150
100
50
* +
B
*
*
* -
-
A
+
Fig. 2d: Graph of AB interaction
500
450
400
350
300
250
200
150
100
50
* +
*
D
*
*
-
B
+
Fig. 2e: Graph of BD interaction
The two effects B and C are positive, and if we
considered only these main effects, we would run
the two factors at the high level to maximize the
growth rate. However, it is always necessary to
examine any interactions that are significant since
the main effects do not have much meaning when
they are involved in significant interactions. The
AB and BD interactions have been plotted in
Figures 2d and 2e, respectively.
These
interactions are the key to solving the problem of
interest. We note from the graph of AB interaction
that the growth rate is very small when sharp feed
is at high level and very large when sharp feed is
at low level with the best result obtained with low
sharp feed and high coppens feed. The BD
interaction indicates that Dizeng-Golf feed has
little effect at low coppens feed but a large
positive effect at high coppens feed. The best
growth rates would appear to be obtained when B
and D are at the high level and A at the low level.
73
Scientia Africana, Vol. 11 (No.2), December 2012. Pp 65-73
© Faculty of Science, University of Port Harcourt, Printed in Nigeria
RESULTS
1.
2.
3.
4.
The average growth of fish as measured by
its weight is highest using low level of
sharp, high level of Coppens, high level of
Euro, and high level of Dizeng-golf.
The normal plot of effects and the analysis
of variance reveal that the effects are not
identical. In fact, the effects A, C, AB and
BD are significant.
Plots of AB and BD interaction effects
reveal that the best result is obtained with
low level of sharp feed and high levels of
Coppens and Dizeng-golf.
Overall performance shows that to
maximize the growth of pond-raised
catfish, feeds constituting of low level of
sharp, high level of Coppens, high level of
Euro and high level of Dizeng-golf should
be used.
CONCLUSION
A feed combination that is best suited for catfish
production has been examined. The combination
allows the fish to be fed from a variety of feeds.
Analysis of the experimental data reveal a great
variation in growth of pond raised catfish using a
combination of low level of sharp, high level of
Coppens, high level of Euro and high level of
Dizeng-golf.
REFERENCES
Falaye, A.E, and Akinyemi (1985)
“The
status of Aquaculture in Nigeria”
Proceeding of the consultative workshop on
village level aquaculture Development in
Africa. Freetown, Sierra leone.
Hepher, B, Sandbank, E. and Shelef, G. (1979)
“Alternative protein sources for warm
water fish diets” proc. World
ISSN 1118 - 1931
Symp. On finfish nutrition and fish feed
technology
Hamrug.
20-23
June
1978.Vol.Berlin 1978 328-337.
Kirchgessiner, M, Kurzinger, H. and Schwarz, FJ
(1986) “Digestibility of crude nutrients in
different feeds and Estimation of their
energy content for Carp (Cyprinus
Carpio)”Aquaculture Society.
Li, M. H, E. H. Robison, D. F. Oberie, and B.G.
Boswort (2006) “Effect of dietary protein
concentration and feeding regimen on
Channel
Catfish/ctalurus
puntatus
production” Journal of the World
Aquaculture Society.
Li, M. H, E. H. Robison, B. B. Manning and B.G
Boswort (2004) “Effect of dietary protein
concentration production characteristics of
pond-raised channel catfish feed once daily
or once every other day to satiation-North”
America Journal of Aquaculture 66:184190.
Robinson, E. H, M. H. Li, and B. B. Manning
(2001) A practical guide to nutrition, feed,
and feedings, 2nd revision.
Agricultural and Forestry Experiment Station
Bulletin No. 1113. Mississippi State,
Mississippi.
© Copyright 2026 Paperzz