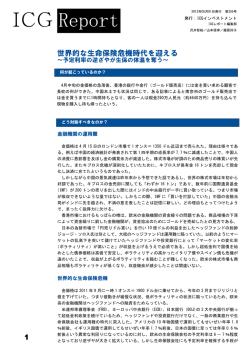
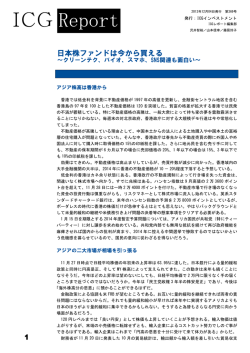
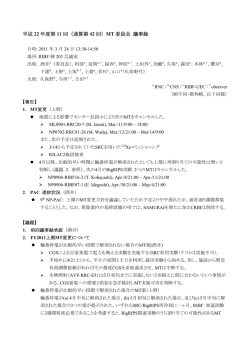
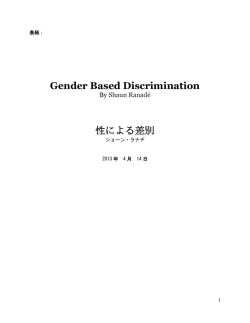
特 集 平成15年工業統計調査結果速報 2004 11 統 計 ぐ ん ま No.366 群馬県総務局統計課 目 次 CONTENTS 特 集 指 標 1 本県主要指数 2 全国主要指数 Feature Key Statistics Key Statistics of Gunma Key Statistics of Japan 人 口 Population 3 市町村別世帯数及び人口 Households & Population by District 4 世帯数及び人口の推移 Growth of Households & Population 5 県外転出入人口 Number of In-migrants and Out-migrants by Origin of Destination by Prefecture 6 人 口 動 態 Vital Statistics 物 価 Prices 7 消費者物価指数 (群馬県) Consumer Price Indexes of Gunma 8 消費者物価指数 (全国) Consumer Price Indexes of Japan 9 主要品目平均小売価格(前橋市) Retail Price of Major Items (Maebashi-shi) 家 計 Family Income and Expenditure 10 一世帯当たり一ヶ月間の収入と支出(勤労者世帯) Average Monthly Receipts and Disbursements per Household (Worker's households) 11 一世帯当たり一ヶ月間の収入と支出(全世帯) Average Monthly Receipts and Disbursements per Household (All households) 労 働 Labour 12 産業別労働者1人平均賃金 Average Monthly Cash Earnings per Regular Workers by Industry 13 産業別賃金指数 Wage Indexes of Regular Workers by Industry 14 産業別雇用指数 Employment Indexes of Regular Workers by Industry 15 労働者数、労働時間、出勤日数 Regular Workers, Hours Worked and Days Worked by Industry 16 一般労働者の職業紹介状況 Employment Security Activities from General Workers 17 求職者給付支給状況 Payment for General Persons Seeking Jobs 電気・ガス・石油 Energy 18 電 気 Electricity 19 ガ ス の 消 費 量 Consumption of Gas 20 石 油 販 売 量 Sales of Petroleum 鉱 工 業 Mining and Manufacturing 21 鉱工業生産指数 Indices of Industrial Production 22 鉱工業生産者出荷指数 Indices of Producer's Shipments 23 鉱工業生産者製品在庫指数 Indices of Producer's Industrial Inventories 農 林 業 Agriculture and Forestry 24 生乳生産量と処理状況 Production and Supply of Raw Milk 25 素材・製材・合板価格 Price of Log, Sawlog and Plywood 1 4 4 6 8 8 9 10 10 26 製材用素材・製材品の需給状況 Demand and Supply of Log and Sawlog 21 運 輸 ・ 商 業 Transport and Domestic Trade 27 自動車保有台数 Motor Vehicles Owned 28 大型小売店販売額 Large Scale Retail Store Sales 21 21 金 融 Finance 29 業態別実質預金 Real Deposits by Type 30 業 態 別 貸 出 金 Loans and Discounts Outstanding by Type 31 手 形 交 換 状 況 Clearing of Bills 32 企 業 倒 産 状 況 Case of Bankruptcy 33 信用保証協会保証状況 Credit Guarantee Association 気 象 Climate 34 前橋地方気象台気象 Climate of Maebashi Local Meteorological Observatory 35 地域別月平均気温 Average Monthly Temperature by Area 22 22 22 23 23 24 24 11 12 13 14 住 宅 Housing 36 着工建築物建築主別状況 Building Construction Started by Type of Investor 37 着工新設住宅利用関係別・種類別状況 New Housing Construction Started by Type of Owner Occupant Relation and Kind 25 26 公 共 工 事 Public Construction 38 発注者組織別公共工事着工 Public Construction Started by Orders 27 社 会 保 障 Social Security 39 生活保護実施状況 Public Livelihood Aid 27 15 15 16 16 16 災 害 及 び 事 故 Disasters and Accidents 40 犯罪の認知件数と検挙状況 Number of Cases Known to Police and Cleared 41 交通事故の発生件数と死傷者数 Number of Traffic Accidents and Casualties 42 火災の発生状況 Cases of Fires 景 気 Business Conditions 43 景 気 動 向 指 数 Indexes of Business Conditions 17 17 17 18 18 18 20 20 統計表中の符号の用法は次のとおりである。 The following symbols are used in the tables. 「−」 該当なし 「−」 Figures no applicable 「…」 不 詳 「…」 Figures not available 「0」 単位未満 「0」 Less than half of unit 「x」 秘匿数値 「x」 Figures kept secret 「r」 訂正数値 「r」 Revised figures 「△」 減 少 「△」 Decrease 「p」 速報数値 「p」 Provisional figures 27 28 28 28 特 集 平成15年工業統計調査結果速報 工業統計調査は、経済産業省所管のもとに、製造業を営む事業所を対象として事業所数、従業者数、 製造品出荷額等及び付加価値額などを調査して、工業の実態を明らかにすることを目的として毎年12 月31日現在で実施されています。 以下は、平成15年12月31日現在で実施された調査の結果を速報としてまとめたものです。 (この速報は、従業者4人以上の事業所について集計したものです。) 1 事業所数 事業所数は、前年と比べ235事業所増(3.3%)の7,251事業所となりました。 部門別では、重化学工業が前年と比べ118事業所増の3,743事業所(構成比51.6%)、軽工業が117事業所増の 3,508事業所(48.4%)となりました。 産業別では、「金属製品」「衣服」など16業種で増加し、「電気機器」「情報通信」「石油・石炭」の3業種で減少となり ました。 規模別の構成は、「4∼29人」が6,096事業所(構成比84.1%)、「30∼99人」が774事業所(10.7%)、「100人以 上」が381事業所(5.2%)となりました。 また、市町村別では、太田市の648事業所(構成比8.9%)、桐生市の629事業所(8.7%)、前橋市の589事業所 (8.1%)、高崎市の563事業所(7.8%)、伊勢崎市の493事業所(6.8%)の順となりました。 産業別事業所数構成比 太田市 8.9% 機械 13.6% 他の産業 20.9% 窯業・土石 3.9% 市郡別事業所数構成比 軽工業 48.4% 衣服 6.7% プラスチック 8.3% 食料品 8.6% 他の市町村 59.7% 金属製品 13.1% 重化学 工業 51.6% 他の産業 9.4% 桐生市 8.7% 郡部計 42.1% 輸送機器 9.2% 電気機器 6.4% 前橋市 8.1% 市部計 57.9% 高崎市 7.8% 伊勢崎市 6.8% 注1:文章及びグラフの比率は、区分ごとに表示単位未満を四捨五入しているため、区分ごとに足し上げた数値が 合計等と合わないことがあります(以下同様)。 2 従業者数 従業者数は、前年と比べ2,358人減(▲1.1%)の21万5,189人となりました。 部門別では、重化学工業が前年と比べ2,549人減の13万8,981人(構成比64.6%)、軽工業が191人増の7万6,208人 (35.4%)となりました。 産業別では、「輸送機器」「飲料・飼料」など12業種で増加し、「電気機器」「電子部品」など12業種で減少となりまし た。 -1- 規模別の構成は、「4∼29人」が6万4,365人(構成比29.9%)、「30∼99人」が4万1,843人(19.5%)、「100人以上」が 10万8,981人(50.6%)となりました。 また、市町村別では、太田市の2万2,755人(構成比10.6%)、前橋市の2万95人(9.3%)、高崎市の1万8,256人 (8.5%)、大泉町の1万8,062人(8.4%)、伊勢崎市の1万5,717人(7.3%)の順となりました。 産業別従業者数構成比 他の産業 13.4% 市郡別従業者数構成比 太田市10.6% 輸送機器 19.3% 他の市町村 55.9% 窯業・土石 2.2% 衣服 2.4% プラスチック 7.0% 軽工業 35.4% 前橋市 9.3% 郡部計 43.3% 機械 11.8% 重化学工業 64.6% 食料品 10.5% 大泉町 8.4% 電子部品 9.1% 他の産業 16.0% 高崎市 8.5% 市部計 56.7% 伊勢崎市 7.3% 電気機器 8.4% 3 製造品出荷額等 製造品出荷額等は、前年と比べ564億円増(0.8%)の7兆2,856億円となりました。 部門別では、重化学工業が前年と比べ628億円増の5兆2,432億円(構成比72.0%)、軽工業は63億円減の2兆 424億円(28.0%)となりました。 産業別では「輸送機器」「飲料・飼料」など12業種で増加しましたが「食料品」「機械」など12業種で減少となりました。 規模別の構成は、「4∼29人」が8,454億円(構成比11.6%)、「30∼99人」が1兆1,557億円(15.9%)、「100人 以上」が5兆2,845億円(72.5%)となりました。 また、市町村別では、太田市の1兆2,668億円(構成比17.4%)、大泉町の8,108億円(11.1%)、伊勢崎市の6,2 16億円(8.5%)、高崎市の5,680億円(7.8%)、前橋市の5,146億円(7.1%)の順となりました。 産業別製造品出荷額等構成比 市郡別製造品出荷額等構成比 他の産業 9.7% 太田市17.4% プラスチック 4.8% 飲料・飼料 6.2% 食料品 7.3% 他の市町村 41.2% 輸送機器 30.0% 軽工業 28.0% 郡部計 41.9% 重化学工業 72.0% 他の産業 9.1% 化学 5.3% 電気機器 7.8% 大泉町 11.1% 市部計 58.1% 伊勢崎市 8.5% 機械 10.5% 邑楽町 3.4% 電子部品 9.3% 桐生市 3.5% -2- 高崎市 7.8% 前橋市 7.1% 4 付加価値額(従業者29人以下の事業所は粗付加価値額) 付加価値額は、前年と比べ360億円増(1.4%)の2兆6,021億円となりました。 部門別では、重化学工業が前年と比べ196億円増の1兆7,960億円(構成比69.0%)、軽工業は164億円増の 8,061億円(31.0%)となりました。 産業別では、「電気機器」「飼料・飲料」など12業種で増加しましたが、「輸送機器」「食料品」など12業種で減 少となりました。 規模別の構成は、「4∼29人」が4,170億円(構成比16.0%)、「30∼99人」が4,498億円(17.3%)、「100人以上」 が1兆7,353億円(66.7%)となりました。 また、市町村別では、太田市の3,523億円(構成比13.5%)、高崎市の2,613億円(10.0%)、大泉町の2,538億 円(9.7%)、伊勢崎市の2,502億円(9.6%)、前橋市の1,705億円(6.6%)の順となりました。 産業別付加価値額構成比 他の産業 11.7% 飲料・飼料 5.7% プラスチック 5.6% 太田市13.5% 輸送機器 23.1% 他の市町村 43.3% 高崎市 10.0% 軽工業 31.0% 食料品 8.0% 重化学工業 69.0% 電気機器 7.0% 郡部計 42.2% 機械 12.6% 他の産業 9.5% 表1 市郡別付加価値額構成比 電子部品 9.1% 市部計 57.8% 桐生市 3.5% 邑楽町 3.6% 化学 7.8% 大泉町 9.7% 伊勢崎市 9.6% 前橋市 6.6% 年次別事業所数、従業者数、製造品出荷額等、付加価値額(従業者4人以上の事業所) (指数:平成12年=100) 年 事 業 所 数 従 業 者 数 製造品出荷額等 付 加 価 値 額 (従 業 者 29人 以 下 の 事 業 所 は 、粗 付 加 価 値 額 ) 増減率 指数 (%) 次 増減率 (人) 指数 (%) 増減率 (万円) 指数 (%) 増減率 (万円) 指数 (%) 5 9,553 0.1 117.2 258,086 ▲2.4 109.1 812,924,402 ▲4.8 101.3 276,485,606 ▲4.2 95.7 6 8,976 ▲6.0 110.1 249,989 ▲3.1 105.6 807,282,765 ▲0.7 100.6 289,284,675 4.6 100.2 7 9,120 1.6 111.8 248,281 ▲0.7 104.9 784,812,899 ▲2.8 97.8 269,113,981 ▲7.0 93.2 8 8,647 ▲5.2 106.0 247,983 ▲0.1 104.8 803,701,371 2.4 100.2 288,117,103 7.1 99.8 9 8,312 ▲3.9 101.9 244,649 ▲1.3 103.4 839,988,128 4.5 104.7 295,098,416 2.4 102.2 10 8,753 5.3 107.3 244,727 0.0 103.4 808,508,840 ▲3.7 100.7 284,055,987 ▲3.7 98.4 11 8,123 ▲7.2 99.6 238,465 ▲2.6 100.8 806,821,023 ▲0.2 100.5 289,277,137 1.8 100.2 12 8,154 0.4 100.0 236,629 ▲0.8 100.0 802,494,710 ▲0.5 100.0 288,794,478 ▲0.2 100.0 13 7,516 ▲7.8 92.2 229,181 ▲3.1 96.9 777,861,936 ▲3.1 96.9 265,879,723 ▲7.9 92.1 14 7,016 ▲6.7 86.0 217,547 ▲5.1 91.9 722,916,694 ▲7.1 90.1 256,614,860 ▲3.5 88.9 15 7,251 3.3 88.9 215,189 ▲1.1 90.9 728,561,245 0.8 90.8 260,211,862 1.4 90.1 -3- 1 本 県 主 要 指 標 人 口 常 用 雇用者数 年 月 Population Year and month 総 数 Total (1) Number of regular workers 社会増 自然増 Migration Natural increase increase 雇用指数 Employment indexes of regular workers 全 産 業 平均賃金 名 目 賃金指数 鉱工業生産指数 (季節調整済指数) Average monthly cash earnings per worker Nominal wage indexes of regular workers Indexes of Industrial production 平成12年 (2) (2000)=100(3) 平成12年 (4) (¥) 平成12年(2000)=100 (6) 鉱工業 Mining & (2000)=100(5) manufacturing 製造工業 Manufacturing 平成13年 (2001) 平成14年 (2002) 人 2,031,372 2,031,975 人 3,063 △ 2,489 人 3,457 3,092 人 355,985 345,431 101.4 102.5 円 382,533 372,494 99.4 95.8 90.1 85.9 90.1 85.9 15(2003) 11月 12月 16(2004) 1月 2月 3月 4月 5月 6月 7月 8月 9月 10月 2,034,085 2,034,321 2,033,994 2,033,801 2,034,189 2,031,415 2,034,368 2,034,979 2,035,477 2,034,079 2,033,739 2,033,744 102 △ 353 40 556 △ 2,675 2,874 528 182 △ 1,714 △ 731 △ 272 … 134 26 △ 233 △ 168 △ 99 79 83 316 316 391 277 … 339,078 337,746 404,958 403,784 401,676 410,256 408,964 408,577 407,081 406,178 … … 106.0 106.0 103.7 103.4 102.9 105.1 104.7 104.6 104.3 104.0 … … 312,517 711,121 307,741 296,282 308,624 296,064 296,759 487,147 459,082 301,900 … … 77.3 175.5 80.2 77.2 80.4 77.2 77.4 127.0 119.7 78.7 … … 87.1 87.1 95.3 89.7 91.8 87.4 94.1 91.6 93.2 94.7 … … 87.0 87.1 95.3 89.7 91.8 87.4 94.1 91.6 93.2 94.7 … … 資 Nov Dec Jan Feb Mar Apr May Jun Jul Aug Sep Oct 料 群馬県統計課 Gunma Prefectural Government Office Sources 2 全 国 主 要 指 標 人 口 年 月 人口動態 労働力人口 Vital Statistics (16) Labour force (17) 出生児数 死亡者数 就業者 Population Year and month (15) Live births Deaths Employed Persons 雇用指数 賃金指数 Employment Wage indexes of regular workers 完全失業者 indexes of Totally unemployed persons regular workers 名 平成12年 (1,000persons) 平成13年 (2001) 平成14年 (2002) 15(2003) 9月 10月 11月 12月 16(2004) 1月 2月 3月 4月 5月 6月 7月 8月 資 料 Sep Oct Nov Dec Jan Feb Mar Apr May Jun Jul Aug 平成12年(2000)=100 (19) (1,000persons) (1,000persons) (10,000persons) (10,000persons) (2000)=100(18) 目 Nominal 実 質 Real 全 産 業 平均賃金 Average monthly cash earnings per worker (20) (¥) 千人 127,291 127,435 千人 1,185 1,176 千人 966 980 万人 6,412 6,330 万人 340 359 99.0 97.7 99.3 96.4 100.2 98.4 円 397,366 387,638 127,572 127,619 127,628 127,671 127,524 127,657 127,590 127,650 127,564 127,676 p127,670 p127,610 97 97 89 99 92 88 94 92 r93 92 100 ・・・ 75 83 83 93 100 93 92 84 r83 76 80 ・・・ 6,346 6,337 6,323 6,307 6,221 6,209 6,279 6,354 6,389 6,374 6,373 6,395 346 343 330 300 323 330 333 335 319 309 318 314 96.3 96.1 96.1 96.1 95.8 95.7 95.4 96.8 96.9 97.0 97.0 96.8 77.0 77.7 81.1 185.8 78.7 76.6 79.6 78.4 77.0 142.1 112.2 80.1 78.7 79.4 83.3 190.6 81.0 78.8 81.7 80.5 78.9 145.3 115.2 82.1 311,737 314,442 328,992 753,876 310,321 302,156 314,058 309,070 303,464 560,519 442,574 316,012 総務省統計局 厚生労働省 総務省統計局 厚生労働省 Statistics Bureau Ministry of Public Ministry of Public Ministry of Health, Management, Home Management, Home Sources Ministry of Health, Labour and Welfare Labour and Welfare Affairs, Posts and Affairs, Posts and Telecommunications Telecommunications 注 年別数字の(1),(15)は10月1日現在、(10)(25)は年度平均、(11)(12)(26)(27)は12月末、(13)(14)は合計数。 (2)(3)(4)(5)(18)(19)(20)の数字は規模30人以上の事業所。月別数字の(1)(15)は1日現在。 Statistics Bureau - 4 - 1 Key Statistics of Gunma 消費者物価指数 Consumer price Indexes 平成12年(2000)=100 総 合 食 料 General Food (7) (8) 家計収支(前橋市) 一般職業紹介状況 実質預金 貸出金 Family income and expenditure Employment security (Maebasi-shi) (9) 全 世 帯 消費支出 勤労者世帯 消費支出 Monthly living Monthly living expenditures per expenditures per worker's all household(¥) household(¥) activities for Real Deposits general workers (10) Loans & Discounts 手 形 交換高 不 渡 手形高 Clearings of bills Dishonored of bills (13) (14) Outstanding 新規求人 新規求職 New openings New (11) (12) applications (¥ 100 million) (¥ 100 million) (¥ million) (¥ million) 99.3 98.3 99.7 99.4 円 297,507 299,003 円 313,539 319,402 人 6,643 7,229 件 7,090 7,771 億円 104,577 104,465 98.3 98.4 98.1 98.1 98.1 98.1 98.1 98.1 97.9 97.9 98.0 … 97.8 98.6 99.5 100.3 100.1 99.5 99.6 99.7 99.2 98.7 98.7 … 257,285 310,928 246,243 226,175 284,895 248,008 223,215 250,790 326,840 262,575 … … 263,097 332,392 271,102 235,774 278,039 277,809 240,248 223,627 302,598 284,020 … … 9,884 8,939 10,314 9,249 9,746 9,708 7,723 8,057 10,451 10,004 … … 5,562 5,549 7,561 6,903 8,332 9,276 5,982 5,861 5,640 5,556 … … 104,020 105,106 104,009 103,896 103,116 104,090 104,243 p105,236 104,866 104,857 p104,213 … 億円 百万円 62,071 2,088,740 61,366 1,856,191 60,511 61,555 60,975 60,966 60,221 59,697 59,631 p59,733 59,885 59,576 p59,994 … 百万円 8,972 5,365 104,568 164,288 129,005 128,798 181,136 136,249 136,100 147,505 105,719 173,599 145,795 … 206 264 352 179 171 192 237 210 58 349 256 … 総務省統計局 群馬労働局 日本銀行前橋支店 群馬県銀行協会 Statistics Bureau Ministry of Public Management, Home Affairs Posts and Telecommunications Gunma Labor Bureau The Bank of Japan Gunma Bankers association 2 Key Statistics of Japan 鉱工業生産指数 (季節調整済指数) 国内企業 物価指数 Indexes of industrial Domestic corporate goods price index (22) production (21) 平成12年(2000)=100 鉱工業 製造工業 Mining and Manufacturing Manufacturing 平成12年 (2000)=100 家計消費支出 消 費 者 (勤労者世帯) 物価指数 Monthly living expenditures per worker's households (23) (¥) 93.2 92.0 93.2 92.0 97.7 95.7 円 335,042 330,651 96.4 97.5 98.8 98.2 101.0 97.2 97.8 101.2 102.0 100.7 100.7 100.8 96.4 97.5 98.8 98.2 101.1 97.1 97.8 101.1 102.0 100.6 100.7 100.9 94.9 94.7 94.8 94.9 95.0 95.3 95.5 95.7 95.7 96.0 96.4 p96.5 315,887 322,098 307,084 383,037 329,574 314,355 348,152 366,027 322,716 308,104 335,623 327,142 経済産業省 日本銀行 Ministry of Economy, Trade and Industry The Bank Of Japan Consumer price index 平成12年 (2000)=100 (24) 総務省統計局 一般職業紹介 日本銀行主要勘定 国内銀行主要勘定 Employment security activities for general workers (25) Accounts of the Bank Banking accounts of of Japan (26) Domestically licensed(27) 新規求人 新規求職 New openings 銀行券 発行高 Bank notes New issued application 貸付金 Loans 預 金 Deposits 貸出金 Loans & bills discounted outstanding (1,000persons) (1,000cases) (¥ 100 million) (¥ 100 million) (¥ 100 million) (¥ 100 million) 99.3 98.4 千人 582 614 千件 606 638 億円 690,042 754,718 億円 8,161 1,931 億円 4,897,859 5,044,469 億円 4,482,233 4,316,425 98.3 98.3 97.8 97.9 97.7 97.7 97.9 97.9 98.0 98.2 97.9 98.0 726 784 654 606 774 743 869 774 655 739 752 729 616 628 473 499 692 587 703 840 579 579 540 520 700,632 706,309 709,523 769,096 715,100 713,872 714,032 732,269 711,137 715,284 716,888 716,426 1,711 1,681 1,631 1,411 1,461 1,461 1,411 1,411 1,461 1,461 1,411 1,461 5,140,904 5,072,130 5,133,491 5,141,813 5,110,064 5,134,742 5,220,138 5,207,776 5,236,961 5,208,364 5,196,299 5,182,666 4,137,209 4,086,598 4,114,304 4,138,534 4,108,071 4,098,286 4,116,938 4,044,596 4,025,947 4,017,865 4,030,259 4,020,628 厚生労働省 Statistics Bureau Ministry of Public Ministry of Health, Management, Home Affairs, Labour and Welfare Posts and Telecommunications 日本銀行 The Bank of Japan Note. Yearly figures :(1)(15)as of 1st Oct.(10)(25)average of fiscal year.(11)(12)(26)(27)refer to end of Dec. (13)(14)refer to year total.(2)(3)(4)(5)(18)(19)(20)Estabilishments with 30 or more regular workers. - 5 - 3 市町村別世帯数及び人口 Source: Gunma Prefectural Government Office 平成16年9月中 October.1,2004 September.1,2004−September.30,2004 市 町 村 人口 世帯数 対前月増減 自然増 社会増 Increase over previous month Natural increase Migration increase Population District 総 数 市 部 総 数 前 橋 高 崎 桐 生 伊 勢 崎 太 田 沼 田 館 林 渋 川 藤 岡 富 岡 安 中 市 市 市 市 市 市 市 市 市 市 市 郡 部 総 数 勢 多 北 橘 赤 城 富士見 大 胡 宮 城 粕 川 新 里 黒保根 東 郡 村 村 村 町 村 村 村 村 村 男 女 Total Male Female All shi 472,761 1,253,047 Maebashi‐shi Annaka‐shi 110,863 95,363 42,397 49,697 57,789 16,291 28,929 17,063 21,594 16,499 16,276 284,099 242,671 111,172 130,535 151,679 45,562 79,591 48,110 63,138 49,244 47,246 All gun 259,231 780,697 386,307 31,442 2,839 3,505 6,926 5,371 2,373 3,522 4,943 893 1,070 104,069 10,184 12,157 22,367 17,090 8,466 11,564 16,563 2,652 3,026 27,189 7,022 1,521 6,060 12,586 Kiryu‐shi Isesaki‐shi Ota‐shi Numata‐shi Tatebayashi‐shi Shibukawa‐shi Fujioka‐shi Tomioka‐shi Seta‐gun Kitatachibana -mura Akagi‐mura Fujimi‐mura Ogo‐machi Miyagi‐mura Kasukawa‐mura Niisato‐mura Kurohone‐mura Azuma‐mura Gunma‐gun 北 群 馬 子 持 小野上 伊香保 榛 東 吉 岡 Kitagunma‐gun 多 野 郡 新 町 鬼 石 町 吉 井 町 上 野 村 神 流 町 総数 Gunma-ken 群 馬 郡 榛 名 町 倉 渕 村 箕 郷 町 群 馬 町 郡 村 村 町 村 町 Households 世帯 人 人 人 731,992 2,033,744 1,002,992 1,030,752 Takasaki‐shi Haruna‐machi Kurabuchi‐mura Misato‐machi Gunma-machi Komochi‐mura Onogami‐mura Ikaho‐machi Shintou‐mura Yoshioka‐machi Tano‐gun Shin‐machi Onishi‐machi Yoshii‐machi Ueno‐mura Kanna‐machi 資料:県統計課 平成16年10月1日現在 人 5 人 277 人 △ 272 △ 170 236 △ 406 △ 130 39 △ 93 20 94 △ 14 △ 89 △ 15 27 0 △ 9 29 51 △ 11 44 89 △ 3 13 15 3 0 6 △ 159 △ 12 △ 82 △ 24 5 △ 11 △ 102 △ 30 24 0 △ 15 394,390 175 41 134 51,327 5,031 6,057 11,044 8,414 4,084 5,725 8,249 1,291 1,432 52,742 5,153 6,100 11,323 8,676 4,382 5,839 8,314 1,361 1,594 17 △ 7 △ 11 1 12 0 7 23 △ 4 △ 4 5 △ 1 △ 6 8 3 △ 2 1 9 △ 5 △ 2 12 △ 6 △ 5 △ 7 9 2 6 14 1 △ 2 82,245 21,964 4,506 19,340 36,435 40,278 10,602 2,218 9,527 17,931 41,967 11,362 2,288 9,813 18,504 △ 3 1 △ 3 26 △ 27 37 9 2 7 19 △ 40 △ 8 △ 5 19 △ 46 15,790 3,593 590 1,814 4,191 5,602 49,669 11,913 2,074 3,890 13,922 17,870 24,433 5,841 994 1,795 7,027 8,776 25,236 6,072 1,080 2,095 6,895 9,094 64 △ 1 9 9 11 36 12 △ 3 1 △ 5 7 12 52 2 8 14 4 24 18,119 4,991 2,354 8,282 1,326 1,166 49,664 12,563 6,941 25,140 2,142 2,878 24,652 6,243 3,326 12,315 1,397 1,371 25,012 6,320 3,615 12,825 745 1,507 29 44 △ 12 13 △ 3 △ 13 2 11 △ 6 △ 1 △ 1 △ 1 27 33 △ 6 14 △ 2 △ 12 - 6 - 616,685 138,744 119,233 53,710 65,205 76,583 22,010 39,799 23,414 31,018 24,010 22,959 636,362 145,355 123,438 57,462 65,330 75,096 23,552 39,792 24,696 32,120 25,234 24,287 3 Households&Population by District Source: Gunma Prefectural Government Office 資料:県統計課 平成16年10月1日現在 平成16年9月中 September.1,2004−September.30,2004 October.1,2004 市 町 村 世帯数 人口 対前月増減 自然増 社会増 Increase over previous month Natural increase Migration increase Population District 甘 楽 妙 義 下仁田 南 牧 甘 楽 郡 町 町 村 町 Kanra‐gun Myougi‐machi Shimonita‐machi Nanmoku‐mura Kanra‐machi 碓 氷 郡 松井田町 Usui‐gun 吾 妻 中之条 東 吾 妻 長野原 嬬 恋 草 津 六 合 高 山 郡 町 村 町 町 村 町 村 村 Agatsuma‐gun 利 根 白 沢 利 根 片 品 川 場 月夜野 水 上 新 治 昭 和 郡 村 村 村 村 町 町 村 村 Tone‐gun 佐 波 赤 堀 東 境 玉 村 郡 町 村 町 町 Sawa‐gun 新 田 尾 島 新 田 薮塚本 笠 懸 郡 町 町 町 町 Nitta‐gun Matsuida‐machi Nakanojou‐machi Azuma‐mura Agatsuma‐machi Naganohara‐machi Tsumagoi‐mura Kusatsu‐machi Kuni‐mura Takayama-mura Shirasawa‐mura Tone‐mura Katashina‐mura Kawaba‐mura Tsukiyono‐machi Minakami‐machi Niiharu‐mura Shouwa‐mura Akabori‐machi Azuma‐mura Sakai‐machi Tamamura‐machi Ojima‐machi Nitta‐machi Yabuzukahon‐machi Kasakake‐machi 山 田 郡 大間々町 Yamada‐gun 邑 楽 板 倉 明 和 千代田 大 泉 邑 楽 Oura‐gun 郡 町 町 町 町 町 Omama‐machi Itakura‐machi Meiwa‐machi Chiyoda‐machi Oizumi‐machi Oura‐machi Households 総数 男 女 Total Male Female 世帯 10,585 1,452 3,534 1,303 4,296 人 32,672 4,873 10,328 3,041 14,430 人 15,955 2,424 5,091 1,439 7,001 人 16,717 2,449 5,237 1,602 7,429 人 45 14 25 10 4 人 △ 29 △ 6 △ 12 △ 8 △ 3 人 △ 16 △ 8 △ 13 △ 2 7 5,780 5,780 16,506 16,506 7,942 7,942 8,564 8,564 △ 2 △ 2 △ 6 △ 6 4 4 23,293 6,132 683 4,938 2,442 3,500 3,726 681 1,191 66,131 17,853 2,374 14,817 6,531 10,548 7,674 1,929 4,405 32,159 8,589 1,183 7,177 3,202 5,330 3,655 948 2,075 33,972 9,264 1,191 7,640 3,329 5,218 4,019 981 2,330 0 2 2 8 6 5 6 7 4 △ 12 3 0 △ 7 △ 4 0 △ 4 0 0 16,289 1,245 1,719 1,725 952 3,534 2,548 2,309 2,257 50,181 3,752 4,991 5,646 4,068 11,053 5,680 7,249 7,742 24,379 1,891 2,465 2,761 1,907 5,326 2,722 3,514 3,793 25,802 1,861 2,526 2,885 2,161 5,727 2,958 3,735 3,949 △ 8 8 △ 4 8 7 △ 16 △ 4 △ 1 △ 6 △ 9 3 2 △ 1 △ 2 △ 5 △ 4 △ 2 0 1 5 △ 6 9 9 △ 11 0 1 △ 6 36,973 6,125 7,015 10,289 13,544 110,423 18,807 22,017 31,226 38,373 55,143 9,553 11,007 15,764 18,819 55,280 9,254 11,010 15,462 19,554 109 67 63 △ 14 △ 7 3 8 0 △ 9 4 106 59 63 △ 5 △ 11 29,185 4,708 9,598 6,071 8,808 89,741 14,052 29,490 18,937 27,262 44,773 7,026 14,910 9,383 13,454 44,968 7,026 14,580 9,554 13,808 116 13 △ 16 34 85 24 △ 1 10 11 4 92 14 △ 26 23 81 7,556 7,556 21,558 21,558 10,495 10,495 11,063 11,063 △ 43 △ 43 2 2 △ 45 △ 45 37,030 4,720 3,515 3,632 16,302 8,861 107,838 15,924 11,345 11,674 41,190 27,705 54,771 7,918 5,649 5,806 21,509 13,889 53,067 8,006 5,696 5,868 19,681 13,816 △ 59 14 1 1 △ 51 △ 24 12 △ 4 △ 2 △ 1 15 4 △ 71 18 3 2 △ 66 △ 28 - 7 - △ △ △ △ △ △ △ △ 12 1 2 1 2 5 10 7 △ 4 △ △ △ △ 4 世帯数及び人口の推移 Growth of Households and Population Source: Gunma Prefectural Government Office 資料:県統計課 年 月 Year and month 世帯数 House- 15(2003) 11月 12月 16(2004) 1月 2月 3月 4月 5月 6月 7月 8月 9月 10月 Nov Dec Jan Feb Mar Apr May Jun Jul Aug Sep Oct Increase 増 減 Increase over 総 数 男 女 Total Male Female holds 平成14年 (2002) 平成15年 (2003) 人 口 Population 増 減 Previous 社会動態 Natural change Migration change 自然増 出 生 死 亡 社会増 転 入 転 出 Natural increase (2) (year)(1) month 世帯 人 714,875 2,031,975 723,407 2,033,535 人 人 1,002,039 1,029,936 1,003,080 1,030,455 724,335 724,992 725,093 725,275 726,118 726,631 730,577 731,546 733,056 731,968 731,665 731,992 1,003,303 1,003,333 1,003,018 1,002,911 1,002,857 1,000,960 1,002,779 1,002,888 1,002,916 1,002,872 1,003,000 1,002,992 2,034,085 2,034,321 2,033,994 2,033,801 2,034,189 2,031,415 2,034,368 2,034,979 2,035,477 2,034,079 2,033,739 2,033,744 自然動態 1,030,782 1,030,988 1,030,976 1,030,890 1,031,332 1,030,455 1,031,589 1,032,091 1,032,561 1,031,207 1,030,739 1,030,752 人 603 1,560 Live births Deaths Migration OutInincrease migrants migrants (3) 人 人 人 人 人 人 3,092 19,472 16,380 △2,489 90,550 93,039 △225 90,790 91,015 1,785 18,830 17,045 236 134 △ 327 26 △ 193 △ 233 388 △ 168 △2,774 △ 99 2,953 79 611 83 498 316 △1,398 316 △ 340 391 5 277 ・・・ ・・・ 1,321 102 5,832 5,730 1,466 △353 6,985 7,338 40 5,590 5,550 1,864 556 6,177 5,621 1,541 1,657 △2,675 14,198 16,873 2,874 12,568 9,694 1,402 1,363 528 6,113 5,585 182 6,382 6,200 1,213 1,193 △1,714 6,263 7,977 1,319 △731 6,992 7,723 1,303 △272 6,431 6,703 ・・・ ・・・ ・・・ ・・・ 1,455 1,492 1,631 1,373 1,558 1,481 1,446 1,529 1,509 1,710 1,580 ・・・ 注) 1 世帯数・人口の年別は10月1日、月別は1日現在である。 2 社会動態の増減には職権による処理が含まれている。 3 増減(1)は、その月(年)における自然増(2)と社会増(3)を足したものである。 4 表中の出生数は、住民基本台帳法及び外国人登録法による毎月1日から末日までの届出数であり、必ずしもその月中の出生数ではな い。(県統計課「群馬県移動人口調査」) 「6人口動態」においては、県内の市町村役場に届出のあったその月の出生数であるので、 これとは一致しない。 Note.1 Yearly figures are as of 1st Oct. and monthly figures are as of 1st each month. 2 “Migration increase” include those who were registered in the Basic Resident Registers by official. 3 (1)=(2)+(3) 5 県外転出入人口 Number of In-migrants and Out-migrants by Origin or Destination by Prefecture Source: Gunma Prefectural Government Office 転 出 8月 August 都道府県 実 数 比 率 転 入 In-migrants 8月 August 9月 September 都道府県 実 数 比 率 都道府県 実 数 比 率 Origin by prefecture 総 数 Total 国 外 埼 玉 東 京 神奈川 栃 木 千 葉 新 潟 茨 城 長 野 静 岡 その他 Outside Japan Saitama Tokyo Kanagawa Tochigi Chiba Niigata Ibaraki Nagano Shizuoka Others Actual Compofigures sition Origin by prefecture 人 % 3,796 100.0 総 数 Total 1,029 568 488 268 248 193 107 93 74 71 657 27.1 15.0 12.9 7.1 6.5 5.1 2.8 2.4 1.9 1.9 17.3 国 外 埼 玉 東 京 栃 木 神奈川 千 葉 長 野 愛 知 新 潟 茨 城 その他 Outside Japan Saitama Tokyo Tochigi Kanagawa Chiba Nagano Aichi Niigata Ibaraki Others Actual Compofigures sition Origin by prefecture 人 % 3,362 100.0 総 数 Total 1,017 474 421 224 202 150 94 85 82 75 538 30.2 14.1 12.5 6.7 6.0 4.5 2.8 2.5 2.4 2.2 16.0 国 外 埼 玉 東 京 栃 木 神奈川 千 葉 茨 城 長 野 新 潟 愛 知 その他 - 8 - Outside Japan Saitama Tokyo Tochigi Kanagawa Chiba Ibaraki Nagano Niigata Aichi Others Actual Compofigures sition 9月 September 都道府県 実 数 比 率 Origin by prefecture 人 % 4,543 100.0 総 数 Total 2,068 557 443 285 207 145 90 74 73 67 534 45.5 12.3 9.8 6.3 4.6 3.2 2.0 1.6 1.6 1.5 11.8 資料:県統計課 Out-migrants 国 外 埼 玉 東 京 栃 木 神奈川 千 葉 茨 城 愛 知 長 野 静 岡 その他 Outside Japan Saitama Tokyo Tochigi Kanagawa Chiba Ibaraki Aichi Nagano Shizuoka Others Actual Compofigures sition 人 % 3,627 100.0 1,083 577 443 255 199 170 102 92 84 66 556 29.9 15.9 12.2 7.0 5.5 4.7 2.8 2.5 2.3 1.8 15.3 6 人口動態 Vital Statistics Source: Ministry of Health, Labour and Welfare 出 生 数 年 月 死 亡 数 Live births Year and month 総 数 Total Deaths 男 女 Male Female 人 平成14年 (2002) 平成15年 (2003) 15(2003) 7月 Jul 8月 Aug 9月 Sep 10月 Oct 11月 Nov 12月 Dec 16(2004) 1月 Jan 2月 Feb 3月 Mar 4月 Apr 5月 May 6月 Jun 年 月 Year and month 人 (2002) (2003) 15(2003) 7月 Jul 8月 Aug 9月 Sep 10月 Oct 11月 Nov 12月 Dec 16(2004) 1月 Jan 2月 Feb 3月 Mar 4月 Apr 5月 May 6月 Jun 数 Total 人 男 女 Male Female 人 人 人 9,623 9,489 9,140 8,848 16,474 16,935 8,908 9,212 7,566 7,723 1,699 1,592 1,582 1,550 1,432 1,563 1,530 1,369 1,455 1,468 1,467 1,438 892 824 820 791 724 815 808 710 719 753 738 743 807 768 762 759 708 748 722 659 736 715 729 695 1,296 1,270 1,260 1,436 1,394 1,558 1,745 1,585 1,562 1,402 1,347 1,182 712 709 707 804 756 852 918 850 832 710 725 634 584 561 553 632 638 706 827 735 730 692 622 548 (再 掲) 乳児死亡数 新生児死亡数 (1歳未満) (生後4週未満) 自然増加数 死 産 数 婚 姻 数 離 婚 数 Foetal deaths Marriages Divorces Infant deaths Neonatal deaths Natural increase (under 4 weeks) 人 平成15年 総 18,763 18,337 (under 1 year) 平成14年 資料:厚生労働省 人 人 胎 件 件 67 67 43 44 2,290 1,402 553 571 11,571 11,245 4,309 4,250 9 10 5 3 4 5 5 0 5 3 5 6 7 6 4 2 3 3 2 0 3 1 1 4 403 322 322 114 38 5 △ 215 △ 216 △ 107 66 120 256 44 47 49 43 40 50 47 48 49 48 41 43 978 739 796 1,029 1,122 989 704 865 1,114 988 907 856 390 322 363 370 299 327 322 344 447 333 264 353 注) 1 年次の値は確定値である。 2 月次の値は概数値であり、次のものを集計し、該当月分として公表されたものである。 (1) 出生、死亡、死産については当該月に事件が発生したもので、翌月14日までに届出があったもの。 なお、その年に事件が発生し、各月の届出期限(1日∼翌14日)を過ぎたもので、当該月の翌月 14日までに届出があったものを含む。 (2) 婚姻、離婚については当該月に届出があったもの。 - 9 - 7 消費者物価指数(群馬県) Consumer Price Indexes of Gunma 平成12年(2000)=100 年 月 Source: Gunma Prefectural Government office 総 合 食 料 住 光熱・ 水道 居 家具・ 被服及び 家事用品 履き物 Fuel,light Furniture & Year and month 平成14年 平成15年 (2002) (2003) 15(2003)12月 16(2004) 1月 2月 3月 4月 5月 6月 7月 8月 9月 Dec Jan Feb Mar Apr May Jun Jul Aug Sep General 98.3 98.6 Food Housing & water charges household utensils Clothes & footwear 保健・ 医療 交通・ 通信 Medical Transportation Care & 教 育 資料:県統計課 教養・ 娯楽 諸雑費 Reading Miscell- Education & recreation aneous communication 99.4 99.1 97.6 98.9 98.8 98.6 95.6 93.8 93.3 90.8 99.1 102.4 99.4 100.7 102.5 102.8 95.7 96.1 101.4 102.2 98.4 98.6 98.1 99.5 98.1 100.3 98.1 100.1 98.1 99.5 98.1 99.6 98.1 99.7 97.9 99.2 97.9 98.7 98.0 98.7 99.6 99.9 99.9 99.3 99.5 99.1 99.0 98.9 99.0 99.0 98.6 98.5 98.5 98.5 98.2 98.2 98.2 98.3 98.6 99.0 90.9 91.0 90.5 90.6 90.7 90.1 90.0 89.8 89.5 89.5 91.5 86.4 84.3 87.2 88.6 88.5 87.4 84.4 82.6 87.1 103.4 103.4 103.4 103.3 102.5 102.6 102.6 102.6 102.1 102.0 99.8 99.3 98.6 98.0 98.3 98.5 99.3 99.5 99.7 100.5 102.8 102.8 102.8 102.8 103.6 103.7 103.7 103.7 103.7 103.7 95.2 93.4 93.8 94.6 94.5 94.7 94.6 95.3 97.1 95.3 102.7 102.5 102.6 102.5 102.5 102.4 102.5 102.7 102.1 101.9 0.0 0.4 0.0 5.4 △0.1 0.8 0.0 △1.9 △0.2 0.0 △0.4 0.3 △5.0 △5.1 △1.5 0.2 0.9 △1.5 △0.5 前月比(%) 0.1 Change from 0.0 Previous month 前年同月比(%) Change over the △0.8 year 8 消費者物価指数(全国) Consumer Price Indexes of Japan 平成12年(2000)=100 年 月 Source: Statistics Bureau, Ministry of Public Management, Home Affairs, Posts and Telecommunications 総 合 食 料 住 居 光熱・ 水道 家具・ 被服及び 家事用品 履き物 保健・ 医療 交通・ 通信 Clothes Medical Transportation & footwear Care & Fuel,light Furniture & Year and month 平成14年 平成15年 (2002) (2003) 15(2003)11月 12月 16(2004) 1月 2月 3月 4月 5月 6月 7月 8月 Nov Dec Jan Feb Mar Apr May Jun Jul Aug General Food Housing & water charges household utensils 教 育 資料:総務省統計局 教養・ 娯楽 諸雑費 Reading Miscell- Education & recreation aneous communication 98.4 98.1 98.6 100.1 98.4 100.0 99.4 98.9 92.9 90.1 95.6 93.8 99.5 102.9 98.5 98.6 102.1 102.7 94.9 93.5 100.0 100.9 97.8 97.9 97.7 97.7 97.9 97.9 98.0 98.2 97.9 98.0 97.4 97.8 99.1 99.6 99.4 98.8 99.0 99.4 98.5 98.5 99.9 99.9 99.8 99.9 99.9 99.9 99.8 99.8 99.8 99.7 99.0 99.0 98.8 98.8 98.8 98.6 98.6 98.8 98.9 99.0 89.2 88.8 88.3 87.9 87.8 87.6 87.4 87.1 86.8 86.6 96.4 96.1 89.7 88.1 91.0 94.5 95.7 95.4 91.7 89.9 103.7 103.6 103.5 103.6 103.5 102.7 102.8 102.8 102.7 102.7 98.2 98.2 97.9 97.6 97.8 97.7 97.9 98.5 98.8 99.2 102.8 102.8 102.8 102.8 102.8 103.5 103.6 103.6 103.6 103.6 92.2 92.7 91.4 91.3 91.9 92.0 92.0 92.0 92.9 94.8 101.7 101.7 101.6 101.7 101.6 101.7 101.4 101.4 101.3 101.3 0.1 0.0 △0.1 0.1 △0.2 △2.0 0.0 0.4 0.0 2.0 0.0 △0.2 0.5 △0.4 △0.1 △3.7 0.0 △1.2 0.2 0.8 △1.4 △0.3 前月比(%) Change from Previous month 前年同月比(%) Change over the year - 10 - 9 主要品目平均小売価格(前橋市) Retail Price of Major Items (Maebashi-shi) Source : Statistics Bureau, Ministry of Public Management, Home Affairs, Posts and telecommunications 資料:総務省統計局 品 目 ( 食 料 ) う る ち 米 食 パ ン 小 麦 粉 ま ぐ ろ い か 豚 肉 鶏 肉 ハ ム 牛 乳 鶏 卵 キ ャ ベ ツ ほうれんそう は く さ い ね ぎ だ い こ ん の り と う ふ 油 揚 げ こ ん に ゃ く し ょ う 油 み そ 砂 糖 カ ス テ ラ バ ナ ナ 緑 茶 か け う ど ん 中 華 そ ば カレーライス ( 住 居 ) 大 工 手 間 代 (光熱・水道) 灯 油 (被服及 び 履 物 ) ワ イ シ ャ ツ 毛 糸 男子背広服地 男 子 靴 婦 人 靴 洗 濯 代 (ワイシャツ) 洗 濯 代 ( 背 広 ) (交通・通信) 自動車ガソリン ( 諸 雑 費 ) 理 髪 料 パーマネント代 平成16年平成16年平成16年 (2004) (2004) (2004) 6月 7月 8月 Jun Jul Aug 円 円 円 Item and unit (¥) (food) 2,350 480 174 322 109 242 119 289 95 186 198 608 205 419 158 420 30 136 47 234 325 171 231 239 773 431 490 705 2,350 482 178 314 109 240 119 300 95 183 176 653 255 479 164 420 30 136 47 234 284 175 231 250 773 431 490 705 2,350 477 178 298 90 242 112 300 95 183 156 688 267 449 147 420 30 137 47 234 325 164 231 249 809 431 490 705 Non-glutinous rice,5kg 国内産、精米、単一品種(コシヒカリを除く) White bread,1kg 普通品 Wheat flour,1kg 薄力粉 Tuna fish,100g めばち、切身(刺身用)、赤身 Cuttle fish,100g するめいか Pork,100g ロース Chicken,100g ブロイラー、もも肉 Roast ham,100g ロースハム Fresh milk, 1本 1bottle 加工乳・特別牛乳及び乳飲料を除く、瓶詰(200cc入り瓶代を除く、配達1本月ぎめ) Hen eggs 1pack・10pieces 白色卵、Lサイズ Cabbage,1kg Spinach,1kg Chinese cabbage,1kg 山東菜を除く Welsh onions,1kg Radishes,1kg Dried laver,1帖,10sheets 焼きのり、中、1帖(10枚入り) Bean curd,100g 絹漉しを除く Fried bean curd,100g 薄揚げ “Konnyaku”, devil's-tongue jelly,100g 板こんにゃく Soy sauce,1本,1bottle 大手銘柄、濃口、本醸造、JAS規格品、ポリ容器入り(1㍑入り) Soybean paste,1袋,pouch 米みそ、並、袋入り(1kg入り) Sugar,1袋,pouch 上白、袋入り(1kg入り) “Kasutera”,sponge cakes,100g 長崎カステラ Bananas,1kg Green tea,100g せん茶、中 Japanese noodles,1杯,bowl 並 Chinese noodles,1杯,bowl ラーメン Curry and rice,1皿,dish (Housing) 24,000 24,000 24,000 Carpentering charges,1日,day 家屋修理手間代、常用1人分 (Fuel, light and water charges) 995 995 995 4,965 571 22,200 8,977 8,078 4,492 571 22,200 8,977 8,078 4,492 571 22,200 8,977 9,128 213 213 213 1,038 1,038 1,038 Kerosene,18 白灯油、詰め替え売り、配達 (Clothes and footwear) Men's business shirts,1枚,piece 長袖、シングルカフス、ポリエステル、綿混紡、白、標準タイプ、普通品 Woolen yarn,50g 毛100%、玉巻、[長さ]190∼210m、中級品 Men's suit material,1m ウーステッド(毛100%)、48∼60番手双糸程度、中級W幅 Men's shoes (Leather),1足,pair 短靴、黒(甲)牛革、(底)合成ゴム又はウレタン張付底、25∼24cm程度、中級品 Women's shoes (Leather),1足,pair パンプス、(甲)牛革、合成ゴム又はウレタン、(底)張付底、23∼24cm程度、中級品 Laundry charges (Men's business shirts),1枚,水洗い、折りたたみ仕上げ、持ち込み、料金前払い、配達なし Dry cleaning charges (Men's suit)1着, suit上下、ドライクリーニング、持ち込み、料金前払い、配達なし (Transportation & communication) 111 111 111 Gasoline 1リットル レギュラーガソリン、現金売り (Miscellaneous) 3,700 6,875 3,700 6,875 3,700 6,875 Men's haircut charges,1回,once 総合調髪、大人 Permanent waves,1回,once シャンプー、カット、ブロー又はセットアップ込み、ショート - 11 - 10 一世帯当たり一ヶ月間の収入と支出(全国と前橋市) Average Monthly Receipts and Disbursements per Household (All Japan and Maebasi-shi) 勤労者世帯の収入と支出 Worker's households 資料:総務省統計局 項 全 国 前橋市 All Japan Maebashi-shi 平成16年 平成16年 平成16年 平成16年 (2004) (2004) (2004) (2004) 7月 8月 7月 8月 目 July 集 世 有 世 計 帯 業 帯 主 世 帯 人 人 の 年 数 員 員 齢 収 入 総 額 実 収 入 経 常 収 入 勤 め 先 収 入 世 帯 主 収 入 世帯主の配偶者の収入 他 の 世 帯 員 収 入 事 業 ・ 内 職 収 入 他 の 経 常 収 入 特 別 収 入 実 収 入 以 外 の 収 入 預 貯 金 引 出 保 険 取 金 借 入 金 そ の 他 繰 入 金 支 出 総 額 実 支 出 消 費 支 出 食 料 穀 類 そ の 他 住 居 家 賃 ・ 地 代 設 備 修 繕 ・ 維 持 光 熱 ・ 水 道 光 熱 上 下 水 道 料 家 具 ・ 家 事 用 品 被 服 及 び 履 物 保 健 医 療 交 通 ・ 通 信 教 育 教 養 娯 楽 そ の 他 の 消 費 支 出 非 消 費 支 出 直 接 税 そ の 他 実 支 出 以 外 の 支 出 預 貯 金 保 険 掛 金 借 金 返 済 借 入 金 返 済 そ の 他 繰 越 金 現 物 総 額 August 4,422世帯 4,442世帯 3.48人 3.48人 1.63人 1.62人 46.5歳 46.5歳 円 1,115,229 595,323 589,617 582,487 514,008 58,616 9,862 3,141 3,990 5,706 445,649 388,872 3,853 52,428 497 74,257 1,115,229 432,676 335,623 72,833 6,926 65,906 19,535 14,187 5,347 17,960 13,087 4,873 13,369 16,549 12,415 48,915 15,782 35,723 82,543 97,054 42,231 54,822 610,855 452,255 40,115 55,518 27,035 35,931 71,698 10,655 円 951,330 473,222 466,179 436,578 379,483 49,320 7,775 2,908 26,693 7,043 403,692 363,503 6,073 33,775 339 74,417 951,330 400,949 327,142 73,516 6,843 66,674 20,509 14,689 5,820 20,033 14,450 5,583 11,385 10,666 10,217 48,397 12,774 40,524 79,120 73,806 31,031 42,775 482,229 364,837 34,116 42,485 29,575 11,216 68,152 10,248 July August 58世帯 3.33人 1.38人 46.8歳 60世帯 3.43人 1.40人 46.9歳 円 878,846 502,825 500,026 498,784 451,036 39,571 8,177 0 1,241 2,799 315,351 299,610 1,724 14,017 0 60,669 878,846 375,163 302,598 68,278 6,690 61,586 11,898 8,423 3,475 16,277 11,068 5,209 8,824 16,305 8,175 53,006 15,326 35,153 69,356 72,565 30,981 41,583 429,709 356,389 20,537 38,580 13,722 482 73,974 5,069 円 776,989 391,271 384,991 354,367 316,599 22,521 15,246 7,500 23,124 6,280 305,635 288,548 5,661 11,426 0 80,083 776,989 345,807 284,020 68,432 6,490 61,940 14,081 12,719 1,362 17,463 12,785 4,679 5,940 8,315 19,316 42,859 9,622 31,431 66,562 61,788 30,371 31,417 365,734 296,599 24,237 26,624 17,646 628 65,448 6,103 注)「世帯主の配偶者の収入」には世帯主の配偶者が男である場合を含む。 四捨五入の関係で項目の計に一致しない場合がある。 - 12 - Item Number of tabulated households Persons per household (persons) Earners per household (persons) Age of head (years old) ¥ Receipts Income Current income Wages & salaries Household head Spouse of household head Other household members Business & homework Other current income Non-current income Receipts other than income Saving deposits cashed Insurance proceeds Debts Others Carry-over from previous month Disbursements Expenditure Living expenditure Food Cereals Others Housing House and land rents Repairs & maintenance Fuel, light and water charges Fuel and light Water & sewerage charges Furniture & household utensils Clothes and footwear Medical care Transportation & communication Education Reading & recreation Other living expenditure Non-living expenditure Direct taxes Others Disbursements other than expenditure Savings Insurance & premium payments Payments of debts Installment & credit purchase payments Others Carry-over to next month Expenditure in kind 11 一世帯当たり一ヶ月間の収入と支出(全国と前橋市) Average Monthly Receipts and Disbursements per Household (All Japan and Maebasi-shi) 全世帯の収入と支出 All Households Source: Statistics Bureau Ministry of Public Management, Home Affairs, Posts and Telecommunications 項 全 国 前橋市 All Japan Maebashi-shi 平成16年 平成16年 平成16年 平成16年 (2004) (2004) (2004) (2004) 7月 8月 7月 8月 目 July 集 世 有 世 消 食 住 光 家 被 保 交 教 教 そ 現 計 世 帯 帯 人 業 人 帯 主 の 年 費 支 数 員 員 齢 出 料 穀 類 魚 介 類 肉 類 乳 卵 類 野 菜 ・ 海 藻 果 物 油 脂 ・ 調 味 料 菓 子 類 調 理 食 品 飲 料 酒 類 外 食 居 家 賃 ・ 地 代 設 備 修 繕 ・ 維 持 熱 ・ 水 道 電 気 代 ガ ス 代 他 の 光 熱 上 下 水 道 料 具 ・ 家 事 用 品 家 庭 用 耐 久 財 そ の 他 服 及 び 履 物 被 服 履 物 類 そ の 他 健 医 療 医 薬 品 そ の 他 通 ・ 通 信 交 通 自 動 車 等 関 係 費 通 信 育 授 業 料 等 そ の 他 養 娯 楽 の 他 の 消 費 支 出 諸 雑 費 こづかい(使途不明) 交 際 費 仕 送 り 金 物 総 額 August 7,736世帯 7,752世帯 3.19人 3.20人 1.39人 1.38人 54.1歳 54.1歳 円 305,966 70,317 6,781 6,424 5,768 3,517 8,270 2,947 3,102 4,613 8,269 4,582 3,575 12,468 20,293 10,696 9,596 17,873 8,252 4,513 376 4,732 12,132 4,806 7,326 14,656 12,174 1,592 887 12,135 1,792 10,343 42,025 7,241 24,662 10,122 10,633 7,053 3,581 31,943 73,960 20,722 20,092 27,220 5,926 12,166 円 302,657 71,634 6,747 6,782 6,165 3,468 8,296 3,235 3,008 4,886 8,391 4,336 3,476 12,845 18,429 11,288 7,141 20,171 10,404 3,943 303 5,521 10,905 4,236 6,669 9,789 7,929 1,174 687 11,516 1,770 9,745 39,772 8,399 19,326 12,047 9,688 6,301 3,388 35,676 75,077 20,709 17,465 31,631 5,271 11,765 July August 92世帯 3.00人 1.18人 54.2歳 96世帯 3.06人 1.19人 54.7歳 円 326,840 65,820 6,955 5,273 3,785 3,215 7,800 2,854 2,806 4,681 8,872 5,003 2,666 11,910 46,692 6,795 39,897 16,434 6,453 4,818 170 4,993 7,692 2,388 5,304 13,438 11,110 1,747 580 10,346 2,184 8,162 54,168 3,853 41,366 8,949 11,230 7,768 3,462 30,354 70,666 22,870 16,496 24,730 6,570 7,874 円 262,575 64,315 6,426 5,551 3,928 3,525 7,746 3,184 2,822 4,841 8,529 4,477 2,820 10,466 10,489 8,267 2,222 17,500 8,405 4,002 357 4,736 7,335 2,707 4,627 8,730 7,678 874 178 16,736 2,198 14,537 35,134 4,334 20,421 10,379 6,430 4,990 1,440 28,817 67,089 19,787 8,643 27,948 10,711 6,725 Note) figures may not add up to the totals because of rounding - 13 - Item Number of tabulated households Persons per household (persons) Earners per household (persons) Persons Age of head (years old) ¥ Living expenditure Food Cereals Fish & shellfish Meat Dairy products & eggs Vegetables & seaweeds Fruits Oils, fats & condiments Cakes & candies Cooked Food Beverages Alcoholic beverages Eating out Housing House and land rents Repairs & maintenance Fuel, light and water charges Electricity Gas Other fuel & light Water & sewerage charges Furniture & household utensils Household durables Other furniture and household utensils Clothes & footwear Clothing Footwear Services related to clothing Medical care Medicines Medical supplies, appliance & services Transportation & communication Public transportation Private transportation Communication Education School fees Other expenditure relating education Reading & recreation Other living expenditure Miscellaneous Pocket money (of which detailed uses unknown) Social expenses Remittance Expenditure in kind 12 産業別労働者1人平均賃金(規模30人以上) Average Monthly Cash Earnings per Regular Worker by Industry (Establishments with 30 or more regular workers) 平成16年8月 Aug,2004 Source: Gunma Prefectural Government office 現金給与総額 産 業 きまって支給する給与 Cash earnings 総数 男 Total Male Contract earnings 女 Female 総数 男 Total Male 資料:県統計課 特別に支払われた給与 Extra payments 女 Female 総数 男 Total Male Industry 女 Female 円 円 円 円 円 円 円 円 調 査 産 業 計 301,900 372,090 186,109 292,976 360,874 180,966 8,924 11,216 建 設 業 383,530 420,141 196,715 351,253 383,692 185,725 32,277 36,449 製 造 業 332,385 381,915 183,745 322,729 370,816 178,420 9,656 11,099 食料品・たばこ 273,671 363,447 136,914 273,671 363,447 136,914 0 0 0 tobacco 繊 維 216,708 258,077 168,181 216,708 258,077 168,181 0 0 0 Textiles 衣 服 162,092 314,512 139,184 162,092 314,512 139,184 0 0 0 products 木 材 296,279 321,108 190,375 296,176 320,990 190,335 103 118 40 products 家 具 297,911 343,150 180,564 297,911 343,150 180,564 0 0 0 Furniture and fixtures パ ル プ ・ 紙 266,785 310,678 139,475 266,785 310,678 139,475 0 0 0 products 出 版 ・ 印 刷 × × × × × × × × 学 365,971 459,987 245,632 365,971 459,987 245,632 0 0 0 products プラスチック 293,662 375,473 158,366 293,662 375,473 158,366 0 0 0 Plastic products ゴ ム 322,267 339,053 199,904 322,267 339,053 199,904 0 0 0 Rubber products 窯 業 ・ 土 石 262,910 304,146 164,100 262,910 304,146 164,100 0 0 0 products 鉄 鋼 319,171 336,348 196,183 319,171 336,348 196,183 0 0 0 Iron and steel 非 鉄 金 属 285,209 307,363 194,368 285,209 307,363 194,368 0 0 0 products 金 属 製 品 329,557 375,942 157,790 329,557 375,942 157,790 0 0 0 products 一 般 機 械 404,271 431,800 278,027 307,737 329,952 205,863 電 気 機 器 337,016 384,542 184,865 336,346 383,992 183,813 670 550 輸 送 用 機 器 378,392 391,650 239,916 378,383 391,644 239,880 9 6 精 密 機 器 330,710 393,388 217,636 330,710 393,388 217,636 0 0 0 Precision instrument 他 - - - - - - - - - Others 電気・ガス・熱 供給・水道業 431,748 448,517 308,251 431,748 448,517 308,251 0 0 0 supply and water 運輸・通信業 301,044 325,107 165,164 290,758 313,344 163,214 10,286 11,763 卸 売 ・ 小 売 業 ・ 飲 食 店 219,590 330,416 121,735 214,477 322,164 119,392 5,113 8,252 金融・保険業 428,183 515,837 251,190 428,013 515,837 250,677 170 0 サ ー ビ ス 業 297,815 375,613 229,132 288,895 364,838 221,849 8,920 10,775 化 そ の 96,534 101,848 円 (¥) 5,143 Total 10,990 Construction 5,325 Manufacturing Foodstuffs and Apparel and related Lumber and wood Pulp, paper and allied Publishing, printing × and allied products Chemicals and allied Ceramic, stone and clay Non-ferrous metal Fabricated metal 72,164 General Machinery 1,052 Electrical machinery 36 Transport equipment Electricity, gas, heat Transport and 1,950 communication Wholesale & retail 2,343 trade,eating & drinking places - 14 - Financing and 513 insurance 7,283 Services 13 産業別賃金指数(規模30人以上)(現金給与総額) Wage indexes of Regular Workers by Industry (Establishments with 30 or more regular workers)(cash earnings) 平成12年(2000)=100 Source:Gunma Prefectural Government Office 資料:県統計課 名 年 月 目 Nominal 実 調査産業 調査産業 製 造 業 卸売・小売業 サービス業 製 造 業 Wholesale Year and month Total Manufacturing 平成13年 (2001) 平成14年 (2002) 15(2003) 9月 Sep 10月 Oct 11月 Nov 12月 Dec 16(2004) 1月 Jan 2月 Feb 3月 Mar 4月 Apr 5月 May 6月 Jun 7月 Jul 8月 Aug 質 Real & retail trade 卸売・小売業 サービス業 Wholesale Services Total Manufacturing & retail trade 99.4 95.8 99.7 95.0 93.9 86.2 99.5 99.3 99.9 97.3 100.2 96.4 94.4 87.5 100.0 100.8 76.2 77.9 77.3 175.5 80.2 77.2 80.4 77.2 77.4 127.0 119.7 78.7 79.5 82.0 81.9 187.0 83.4 82.2 88.4 80.1 79.8 131.5 138.1 82.4 68.5 73.0 71.6 150.7 78.7 67.6 74.4 74.7 79.7 77.8 142.7 76.1 76.8 77.7 75.7 178.6 77.1 79.8 77.9 77.3 77.1 137.8 98.7 78.8 77.2 79.0 78.8 178.7 82.0 78.9 82.1 78.9 79.1 129.6 122.5 80.6 80.5 83.2 83.5 190.4 85.3 84.0 90.3 81.9 81.5 134.2 141.4 84.3 69.4 74.0 73.0 153.5 80.5 69.1 76.0 76.4 81.4 79.4 146.1 77.9 77.8 78.8 77.2 181.9 78.8 81.6 79.6 79.0 78.8 140.6 101.0 80.7 14 産業別雇用指数(規模30人以上) Employment Indexes of Regular Workers by Industry (Establishments with 30 or more regular workers) Source:Gunma Prefectural Government Office 資料:県統計課 年 月 調査産業 製 造 業 卸売・小売業 サービス業 Wholesale Year and month Total Manufacturing 平成13年 (2001) 平成14年 (2002) 15(2003) 9月 Sep 10月 Oct 11月 Nov 12月 Dec 16(2004) 1月 Jan 2月 Feb 3月 Mar 4月 Apr 5月 May 6月 Jun 7月 Jul 8月 Aug Services & retail trade Services 101.4 102.5 99.3 94.2 106.9 116.9 107.0 115.7 106.3 106.2 106.0 106.0 103.7 103.4 102.9 105.1 104.7 104.6 104.3 104.0 92.7 92.9 93.2 92.9 89.5 89.3 89.0 89.5 89.1 89.0 88.5 88.0 140.6 138.8 138.2 138.2 139.1 139.5 138.4 140.2 140.8 140.6 140.3 141.0 123.2 123.6 123.3 123.6 121.3 119.8 119.1 126.4 125.6 125.7 125.8 125.3 - 15 - 15 労働者数、労働時間、出勤日数(規模30人以上) Regular Workers, Hours Worked and Days Worked by Industry (Establishments with 30 or more regular Workers) 平成16年8月 Aug.,2004 産 業 Source: Gunma Prefectural Government office 資料:県統計課 常用雇用者数 総実労働時間 出勤日数 Regular Workers Hours Worked Days Worked Industry 総数 男 女 総数 男 女 総数 男 女 Total Male Female Total Male Female Total Male Female 人 人 人 調 査 産 業 計 406,178 253,203 152,975 時間 151.8 時間 163.3 時間 132.7 日 19.2 日 19.3 日 18.9 Total 11,140 建 設 業 9,323 1,817 164.2 165.1 160.0 20.3 20.4 19.8 Construction 製 造 業 153,034 114,842 38,192 156.0 161.5 139.1 18.2 18.3 18.1 Manufacturing Electricity, gas heat supply & water 電 気 ・ ガ ス ・ 熱供給・水道業 3,159 2,784 375 156.6 158.9 140.3 19.0 19.1 17.9 運 輸 ・ 通 信 業 31,758 26,997 4,761 170.6 177.4 132.9 20.3 20.3 20.3 卸売・小売業、 飲 食 店 80,728 38,049 42,679 145.4 174.6 119.6 21.2 21.9 20.6 金 融 ・ 保 険 業 8,717 5,840 2,877 157.2 160.7 149.9 20.1 20.4 19.6 Financing and insurance サ ー ビ ス 業 117,092 54,963 62,129 144.0 152.9 136.0 18.5 18.8 18.2 Services Transport & communication Wholesale & retail trade, eating & drinking places 16 一般労働者の職業紹介状況(学卒・パートを除く) Employment Security Activities for General Workers Source: Gunma Labor Bureau 資料:群馬労働局 年 度 月 新規求職 月間有効 申込件数 求職者数 新 規 求人数 月間有効 求 人 数 Monthly New New active applications Fiscal year and month application openings Monthly active openings 就 職 新規求人 有効求人 倍 率 倍 率 Placements 総 数 県 内 県 外 Total In Gunma Outside Gunma New opening ratio Active opening ratio 平成14年度 (2002) 平成15年度 (2003) 件 7,771 7,240 人 33,831 29,697 人 7,229 9,050 人 18,492 23,470 件 1,600 1,672 件 1,471 1,548 件 130 124 倍 0.96 1.29 倍 0.55 0.80 (Average) 16(2004) 1月 Jan 2月 Feb 3月 Mar 4月 Apr 5月 May 6月 Jun 7月 Jul 8月 Aug 7,561 6,903 8,332 9,276 5,982 5,861 5,640 5,556 26,279 27,049 28,615 30,095 28,242 26,938 25,747 25,264 10,314 9,249 9,746 9,708 7,723 8,057 10,451 10,004 25,470 25,937 26,849 25,989 24,607 23,461 24,457 26,516 1,399 1,641 2,140 1,768 1,627 1,663 1,525 1,555 1,322 1,521 2,013 1,642 1,518 1,532 1,400 1,431 77 120 127 126 109 131 125 124 1.36 1.34 1.17 1.05 1.29 1.37 1.85 1.80 0.97 0.96 0.94 0.86 0.87 0.87 0.95 1.05 17 求職者給付支給状況 Payment For General Persons Seeking Jobs 年 度 月 Fiscal year and month 一 般 Source: Gunma Labor Bureau 資料:群馬労働局 短期特例 Short-term employees General employees 離職票提出件数 保険金受給者実人員 保険金支給額 特例一時金受給者数 特例一時金支給額 Separation notice submitted (所定給付) Beneficiaries (basic allowance) (所定日数内給付) Amount of benefits (basic allowance) Beneficiaries Amount of benefits (Special allowance) (Special allowance) (cases)件 (persons) 人 (¥1,000) 千円 (persons) 人 (¥1,000) 千円 平成14年度 (2002) 平成15年度 (2003) 2,928 2,362 15,044 10,947 2,338,051 1,596,523 90 104 21,393 23,436 (Average) 16(2004) 1月 Jan 2月 Feb 3月 Mar 4月 Apr 5月 May 6月 Jun 7月 Jul 8月 Aug 2,416 1,978 2,271 4,156 2,447 1,907 2,063 2,039 9,422 8,960 8,690 8,756 8,415 9,398 9,484 9,666 1,281,521 1,105,786 1,213,112 1,088,730 1,039,314 1,308,582 1,223,452 1,289,129 255 308 5 2 6 2 - 54,047 72,880 1,097 374 1,384 440 - - 16 - 18 電 気 Electricity Source: Tokyo Electric Power co., Ltd 年 度 月 契約電力(年度末) 使用量(年度月計) Contracts (End of Year & month) Kilowatts Contracted (End of fiscal year & month) Consumption (Total of fiscal year & month) 電 灯 総 数 Fiscal year and month 電 力 総 数 For electric For electric light power Total 口 口 平成14年度(2002) 1,296,997 1,124,031 平成15年度(2003) 1,304,400 1,135,242 16(2004) 2月 Feb 3月 Mar 1,303,897 1,304,400 電 灯 電 力 For electric For electric light power Total 169,535 169,158 1,134,362 1,135,242 電 灯 電 力 Total For electric light For electric power 7,944,376 7,944,993 3,620,020 3,626,560 4,324,356 4,318,433 1,442,952 1,380,881 402,317 365,935 1,040,635 1,014,945 需要口数(月末) 契約電力(月末) 使用量(月計) Contracts (End of month) Kilowatts Contracted (End of month) Consumption (End of month) 特定規模需要以外の需要 総 数 電 灯 電 力 総 数 For electric For electric light power Total Apr May Jun Jul Aug Sep 総 数 口 KW KW KW MWh MWh MWh 172,966 7,930,137 3,545,663 4,384,474 16,373,826 4,166,628 12,207,198 169,158 7,944,993 3,626,560 4,318,433 16,125,090 4,085,713 12,039,377 特定規模需要以外の需要 Demand other than the demand of a specific scale 4月 5月 6月 7月 8月 9月 資料:東京電力(株)群馬支店 需要口数(年度月末) 口 1,303,794 1,304,799 1,307,486 1,309,249 1,309,885 1,309,885 口 1,135,830 1,136,193 1,137,074 1,138,503 1,139,286 1,140,283 口 167,964 168,606 170,412 170,746 170,599 169,602 電 灯 総 数 電 力 For electric For electric light power Total KW 6,121,016 6,132,364 6,157,931 6,187,632 6,203,641 6,201,042 KW 3,631,833 3,636,491 3,642,387 3,651,874 3,659,059 3,665,743 KW 2,489,183 2,495,873 2,515,544 2,535,758 2,544,583 2,535,300 Total Demand other than the demand 特定規模需要 of a specific scale 電 灯 電 力 For electric light For electric power MWh 363,665 315,244 269,841 356,981 377,349 354,508 MWh 1,354,741 1,261,122 1,314,282 1,509,657 1,511,996 1,468,072 Demand of a specific scale MWh 380,502 333,859 374,410 454,570 487,567 444,298 MWh 610,573 612,019 670,031 698,105 647,081 669,266 注)2004年4月以降の公表データが「特定規模需要(電力小売り自由化の需要)」と「特定規模需要以外の需要」に分けて公表されました。2004年4月からの「需要口数」 と「契約電力」のデータは、「特定規模需要以外の需要」に関するデータのみです。「特定規模需要」のデータは含まれていません。 四捨五入の関係で項目の計に一致しない場合があります。 Note)The official announcement data after April,2004 divided to "demand of a specific scale.(demand for electric power retail ralization)",and "demand other than the demand of a specific scale", and was announced. The data of "Contracts" and "Kilowatts Contracted" from April, 2004, is only data about "demand other than the demand of a specific scale.". The data of "demand of a specific scale" is not contained. Figures may not add up to the totals because of rounding 19 ガスの消費量 Consumption of Gas Source: Each gas supply establishments 年 月 Year and month 消 費 量 Consumption of Gas 商業用 Commercial 工業用 Industrial 家庭用 Residential 総数 Total 千MJ 平成14年 平成15年 (2002) (2003) 16(2004) 1月 2月 3月 4月 5月 6月 7月 8月 Jan Feb Mar Apr May Jun Jul Aug 千MJ 千MJ 資料:各ガス供給事業所 その他 Other 千MJ 千MJ 9,252,408 10,658,786 4,409,378 4,930,137 1,188,870 1,208,934 2,673,750 2,732,230 980,410 1,787,485 1,073,001 1,148,042 1,106,500 1,001,070 767,429 901,386 1,057,136 937,115 410,485 516,679 509,651 481,939 360,056 493,978 519,442 491,952 119,872 118,104 103,980 97,581 79,892 87,494 119,912 121,122 356,832 317,797 299,927 261,083 210,065 172,869 228,580 117,246 185,811 195,462 192,943 160,467 117,416 147,045 189,202 206,796 注)四捨五入の関係で項目の計に一致しない場合があります。Note) Figures may not add up to the totals because of rounding 単位を千㎥から千MJ(メガジュール)に変更しました。 The unit was changed into 1000MJ from 1000㎥. 20 石油販売量 Sales of Petroleum Source: Petroleum Cooperatives 年 月 Year and month 計 Total 平成14年 平成15年 kl 2,939,700 2,883,320 (2002) (2003) 15(2003) 12月 16(2004) 1月 2月 3月 4月 5月 6月 7月 8月 Dec Jan Feb Mar Apr May Jun Jul Aug 309,024 300,001 291,340 315,169 232,020 242,942 231,612 241,326 247,724 燃料油 Fuel oil 重 油 ガソリン 灯 油 軽 油 Gasoline Kerosene Gas oil Heavy oil kl kl kl kl 1,152,234 501,122 645,821 638,697 1,142,876 476,703 618,940 643,031 105,326 96,571 102,211 105,631 98,355 108,754 100,430 114,892 119,847 75,342 78,633 64,292 62,164 24,847 28,212 18,079 20,658 24,560 57,554 51,657 56,163 75,914 58,997 58,748 63,514 58,428 56,940 -17- 70,774 73,116 68,246 71,213 49,801 47,208 49,107 47,318 46,357 潤滑油 その他 Lubricating oil other kl kl 1,826 43,024 1,770 44,687 28 24 428 247 20 20 482 30 20 4,138 3,335 3,376 4,391 3,791 3,478 4,283 3,957 3,461 資料:石油協同組合 アスファルト その他 Asphalt Other t 22,494 24,053 t 769 898 1,896 1,559 2,142 3,049 1,563 1,145 1,513 1,253 1,074 89 60 88 65 89 86 96 81 57 注) 年数字は原指数。Note:Year figures are not seasonally adjusted. 21 鉱工業生産指数(季節調整済指数) 平成12年(2000)=100 鉱工業 年 月 Year and month 製造工業 鉄鋼 非鉄 金属 金属 製品 一般 機械 電気 機械 情報通信 機械 Information & Mining & 電子部品 ・デバイス 輸送 機械 窯業・ 土石製品 Ceramics, communication Electronic stone Manufac- Manufac- Iron & Nonferrous Fabricated General Electrical electronics parts & Transport & clay turing turing steel metals metals equipment devices equipments products Machinery machinery 平成14年(2002) 平成15年(2003) 85.9 86.5 85.9 86.5 89.9 97.2 86.8 85.7 86.5 98.2 88.8 90.2 62.1 69.0 54.3 19.7 75.5 75.2 96.8 97.4 84.8 79.4 16(2004) 3月 Mar 4月 Apr 5月 May 6月 Jun 7月 Jul 8月 Aug 前月比(%) Change from Previous month 91.8 87.4 94.1 91.6 93.2 94.7 91.8 87.4 94.1 91.6 93.2 94.7 102.2 105.5 112.4 110.5 110.8 109.6 87.9 89.8 89.5 90.3 92.5 91.5 99.1 85.8 93.7 95.7 92.7 88.0 102.7 85.4 99.1 96.4 99.6 101.3 87.2 89.6 97.4 93.7 98.7 99.8 18.3 19.6 18.0 15.8 18.7 17.8 82.4 77.0 78.8 78.7 76.0 77.1 99.7 94.7 104.0 102.0 101.0 104.8 77.3 78.1 86.8 84.0 79.0 78.4 1.6 1.6 △1.1 △1.1 △5.1 1.7 1.1 △4.8 1.4 3.8 △0.8 22 鉱工業生産者出荷指数(季節調整済指数) 平成12年(2000)=100 鉱工業 年 月 Year and month 製造工業 鉄鋼 非鉄 金属 金属 製品 一般 機械 電気 機械 情報通信 機械 電子部品 ・デバイス 輸送 機械 窯業・ 土石製品 平成14年(2002) 平成15年(2003) 86.6 86.6 86.6 86.6 90.3 98.5 89.4 88.4 86.4 94.0 89.6 94.0 63.2 72.0 60.7 22.4 76.8 78.9 97.4 97.6 83.4 77.4 16(2004) 3月 Mar 4月 Apr 5月 May 6月 Jun 7月 Jul 8月 Aug 前月比(%) Change from Previous month 92.1 88.3 90.8 89.7 93.7 92.4 92.1 88.3 90.7 89.7 93.7 92.4 106.2 109.0 116.1 110.2 113.9 111.4 89.8 92.3 90.5 92.7 93.6 97.7 98.3 92.7 97.8 97.1 95.6 90.6 103.3 88.7 91.7 92.6 102.1 105.1 89.7 94.1 99.5 95.0 97.7 97.6 17.8 21.2 21.8 16.6 20.1 18.6 88.8 81.0 82.8 79.7 81.6 83.1 99.9 93.3 100.8 103.0 103.2 101.0 65.9 80.2 129.6 83.1 89.5 79.4 △1.4 △1.4 △2.2 4.4 △5.2 2.9 △0.1 △7.5 1.8 △2.1 △11.3 輸送 機械 窯業・ 土石製品 23 鉱工業生産者製品在庫指数(季節調整済指数) 平成12年(2000)=100 鉱工業 年 月 Year and month 製造工業 鉄鋼 平成14年(2002) 平成15年(2003) 16(2004) 3月 Mar 4月 Apr 5月 May 6月 Jun 7月 Jul 8月 Aug 前月比(%) Change from Previous month 非鉄 金属 金属 製品 一般 機械 電気 機械 情報通信 機械 電子部品 ・デバイス 99.2 94.8 99.2 94.8 95.2 102.4 80.1 65.2 133.1 135.8 98.1 81.4 111.9 122.7 69.0 57.2 103.4 95.7 96.4 83.7 103.5 93.2 94.0 93.8 96.3 101.1 99.6 103.1 94.0 93.7 96.4 101.1 99.5 103.0 105.7 100.4 100.2 108.6 108.8 109.5 58.9 47.4 72.4 78.8 76.0 52.2 135.0 103.4 92.5 92.3 90.1 84.8 83.4 89.2 101.6 111.4 111.5 109.9 105.4 113.3 116.2 124.1 120.3 124.2 59.4 62.9 44.2 46.4 59.7 93.0 100.0 105.2 106.2 116.2 117.9 117.3 96.5 104.8 120.1 113.1 103.9 135.3 99.2 96.9 84.8 83.9 81.3 82.1 3.5 3.5 0.6 △31.3 △5.9 △1.4 3.2 55.8 △0.5 30.2 1.0 - 18 - 21 Indices of Industrial Production (Seasonally adjusted) Source: Gunma Prefectural Government Office 資料:県統計課 産業総合 化学 プラスチック パルプ・紙・ 製品 紙加工品 繊維 食料品・ その他 たばこ 鉱業 ゴム 製品 家具 製品 木材・ その他 木製品 製品 Foods & Rubber Furniture wood Other Products product products products Wood & Chemicals Plastic Pulp,paper & products paper products Textiles tobacco Other 電気・ ガス事業 Electricity & gas Mining Industries enterprise 97.8 104.4 99.8 100.9 100.7 106.6 83.2 76.3 85.7 82.9 84.7 84.7 94.4 92.1 74.5 66.2 86.7 89.2 86.4 92.3 98.3 95.5 97.4 95.1 86.0 86.6 104.0 93.1 107.3 109.4 105.5 117.0 112.9 112.8 111.8 111.8 111.8 110.3 110.1 110.7 111.1 106.5 107.8 115.3 68.6 73.7 69.8 66.5 66.5 68.7 81.5 87.2 88.5 89.1 89.3 99.3 78.0 79.4 84.7 81.5 83.7 85.7 92.0 86.4 101.7 92.2 94.5 105.0 60.3 61.6 64.8 59.9 58.1 63.2 93.0 87.5 102.6 102.0 105.5 100.3 79.4 84.5 83.3 85.3 83.1 82.3 86.1 92.0 93.7 96.7 99.1 90.1 96.9 96.5 99.2 98.7 99.0 93.1 91.9 87.5 94.2 91.7 93.2 94.7 10.9 △1.3 7.0 3.3 11.2 2.4 11.1 8.8 △4.9 △1.0 △9.1 △6.0 1.6 22 Indices of Producer's Shipments (Seasonally adjusted) Source: Gunma Prefectural Government Office 資料:県統計課 産業総合 化学 プラスチック パルプ・紙・ 製品 紙加工品 繊維 食料品・ その他 たばこ 鉱業 電気・ ガス事業 103.7 109.9 92.4 94.3 99.3 102.6 82.7 75.8 84.0 81.4 93.9 93.4 ゴム 製品 95.4 95.5 115.3 115.0 106.0 119.4 125.1 117.0 106.4 106.3 105.5 105.0 105.8 102.0 105.7 106.6 104.5 103.1 103.5 110.0 68.2 68.6 67.7 65.8 65.1 65.9 83.2 87.7 81.5 85.6 85.4 85.8 87.7 88.5 94.4 93.1 93.7 96.9 104.3 94.8 101.2 103.3 105.0 98.0 92.4 93.0 102.4 99.7 99.7 116.2 96.2 97.0 103.8 95.9 100.9 99.6 74.2 70.8 76.5 82.1 81.8 79.7 97.0 95.9 91.9 95.4 104.9 97.1 97.5 97.0 99.3 99.1 99.7 94.1 92.2 88.4 90.9 89.8 93.8 92.4 △6.5 △3.6 6.3 1.2 0.5 3.4 △6.7 16.5 △1.3 △2.6 △7.4 △5.6 △1.5 家具 製品 113.4 104.0 木材・ その他 木製品 製品 87.2 82.7 89.8 86.8 101.9 97.0 97.3 95.2 86.7 86.7 23 Indices of producer's Industrial Inventories (Seasonally adjusted) Source: Gunma Prefectural Government Office 資料:県統計課 化学 プラスチック パルプ・紙・ 製品 紙加工品 繊維 食料品・ その他 たばこ 鉱業 102.5 111.4 90.4 100.4 96.7 92.4 86.9 77.7 85.4 79.8 88.4 80.6 ゴム 製品 86.7 71.5 111.3 101.4 101.0 96.9 86.2 90.1 110.0 112.7 112.1 114.4 115.9 112.5 90.6 90.9 93.6 94.6 93.0 93.3 61.5 65.4 61.5 62.9 62.3 63.2 74.0 68.1 77.2 74.2 70.1 83.2 70.9 72.7 71.6 78.2 80.1 79.8 38.8 30.1 32.7 23.8 17.3 18.9 105.9 113.3 119.4 144.7 145.8 145.8 75.5 67.6 61.5 70.5 74.4 72.7 47.0 65.0 66.8 62.0 63.7 61.6 157.0 154.7 156.9 167.4 162.4 153.1 4.5 △2.9 0.3 1.4 18.7 △0.4 9.2 0.0 △2.3 △3.3 △5.7 - 19 - 家具 製品 104.8 90.6 木材・ その他 木製品 製品 84.6 75.5 89.3 65.3 137.9 155.9 24 生乳生産量と処理状況 Production and Supply of Raw Milk Source: Ministry of Agriculture, Forestry and Fisheries 生乳生産量 年 月 Raw milk Production Year and month 平成14年 (2002) 平成15年 (2003) 16(2004) 1月 Jan 2月 Feb 3月 Mar 4月 Apr 5月 May 6月 Jun 7月 Jul 8月 Aug 9月 Sep 資料:関東農政局群馬統計情報事務所 生乳流通量 用途別処理量 Marketing quantity of raw milk Raw milk processing by use 移入量 移出量 総量 飲用牛乳等向け 乳製品向け その他 From outside Gunma To outside Gunma Total For drinking milk For milk products Other t 276,583 273,782 t 84,506 63,796 t 183,238 171,878 t 177,856 165,700 t 152,001 149,280 t 23,510 14,285 t 2,345 2,135 23,192 22,105 24,206 24,052 24,996 23,576 23,396 23,042 21,900 6,813 5,136 7,043 5,360 5,501 5,565 5,819 5,478 4,790 14,761 13,713 15,302 15,084 15,720 14,512 13,861 13,615 12,423 15,244 13,528 15,947 14,328 14,777 14,629 15,354 14,905 14,267 9,194 9,585 10,353 12,866 12,728 13,248 14,267 13,342 13,300 5,857 3,753 5,426 1,273 1,871 1,189 848 1,319 743 193 190 168 189 178 192 239 244 224 25 素材・製材・合板価格 Price of Log, Sawlog and Plywood Source: Gunma Prefectural Government Office 国産 外材別 樹 種 計 量 区 分 Item Unit Grade m 素 国産材 ス ・ 丸 Domestic logs 柱 材 3.65 18∼28 中目材 3.00 14∼16 柱 材 ヒ ノ キ Japanese cypress 4.00 18∼28 中目材 マ 4.00 18∼22 梁丸太 ツ Japanese Pine 太 外 材 米 マ ツ Pine Imported logs 3.00 ヒ ノ キ Japanese cypress ス 材 ギ Japanese cedar ギ Japanese cedar cm cm 14∼16 米 マ ツ Pine 12.00上 30上 SS 12.00上 30上 IS ス ギ Japanese cedar 3.00 10.5 10.5 特 等 柱(未乾燥) 製 国産材 ス ギ Japanese cedar 3.65 1.4 10.0 特 等 ス ギ Japanese cedar 3.65 4.0 ス ギ Japanese cedar 3.65 4.5 Domestic logs 外 材 材 Imported logs 4.5 特 等 タ ル キ 居 ヒ ノ キ Japanese cypress 3.00 10.5 10.5 特 等 柱(未乾燥) ヒ ノ キ Japanese cypress 4.00 10.5 10.5 特 等 土 台 ヒ ノ キ Japanese cypress 4.00 10.5 上 小 敷 居 マ 4.00 15.0 18∼20 − ツ Japanese Pine 4.5 太 鼓 梁 米 ツ ガ Hemlock 4.00 10.5 10.5 特 等 防腐土台 米 マ ツ Pine 4.00 12.0 24.0 特 等 米 マ ツ Pine 4.00 9.0 ラ ワ ン Lauan 4.00 2.4 厚さ 普通合板 合 板 貫 10.5 カ ネ 無 鴨 Plywood コンクリート型枠合板 Concrete mold plywood 構造用合板 Plywood for structures 梁 9.0 特 等 母 24.0 − 屋 − mm 12.0 タ イ プ 資料:県林業振興課 平成16年(2004) 平成16年(2004) 平成16年(2004) Ⅱ 5月15日現在 6月15日現在 7月15日現在 May.15 Jun.15 Jul.15 千円 (¥thou) 千円 (¥thou) 千円 (¥thou) 11.4 11.2 11.1 12.7 12.4 12.1 23.5 23.5 22.9 26.0 25.8 25.6 14.0 13.2 13.8 27.0 27.1 27.1 25.1 25.2 25.2 42.0 42.1 42.2 45.2 45.6 45.2 44.2 44.9 44.9 167.5 167.5 166.5 76.7 76.4 76.7 80.1 80.4 80.9 212.3 211.9 211.9 33.4 33.2 33.0 46.8 47.1 47.2 55.3 55.2 55.5 47.8 48.3 48.4 177.8 172.8 172.8 円(¥) 円(¥) 円(¥) 1,300 1,400 1,400 12.0 - 1,000 1,000 1,000 12.0 針 葉 樹 合 板 12.0 ラ ワ ン 合 板 900 1,000 1,000 1,100 1,000 1,100 - 20 - 26 製材用素材・製材品の需給状況 Demand and Supply of Log and Sawlog 資料:関東農政局群馬統計情報事務所 Source: Ministry of Agriculture, Forestry and Fisheries 年 月 Year and month (Average) 製 材 用 素 材 Log 入 荷 消 費 在 庫 Arrival Consumption Inventory Production Shipment (thou.m 3) 3 平成14年 平成15年 (2002) (2003) 15(2003) 11月 12月 16(2004) 1月 2月 3月 4月 5月 6月 Nov Dec Jan Feb Mar Apr May Jun 製 材 品 Sawlog 生 産 出 荷 在 庫 Inventory (thou.m 3) (thou.m 3) (thou.m 3) (thou.m 3) (thou.m 3) 3 3 千m 16 16 千m 16 16 千m 63 60 千m 11 11 15 18 12 14 16 16 16 17 15 16 16 16 18 18 18 19 58 60 56 55 53 51 49 48 10 11 8 11 13 12 12 13 27 3 千m 11 11 3 3 千m 18 15 11 10 9 12 13 13 11 13 14 14 14 13 13 12 13 13 自動車保有台数 Motor Vehicles Owned Source: Ministry of Land, Infrastructure and Transport 総 数 年 度 月 末 Trucks 普 通 End of fiscal Year and month 乗合車 貨 物 車 Total Medium 乗 用 車 Passenger cars 小 型 被けん (3,4輪) 引 車 Light(3and Trailers 4wheeled) 普 Busses 通 Medium 小 型 Light 資料:関東運輸局群馬運輸支局 特種(殊)用途 小 型 軽自動車 Special purpose 二輪車 vehicles 普通・ 大 型 小 型 特 殊 Medium & light Heavy Light two Light wheeled motor vehicles vehicles 台 平成14年度 (2002) 1,675,537 平成15年度 (2003) 1,694,424 台 60,300 60,251 台 105,091 102,791 台 2,080 2,122 台 4,348 4,352 台 321,670 332,031 台 620,510 614,144 台 29,557 29,303 台 4,381 4,334 台 台 27,699 499,901 28,763 516,333 16(2004) 3月 4月 5月 6月 7月 8月 9月 59,972 59,940 59,866 59,823 59,841 59,867 60,093 101,052 100,802 100,511 100,262 100,136 99,863 99,927 2,156 2,159 2,162 2,176 2,189 2,210 2,213 4,337 4,342 4,338 4,340 4,330 4,318 4,308 335,244 336,050 336,849 338,090 339,688 340,376 342,110 609,380 608,046 607,013 606,290 606,425 605,456 606,369 28,829 28,723 28,648 28,618 28,601 28,570 28,490 4,332 4,323 4,322 4,315 4,310 4,319 4,327 28,354 28,599 28,663 28,777 28,951 29,099 29,202 Mar Apr May Jun Jul Aug Sep 1,690,382 1,692,196 1,693,918 1,696,518 1,700,799 1,701,269 1,706,757 28 大型小売店販売額 Large Scale Retail Store Sales Source:Ministry of Economy, Trade and Industry 年 月 Year and month 平成14年 (2002) 平成15年 (2003) 16(2004) 3月 4月 5月 6月 7月 8月 Mar Apr May Jun Jul Aug 合 計 Value of sales 資料:経済産業省 & 衣料品 Clothing 飲食料品 Foods その他 Other Beverages 百貨店 スーパー 百貨店 スーパー 百貨店 スーパー Department Stores Supermarket 百万円 272,467 287,347 百万円 37,846 36,795 百万円 41,438 38,851 23,631 22,661 23,265 22,702 25,136 22,581 3,285 2,750 2,758 2,246 2,886 1,788 3,161 3,243 3,260 3,275 3,283 2,649 Department Stores Supermarket 百万円 百万円 16,068 121,844 16,363 134,086 1,294 1,072 1,010 1,194 1,894 909 11,300 10,899 11,655 11,608 12,329 12,684 - 21 - Department Stores Supermarket 百万円 13,913 13,402 百万円 41,355 44,849 1,076 1,061 982 867 918 770 3,514 3,635 3,600 3,512 3,825 3,781 516,726 519,212 521,546 523,827 526,328 527,191 529,718 29 業態別実質預金 Real Deposits by Type ( ¥ 100 million ) Source: The Bank of Japan 年 月 末 国内銀行 信用金庫 その他 Total Domestic bank Shinkin Banks other End of year and month 平成14年 平成15年 億円 104,465 105,106 (2002) (2003) 16(2004) 4月 5月 6月 7月 8月 9月 資料:日本銀行前橋支店 総 額 104,090 104,243 p105,236 104,866 104,857 p104,213 Apr May Jun Jul Aug Sep 億円 20,251 20,755 億円 62,015 61,760 61,007 61,257 p61,805 61,465 61,263 p60,709 億円 22,198 22,590 20,622 20,621 p20,817 20,794 20,899 p20,835 22,460 22,365 p22,613 22,606 22,693 p22,668 注)対象は群馬県内店舗。国内銀行は、都市銀行、地方銀行、地方銀行Ⅱ、信託銀行(信託勘定を含む)。その他は信用組合、商工組合中央金 庫、労働金庫、農業協同組合の計。オフショア勘定は除く。 30 業態別貸出金 Loans and Discounts Outstanding by Type ( ¥ 100 million ) 年 月 末 信用金庫 その他 Total Domestic bank Shinkin Banks other and month 億円 37,311 37,132 億円 61,366 61,555 (2002) (2003) 16(2004) 4月 5月 6月 7月 8月 9月 資料:日本銀行前橋支店 国内銀行 End of year 平成14年 平成15年 Source: The Bank of Japan 総 額 59,697 59,631 p59,733 59,885 59,576 p59,994 Apr May Jun Jul Aug Sep 億円 12,109 12,263 億円 11,945 12,159 35,651 35,632 p35,653 35,668 35,469 p35,725 11,884 11,850 p11,895 12,008 11,956 p12,083 12,162 12,148 p12,185 12,207 12,150 p12,185 注)対象は群馬県内店舗。国内銀行は、都市銀行、地方銀行、地方銀行Ⅱ、信託銀行(信託勘定を含む)。その他は信用組合、商工組合中央金 庫、国民生活金融公庫、中小企業金融公庫、労働金庫、農業協同組合の計。オフショア勘定は除く。 31 手形交換状況 Clearing of Bills Source: Gunma Bankers association 年 月 手形交換高 Bills cleared Year and month 平成14年 平成15年 (2002) (2003) 16(2004) 2月 3月 4月 5月 6月 7月 8月 9月 Feb Mar Apr May Jun Jul Aug Sep 資料:群馬県銀行協会 不渡手形 取引停止処分 不渡手形発生率 Dishonored bills Suspension of business transactions with banks Dishonored bills ratio 枚 数 金 額 枚 数 金 額 枚 数 金 額 Number Value(¥million) Number Value(¥thousand) Number Value(¥thousand) 枚 数 金 額 Number Value 枚 1,897,828 1,743,710 百万円 1,856,191 1,783,297 枚 5,436 3,067 千円 5,364,602 4,017,968 枚 557 363 千円 522,054 376,100 % 0.29 0.18 % 0.29 0.23 130,927 156,078 129,550 128,137 131,918 116,890 142,918 121,084 128,798 181,136 136,249 136,100 147,505 105,719 173,599 145,795 124 191 165 237 172 72 400 230 179,122 171,287 191,922 237,222 210,243 58,153 349,082 255,808 4 37 10 50 11 19 79 60 790 28,079 2,257 65,574 8,766 11,016 72,924 44,566 0.09 0.12 0.13 0.18 0.13 0.06 0.28 0.19 0.14 0.09 0.14 0.17 0.14 0.06 0.20 0.18 - 22 - 32 企業倒産状況 Cases of Bankruptcy Source: Teikoku Data Bank, Ltd. 年 月 Year and month 平成14年 (2001) 平成15年 (2002) 16(2004) 2月 3月 4月 5月 6月 7月 8月 9月 10月 資料:帝国データバンク前橋支店 総 数 建設業 製造業 卸・小売業 その他 Total Construction Manufacturing Wholesale & retail Other 件 数 負債額 件 数 負債額 件 数 負債額 件 数 負債額 件 数 負債額 Cases Liabilities Cases Liabilities Cases Liabilities Cases Liabilities Cases Liabilities 件 215 157 百万円 70,812 105,766 件 58 46 百万円 22,236 11,856 件 58 41 百万円 18,611 11,200 件 66 42 百万円 19,590 20,426 件 33 28 百万円 10,405 62,284 5 12 9 7 10 9 11 11 10 3,535 1,464 1,800 920 1,485 622 10,000 2,189 7,375 0 3 3 1 2 3 3 5 3 0 345 1,068 250 470 191 3,830 799 370 2 1 3 2 1 2 4 6 2 2,368 135 262 450 160 156 995 1,390 138 1 3 2 4 5 3 3 0 3 44 540 410 220 455 192 475 0 420 2 5 1 0 2 1 1 0 2 1,123 444 60 0 400 83 4,700 0 6,447 Feb Mar Apr May Jun Jul Aug Sep Oct 注)負債1,000万円以上。単位未満四捨五入のため総数に一致しない場合がある。 Note) Companies with liabilities Of ten million yen or more. Figures may not add up to the totals because of rounding. 33 信用保証協会保証状況 Credit Guarantee Association (¥million) Source: Gunma Credit Guarantee association 年 月 Fiscal year and month 平成14年 (2002) 平成15年 (2003) 16(2004) 3月 4月 5月 6月 7月 8月 9月 Mar Apr May Jun Jul Aug Sep 年 月 Fiscal year and month 平成14年 (2002) 平成15年 (2003) 16(2004) 3月 4月 5月 6月 7月 8月 9月 Mar Apr May Jun Jul Aug Sep 資料:県信用保証協会 保証申込 保証承諾 償還額 Guarantee associations made Guarantee commitments made Redemptions 金 額 件 数 金 額 件 数 金 額 件 数 Cases Value Cases Value Cases 件 44,456 43,530 百万円 359,931 384,111 件 41,481 40,622 百万円 322,547 342,669 件 38,508 43,987 百万円 337,829 352,153 3,453 2,727 2,720 3,596 3,406 2,566 2,955 34,834 26,875 27,665 33,800 32,056 23,811 28,423 3,278 2,493 2,543 3,436 3,227 2,402 2,767 32,474 23,083 25,238 31,804 29,132 21,529 26,036 3,413 3,276 3,400 3,957 3,076 2,723 2,762 27,917 27,050 25,987 27,812 24,427 23,217 22,766 Value 求償権現在額 保証債務残高 代位弁済額 Guarantee obligation Paid under guarantee Guarantor's right of indemnify outstanding 件 数 金 額 件 数 金 額 件 数 Cases Value Cases Value Cases 件 104,935 98,970 百万円 631,368 614,445 件 2,924 2,469 百万円 23,688 19,884 件 3,447 2,451 百万円 27,301 18,010 96,778 95,792 94,616 93,836 93,680 93,507 92,943 610,367 605,537 602,611 604,150 606,002 606,853 604,956 244 146 216 186 222 211 222 1,615 851 1,636 1,220 1,886 1,747 1,502 3,231 962 1,161 1,340 1,552 1,754 1,962 23,663 5,480 7,043 8,233 10,046 11,694 13,068 - 23 - 金 額 Value 34 前橋地方気象台気象 Climate of Maebashi Local Meteorological Observatory Source: Maebashi Local Meteorological Observatory 年 月 Year and month 平 年 1月 2月 3月 4月 5月 6月 7月 8月 9月 10月 11月 12月 Jan Feb Mar Apr May Jun Jul Aug Sep Oct Nov Dec 15(2003)10月 Oct 11月 12月 16(2004) 1月 2月 3月 4月 5月 6月 7月 8月 9月 Nov Dec Jan Feb Mar Apr May Jun Jul Aug Sep 平均気圧 気 温 Average of Atmospheric pressure Temperature 現 地 海 面 Spot Sea level 平均 雲量 日照 時間 降水量 平均 風速 Relative Humidity Average Amount of Clouds Duration of Sunshine Precipitation Average of Wind Speed 平 均 最 高 最 低 平 均 Average 資料:前橋地方気象台 相対 湿度 High Low hPa 1,002.3 1,001.7 1,002.3 1,001.2 998.7 996.3 996.1 997.0 999.9 1,003.6 1,005.1 1,003.9 hPa 1,016.3 1,015.7 1,016.1 1,014.7 1,012.0 1,009.3 1,009.0 1,009.8 1,013.0 1,017.0 1,018.8 1,017.8 ℃ 3.3 3.6 6.9 12.9 17.7 21.2 24.7 26.1 21.9 16.1 10.5 5.8 ℃ 8.6 9.0 12.4 18.6 23.3 25.7 29.2 30.9 26.1 21.0 15.8 11.3 ℃ -1.1 -0.9 2.1 7.8 12.6 17.2 21.0 22.3 18.4 12.0 6.1 1.3 Average % 55 55 55 58 63 73 77 75 76 69 63 57 3.5 4.4 5.4 6.3 6.8 8.3 8.2 7.4 7.9 6.3 4.7 3.4 hr 203.9 186.1 202.8 187.4 193.7 119.0 135.2 162.8 116.8 158.1 173.3 198.6 ㎜ 20.8 33.0 56.3 78.7 90.7 151.4 183.0 184.7 214.8 93.4 42.7 13.2 m/s 3.4 3.4 3.5 3.1 2.8 2.3 2.1 2.3 2.1 2.6 2.9 3.3 1,003.2 1,007.4 1,001.0 1,001.6 1,000.5 1,003.1 997.7 998.7 996.3 995.8 997.0 1,002.7 1,016.6 1,021.0 1,014.9 1,015.6 1,014.4 1,017.0 1,011.1 1,011.9 1,009.3 1,008.5 1,009.8 1,015.7 15.6 12.5 6.3 3.7 5.8 7.8 14.7 18.6 21.2 27.8 26.1 23.4 20.8 16.9 11.7 9.2 12.0 14.1 21.7 23.7 25.7 34.1 30.9 27.9 11.3 8.9 2.0 -0.6 0.5 2.4 8.3 14.4 17.2 23.0 22.3 19.8 62 69 58 46 48 48 47 66 73 61 75 71 6.8 6.9 3.7 3.9 3.7 5.7 5.0 7.9 8.3 7.2 7.4 8.2 159.1 130.0 214.6 240.8 227.4 213.2 253.4 148.5 119.0 221.9 162.8 119.8 70.0 111.5 25.5 0.0 15.5 42.0 32.5 197.0 151.4 45.5 184.7 199.0 2.6 2.5 3.4 3.6 3.4 3.3 3.3 2.6 2.3 2.9 2.3 2.3 注)平年値は、1971年∼2000年平均。 35 地域別月平均気温 Average Monthly Temperature by Area Source: Maebashi Local Meteorological Observatory 年 月 Year and month 平成14年 (2002) 平成15年 (2003) 15(2003) 10月 11月 12月 16(2004) 1月 2月 3月 4月 5月 6月 7月 8月 9月 Oct Nov Dec Jan Feb Mar Apr May Jun Jul Aug Sep 藤 原 水 上 草 津 沼 田 中之条 田 代 桐 生 上里見 Fujiwara Minakami Kusatsu ℃ 9.1 9.1 10.4 7.9 1.1 -3.0 -0.9 0.7 7.5 13.5 18.0 21.7 20.3 18.8 ℃ 10.4 10.3 11.5 8.9 2.1 -1.7 0.4 2.3 9.6 14.5 19.0 23.0 21.5 19.7 ℃ 7.6 7.0 8.2 6.2 -1.1 -4.9 -2.3 -0.2 7.4 12.0 16.2 20.0 18.5 16.5 Numata Nakanojo Tashiro ℃ 11.9 11.6 ℃ 12.3 11.9 12.7 9.7 2.6 -0.3 1.9 4.2 11.4 16.1 20.7 25.1 23.5 21.1 12.7 10.1 2.7 -0.4 2.5 4.8 11.6 16.5 20.9 25.5 23.8 21.3 Kiryu ℃ ℃ 7.5 14.5 7.0 13.9 7.9 5.8 -1.5 -5.5 -2.4 -0.3 7.3 12.1 16.2 20.2 18.6 16.4 - 24 - 15.3 12.2 6.1 3.4 5.4 7.6 14.6 18.2 22.4 27.2 25.6 23.1 資料:前橋地方気象台 伊勢崎 西野牧 館 林 神 流 Kamisatomi Isesaki Nishinomaki Tatebayashi Kanna ℃ 14.0 13.6 ℃ 15.2 14.8 ℃ 12.3 12.0 ℃ 15.4 14.8 ℃ 11.8 11.4 14.6 11.7 5.3 2.5 4.8 7.1 14.0 18.0 22.4 26.8 24.9 22.6 16.1 12.8 6.8 3.9 6.0 8.0 15.0 19.0 23.9 28.2 26.3 23.8 12.9 10.2 3.9 0.7 3.2 5.3 12.2 16.2 20.5 25.2 23.1 20.7 16.3 12.9 6.7 4.2 6.2 8.6 15.4 19.0 23.6 28.2 26.6 24.2 12.2 9.4 3.2 0.3 2.6 5.0 12.1 16.1 20.1 24.7 22.5 20.3 36 着工建築物建築主別状況 Building Construction Started by Type of Investor Source: Ministry of Land, Infrastructure and Transport 総 数 年 月 国 total 建築物 の 数 National government 床面積 の合計 工事費 予定額 Total construction 建築物 の 数 Number 平成14年 (2002) 15(2003) 11月 Nov 12月 Dec 16(2004) 1月 Jan 2月 Feb 3月 Mar 4月 Apr 5月 May 6月 Jun 7月 Jul 8月 Aug 年 月 棟 16,286 15,394 1,136 1,277 922 1,066 1,387 1,422 1,387 1,564 1,505 1,451 floor area cost 千㎡ 千万円 3,068 43,432 2,969 42,573 188 236 202 221 286 298 243 296 274 302 Number 12月 Dec 16(2004) 1月 Jan 2月 Feb 3月 Mar 4月 Apr 5月 May 6月 Jun 7月 Jul 8月 Aug cost (thou.㎡) (¥10mil.) 棟 48 41 千㎡ 26 26 7 5 4 3 1 3 1 3 3 2 1 1 1 0 0 0 0 1 1 0 2,547 3,108 2,607 3,070 3,288 4,389 3,424 3,959 3,662 3,823 千万円 564 449 工事費 予定額 Total construction 床面積 の合計 工事費 予定額 Total construction floor area cost 建築物 の 数 (thou.㎡) (¥10mil.) cost 千万円 1,184 2,381 4 9 7 7 7 4 2 3 2 0 1 7 1 2 1 3 1 1 3 18 238 8 40 10 65 18 14 個 床面積 の合計 工事費 予定額 Total construction floor area cost 棟 2,757 2,342 千㎡ 932 838 千万円 9,661 9,071 棟 362 360 千㎡ 204 172 100 125 59 100 13 412 7 210 201 123 196 228 180 221 267 240 273 312 296 245 43 70 91 102 119 112 81 100 76 122 458 693 825 1,300 920 1,469 870 1,054 811 1,252 43 31 28 38 31 27 28 23 45 35 16 15 6 12 11 17 16 14 16 9 建築物 の 数 千㎡ 82 148 24 30 14 12 15 30 5 23 19 21 6 7 2 4 1 12 1 11 10 7 人 床面積 の合計 工事費 予定額 Total construction floor area cost (thou.㎡) (¥10mil.) 千万円 棟 3,422 12,753 2,944 12,236 233 233 53 112 105 262 338 193 243 92 棟 256 297 Estimated Number 862 974 689 785 1,066 1,122 1,076 1,201 1,139 1,146 千㎡ 千万円 1,766 26,665 1,698 24,849 122 141 96 103 152 157 145 166 171 162 floor area (thou.㎡) 1,728 2,023 1,422 1,547 2,210 2,242 2,200 2,420 2,370 2,339 Note) Figures may not add up to the totals because of rounding. - 25 - 床面積 の合計 Total Individuals (thou.㎡) (¥10mil.) 千万円 1,936 2,878 注)単位未満四捨五入のために総数に一致しない場合がある。 floor area Estimated Number 建築物 の 数 Number 千㎡ 48 88 25 16 11 3 0 3 0 16 18 4 Estimated Number 床面積 の合計 棟 110 118 Organizations other than Estimated Prefectures (thou.㎡) (¥10mil.) Companies (¥10mil.) 15(2003) 11月 Nov floor area Number Cities, towns and villages 建築物 の 数 市 町 村 Cities, towns and villages Estimated 会社でない団体 cost 平成14年 (2002) construction 会 社 construction 平成13年 (2001) Total 建築物 の 数 市町村 (続) 工事費 予定額 Year and month 工事費 予定額 県 Estimated (thou.㎡) (¥10mil.) 平成13年 (2001) 床面積 の合計 Estimated Year and month 資料:国土交通省総合政策局「建設統計月報」 37 着工新設住宅利用関係別・種類別状況 New Housing Construction Started by Type of Owner Occupant Relation and kind Source: Ministry of Land, Infrastructure and Transport 年 月 利用関係別 持 家 総 数 資料:国土交通省総合政策局「建設統計月報」 By type of owner occupant relation 貸 家 給与住宅 分譲住宅 総 数 Total Total Owned houses Issued houses Rented houses 共 同 Built for Sale Apartment Year and month 戸 数 床面積 の合計 Number floor area 戸 数 床面積 の合計 Number floor area Total 平成14年 (2002) 15(2003) 11月 Nov 12月 Dec 16(2004) 1月 Jan 2月 Feb 3月 Mar 4月 Apr 5月 May 6月 Jun 7月 Jul 8月 Aug 3月 Mar 4月 Apr 5月 May 6月 Jun 7月 Jul 8月 Aug floor area (thou.㎡) Total (thou.㎡) Number (thou.㎡) 千㎡ 320 320 戸 99 187 千㎡ 5 13 戸 1,724 1,873 千㎡ 168 176 戸 5,613 5,937 1,155 1,582 1,112 974 1,651 1,425 1,312 1,700 1,519 1,580 107 133 94 95 166 147 138 165 158 161 572 648 452 546 760 824 792 858 866 867 75 83 59 71 102 107 107 114 113 115 456 781 576 326 544 413 369 653 439 528 21 36 27 12 26 21 15 30 21 25 10 6 1 33 1 13 6 3 1 1 0 3 0 1 1 0 117 153 78 101 314 188 150 176 208 182 10 14 8 11 35 20 15 19 22 21 359 528 408 211 487 349 240 431 362 455 総 種 類 別 専用住宅 数 床面積 の合計 Detached, tenement 戸 数 床面積 の合計 Number floor area 16 24 20 8 38 19 10 19 19 26 一戸建・長屋建 共 同 一戸建・長屋建 Apartment Detached, tenement Apartment Detached, tenement 戸 数 床面積 の合計 Number floor area 戸 数 床面積 の合計 Number floor area Total (thou.㎡) 796 1,054 704 763 747 1,076 1,072 1,269 1,157 1,125 併用住宅・その他 千㎡ 1,383 1,291 戸 5,503 5,773 91 109 75 87 49 128 128 146 139 135 351 506 252 211 469 334 240 431 357 423 床面積 の合計 Number floor area 777 1,045 696 751 1,146 1,062 1,056 1,254 1,140 1,109 戸 数 床面積 の合計 Number floor area Total (thou.㎡) 千㎡ 戸 255 10,954 285 10,487 16 23 12 8 37 19 10 19 18 25 戸 数 Total (thou.㎡) 注)単位未満四捨五入のために総数に一致しない場合がある。 Dwellings combined with other use & others 共 同 Total 千㎡ 戸 261 11,353 294 10,796 By kind Exclusive dwellings 同 一戸建・長屋建 (thou.㎡) 2月 Feb Number Total 戸 数 戸 6,560 6,631 Total 16(2004) 1月 Jan floor area 床面積 の合計 千㎡ 1,150 1,075 floor area 12月 Dec Number Total 戸 数 戸 8,583 8,042 Apartment 15(2003) 11月 Nov 床面積 の合計 千㎡ 1,644 1,585 共 平成14年 (2002) floor area (thou.㎡) Total 平成13年 (2001) Number 戸 数 戸 16,966 16,733 年 月 Year and month 床面積 の合計 Total (thou.㎡) 平成13年 (2001) 戸 数 Total (thou.㎡) 千㎡ 1,336 1,254 戸 110 164 千㎡ 6 9 89 108 74 86 126 126 126 144 137 133 8 22 156 18 15 5 32 0 1 8 1 1 0 1 (thou.㎡) 戸 399 309 千㎡ 46 38 19 9 8 12 18 14 16 15 17 16 2 1 1 1 2 2 2 2 2 2 Note) Figures may not add up to the totals because of rounding. - 26 - 38 発注者組織別公共工事着工(総工事費評価額) Public Construction Started by Orders (Appraised value of total Construction) Source: Ministry of Land, Infrastructure and Transport 年 月 Year and month 平成14年 平成15年 (2002) (2003) 16(2004) 2月 3月 4月 5月 6月 7月 Feb Mar Apr May Jun Jul 総 数 国 Total National government 公団・ 事業団 政府系 企業 Public corporations and agencies Government enterprises 資料:国土交通省総合政策局「建設統計月報」 県 市町村 地方公営 企業 Prefectures Cities, towns and villages Local public enterprises その他 Others 百万円 216,954 167,440 百万円 28,816 31,783 百万円 18,080 12,238 百万円 5,734 2,227 百万円 83,516 63,336 百万円 65,280 46,374 百万円 8,317 6,602 百万円 7,210 4,885 7,323 20,000 3,181 3,786 12,789 10,873 2,609 7,989 692 128 58 330 436 613 2,106 124 42 97 109 140 84 2,291 7,307 592 1,891 2,603 2,089 884 2,662 1,571 1,303 6,650 6,904 954 288 106 250 381 617 108 1,044 220 105 852 725 注)単位未満四捨五入のため総数に一致しない場合がある。 Note) Figures may not add up to the totals because of rounding. その他には独立行政法人が含まれている。 39 生活保護実施状況 Public Livelihood Aid Source: Gunma Prefectural Government Office 年 度 月 Fiscal Year and month 被保護 世帯 被保護 人員 被保護率 Households Persons who that received Rate of aid received aid aid 資料:県保健福祉課 扶助別被保護人員 扶助別保護費 Persons by kind of aid Expenditure by kind of aid 生活扶助 医療扶助 Livelihood Medical care その他 others 生活扶助 医療扶助 その他 Livelihood Medical care others (¥thou.) (¥thou.) (¥thou.) 平成14年度(2002) 平成15年度(2003) 世帯 5,782 6,085 人 7,757 8,127 3.8 4.0 人 6,833 7,205 人 6,520 6,727 人 千円 千円 千円 6,151 4,466,984 7,895,765 1,173,157 6,527 4,664,067 7,921,322 1,274,738 16(2004) 3月 4月 5月 6月 7月 8月 6,212 6,187 6,182 6,222 6,273 6,292 8,281 8,206 8,203 8,251 8,314 8,332 4.1 4.0 4.0 4.1 4.1 4.1 7,431 7,302 7,299 7,349 7,425 7,437 7,065 7,003 7,008 7,058 7,095 7,072 6,709 6,629 6,614 6,655 6,684 6,721 Mar Apr May Jun Jul Aug 411,531 379,380 337,109 363,492 369,759 370,538 690,321 526,977 758,903 664,610 686,934 733,058 40 犯罪の認知件数と検挙状況 Number of Cases Known to Police and Cleared Source: Gunma Prefectural Police Headquarters 年 月 資料:県警察本部刑事総務課 刑法犯認知件数 検挙件数 Number of penal code offenses known to police Year and month 平成14年 平成15年 (2002) (2003) 16(2004) 2月 3月 4月 5月 6月 7月 8月 Feb Mar Apr May Jun Jul Aug 総 数 凶悪犯 粗暴犯 窃盗犯 知能犯 風俗犯 Total Felonious offenses Violent offenses Larceny offenses Intellectual offenses Moral offenses その他 刑法犯 Cases cleared Others 件 39,803 40,753 件 188 209 件 782 802 件 32,938 32,867 件 1,034 1,182 件 167 168 件 4,694 5,525 件 9,909 10,054 2,877 3,383 4,354 3,404 4,400 3,794 3,750 30 16 9 25 10 12 20 52 64 90 66 147 116 98 2,283 2,703 3,453 2,651 3,348 2,919 2,957 154 113 135 125 217 176 129 9 10 12 8 21 12 18 349 477 655 529 657 559 528 687 1,441 1,012 1,608 805 561 1,063 - 27 - 111,733 113,758 103,145 110,954 111,992 109,758 41 交通事故の発生件数と死傷者数 Number of Traffic Accidents and Casualties Source: Gunma Prefectural Police Headquarters 年 月 Year and month 平成14年 (2002) 平成15年 (2003) 16(2004) 2月 3月 4月 5月 6月 7月 8月 Feb Mar Apr May Jun Jul Aug 資料:県警察本部交通企画課 死傷者数 原因別発生件数 Number of Killed and Injured Number of traffic accidents by type of violation 総数 死亡 負傷 総数 一時 不停止 Total killed Injured Total Failure to stop 人 24,947 30,681 優先 通行 Impeding Improper priority driving at traffic intersection 人 人 件 件 218 24,731 18,936 2,668 169 30,512 23,645 3,936 2,328 2,590 2,589 2,547 2,612 2,648 2,515 9 11 14 16 15 11 10 2,319 2,579 2,575 2,531 2,597 2,637 2,505 1,840 1,971 2,014 1,943 2,003 2,092 1,893 交差点安全 進行違反 324 335 354 333 318 360 237 速度 違反 信号 無視 Speeding 徐行 違反 安全運転 その他 義務違反 Disregarding Failure Infringement to slow traffic of safe down signal driving 件 729 676 件 1,176 978 件 533 582 件 849 1,042 件 300 334 59 53 71 56 43 57 52 75 77 78 87 88 78 84 41 56 52 51 53 56 41 73 86 99 82 85 106 81 22 19 28 34 33 28 30 件 件 9,287 3,394 11,595 4,502 830 917 910 895 961 1,023 997 42 火災の発生状況 Cases of Fires Source: Gunma Prefectural Government Office 年 月 出火件数 Year and month 平成13年 (2001) 平成14年 (2002) 15(2003) 16(2004) 9月 10月 11月 12月 1月 2月 3月 Sep Oct Nov Dec Jan Feb Mar 資料:県消防防災課 り災世帯数 焼損 棟数 建物焼損面積 損害額 死者 負傷者 Floor area Burned value of losses Persons Persons (¥thou.) killed injured Cases of Fires 総 数 うち 建物 Households Building Total Building suffered burnt 件 982 1,014 件 563 582 世帯 521 513 棟 837 843 ㎡ 39,628 32,362 56 62 73 76 99 105 127 32 40 48 48 58 59 69 21 39 36 67 52 65 60 47 56 67 73 79 96 111 3,348 3,441 1,680 3,511 4,594 7,490 6,452 注)更新は四半期毎になります。 千円 3,161,912 2,375,688 人 47 43 人 136 151 546,629 190,304 127,157 247,712 378,107 431,700 190,963 4 3 2 3 2 4 4 7 5 17 12 14 12 16 Note) Updating becomes quarterly. 43 景気動向指数 Indexes of Business Conditions Source(Gunma-ken):Gunma Prefectural Government Office 資料(群馬県):県統計課 資料(全国):内閣府 経済社会総合研究所 全 国 Japan Source(Japan): Economic and Social Research Institute, Cabinet office, Government of Japan 群 馬 県 Gunma−ken DI CI一致指数 年 月 Year and month DI CI一致指数 Diffusion Indexes Composite Indexes Diffusion Indexes Composite Indexes 先行指数 一致指数 遅行指数 Coincident Index 先行指数 一致指数 遅行指数 Coincident Index Leading Coincident Index Index 15(2003) 16(2004) 11月 12月 1月 2月 3月 4月 5月 6月 7月 8月 9月 Nov Dec Jan Feb Mar Apr May Jun Jul Aug Sep % 42.9 42.9 57.1 71.4 85.7 57.1 71.4 28.6 71.4 … … % 42.9 14.3 71.4 71.4 71.4 35.7 42.9 42.9 71.4 … … Lagging Leading 平成12年(2000)=100 Index Index % 57.1 71.4 42.9 42.9 50.0 71.4 71.4 42.9 57.1 … … 88.6 89.5 95.2 93.8 96.6 95.7 97.6 96.3 96.1 … … % 66.7 66.7 58.3 91.7 75.0 62.5 66.7 66.7 p54.5 p59.1 p30.0 - 28 - Coincident Index Lagging 平成12年(2000)=100 Index % % 81.8 71.4 81.8 71.4 81.8 71.4 72.7 71.4 50.0 71.4 50.0 71.4 72.7 85.7 90.9 71.4 p80.0 p41.7 p30.0 p16.7 p22.2 p100.0 100.0 101.0 103.3 101.7 101.1 103.3 104.1 104.8 p105.1 p104.2 p104.3 Others 416 428 422 405 422 384 371 8 統計ぐんま No. 366 平成16年11月号 平成16年11月20日発行 編集 発行 群 馬 県 総 務 局 統 計 課 〒371−8570 群馬県前橋市大手町1丁目1番1号 ダイヤルイン 027−226−2402 電話 027−223−1111(大代表)庁内電話2418 Mail toukei@pref.gunma.jp
© Copyright 2026 Paperzz