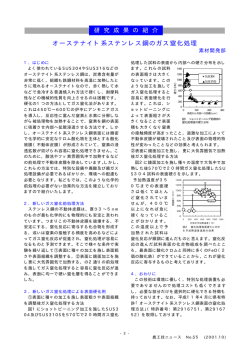
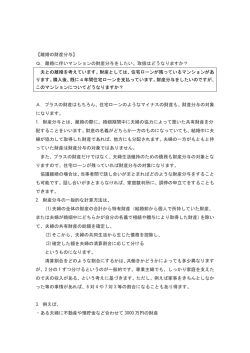
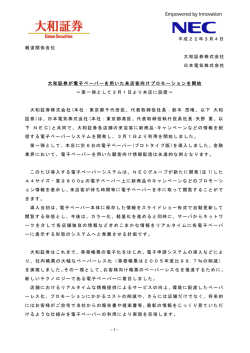
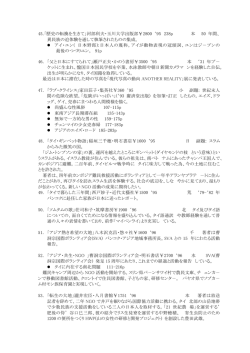
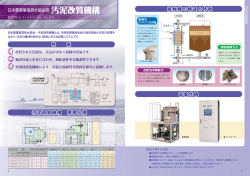
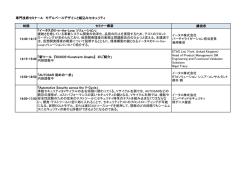
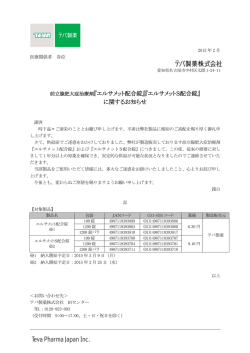
MDT
多元系状態図計算ソフトウェア Pandat
Pandat バージョン 5.0 新機能のご紹介
1.テーブル
テーブル機能が新規に組み込まれました。
1-1
計算毎に必ず表形式の「(デフォルト)テーブル」が自動生成されます。例えば Ti-Si 2元
系状態図を計算する場合、列として T(C)、X(Si)、X(Ti)、G、phaseName、f(*) が作られます。
それぞれ、温度(℃)、Si のモル分率、Ti のモル分率、自由エネルギー値、安定相の名前、安
定相のモル分率です。
1-2
画面上でこのテーブル数値を確認できます。
1-3
新たなテーブルを作り、活量値などの各種熱力学量をテーブルの列に追加できます。
1-4
数値表はバッチ機能を用いて外部ファイルに書き込みできます。
1-5
さらにこのテーブルはグラフ機能と連動・統合されています。
画面上に2元系状態図を表示させる例の場合、X軸に X(Si) 列を、Y軸に T(C) 列を選択する
ことになります。
2.バッチファイルの自動生成
2-1
従来よりバッチ機能は在りましたが、どのような計算をさせるのか指示するためのバッ
チ・ファイルを事前にテキスト編集ソフトを用いて作成しなければなりませんでした。そこ
で画面操作した履歴より、バッチ・ファイルを自動生成させるようにしました。これにより
バッチ計算時の準備作業が非常に楽になります。
バッチ機能を活用することで、多元系合金組成値の入力、同様な計算の繰り返し、数値の外
部ファイルへの書き込み等が容易に行なえます。
2-2
活量値、サイトフラクション値などファイル出力できる熱力学量を増やしました。
3.グラフ
3-1
計算状態図上に実験値印を重ね合わせることが出来るようになりました。状態図計算後に、
実験値をテーブルとして import し(読み込み)、両方を表示できます。
3-2
矢印を任意の場所に表示できるようになりました。
3-3
下付き文字を表示できるようになりました。
Ti4C2S2
4.処理速度
従来からの「計算初期点を入力しなくても状態図を計算する」
「2相分離の有無を自動的に
検知し、2相分離を全て網羅する」機能は備えております。
処理速度をさらに高める Level-1 search オプションを作りました。
従来通りの処理ロジックは Level-2 extensive search オプションとしてご利用できます。
以上
T[C]
T[C]
MDT
2200
2200
2000
2000
1800
1800
1600
1600
1400
1400
1200
1200
1000
1000
800
800
600
600
400
400
200
200
00
0 0.1
0.1 0.2
0.2 0.3
0.3 0.4
0.4 0.5
0.5 0.6
0.6 0.7
0.7 0.8
0.8 0.9
0.9 1.0
1
0.0
Ti
x(Si) x(Si)
Si
図 1-1 Ti-Si 2元系状態図
図 1-2 Ti-Si 2元系状態図を計算した時のテーブル数値
図 1-3 テーブルとグラフとの関連付け
X軸としてテーブル中の X(Si) 列を、
Y軸として T 列を選択しています。
MDT
1600
1600
Liquid
1400
1400
Fcc_A1
T[C]
T[C]
1200
1200
1000
1000
Fcc_A1+Graphite
800
800
600
600
Bcc_A2+Graphite
400
400
0
0.00
0.01
0.01
0.02
0.02
0.03
0.03
0.04
0.04
0.05
0.05
w(C)w(C)
FE
図 1-4 Fe-C 2元系状態図
図 1-5 Fe-1mass%C における温度と化学ポテンシャルと炭素活量値
(組成値を固定し、温度変化によるライン計算を実行します。
新しく newTab テーブルを定義します。
)
温度 1000℃、1mass%C、ac = 0.55 値を確認できます。
0.06
0.06
MDT
図 2-1 計算処理後におけるバッチ・ファイルの保存(export)
図 3-1 Nb-Si-Ti 3元系液相面図と実験値との比較例
Pandat 5.0 User’s Guide
1. New features of Pandat 5.0
(October, 2005)
A number of important new features and upgrades are available in this version
of Pandat. Specifically, version 5.0 sees the release of enhanced tools in
manipulating Batch files, Tables and Graphs. These new tools enable a range
of exciting new functionalities. The highlights are:
Batch files – A batch file is automatically created for each calculation. Batch
files may be edited in the Pandat interface and saved as a text file on disk. This
allows the user to easily create and modify a batch file without being concerned
about memorizing the syntax in the batch file.
Tables – Pandat 5.0 adds several new Table operations. Users can edit, save,
add, delete, import and export a Table as needed. Users can also create a graph
from the columns in the Tables. With these tools, the merging of graphs and
comparison with experimental data can be realized.
Graphs – The graphs generated from Pandat 5.0 are of improved quality and
are suitable for publication. The Graph module in Pandat 5.0 is also much
more versatile and can produce customized graphs by, for example, adding
legends, superscripts, subscripts, symbols, changing the color and type of line
or marker, drawing a line or an arrow on a graph.
Other improvements include being able to save and open a Pandat
workspace, being able to calculate activities, weight fractions of a phase,
etc.
1
© Copyright 2026 Paperzz