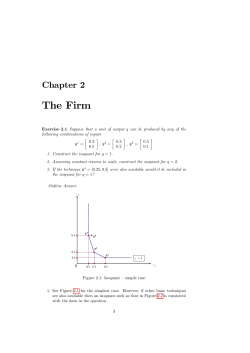
Frank Cowell: Microeconomics November 2006 Exercise 3.3 MICROECONOMICS Principles and Analysis Frank Cowell Ex 3.3(1) Question Frank Cowell: Microeconomics purpose: to derive competitive supply function method: derive AC, MC Ex 3.3(1) Costs Frank Cowell: Microeconomics Total cost is: F0 + ½ aqi2 Marginal cost: aqi Average cost: F0/qi + ½ aqi Therefore MC intersects AC where: This is at output level q where: At this point AC is at a minimum p where: For q below q there is IRTS and vice versa Ex 3.3(1) Supply Frank Cowell: Microeconomics If p > p the firm supplies an amount of output such that If p < p the firm supplies zero output otherwise the firm would make a loss If p = p the firm is indifferent between supplying 0 or q p = MC in either case firm makes zero profits To summarise the supply curve consists of : Ex 3.3(1): Supply by a single firm Frank Cowell: Microeconomics Average cost p Marginal cost Supply of output q qi Ex 3.3(2) Question Frank Cowell: Microeconomics purpose: to demonstrate possible absence of equilibrium method: examine discontinuity in supply relationship Ex 3.3(2): Equilibrium? Frank Cowell: Microeconomics AC,MC and supply of firm p Demand, low value of b Demand, med value of b Demand, high value of b Solution for high value of b is where Supply = Demand AC MC qi Ex 3.3(2) Equilibrium Frank Cowell: Microeconomics Outcome for supply by a single price-taking firm High demand: unique equilibrium on upper part of supply curve 2. Low demand: equilibrium with zero output 3. In between: no equilibrium 1. Given case 1 “Supply = Demand” implies This implies: But for case 1 we need p ≥ p from the above this implies Ex 3.3(3) Question Frank Cowell: Microeconomics purpose: to demonstrate effect of averaging method: appeal to a continuity argument Ex 3.3(3) Average supply, N firms Frank Cowell: Microeconomics Define average output Set of possible values for average output: Therefore the average supply function is Ex 3.3(3) Average supply, limit case Frank Cowell: Microeconomics As N the set J(q) becomes dense in [0, q] So, in the limit, if p = p average output can take any value in [0, q] Therefore the average supply function is Ex 3.3(3): Average supply by N firms Frank Cowell: Microeconomics Average cost (for each firm) Marginal cost (for each firm) p Supply of output for averaged firms q q Ex 3.3(4) Question Frank Cowell: Microeconomics purpose: to find equilibrium in large-numbers case method: re-examine small-numbers case Ex 3.3(4) Equilibrium Frank Cowell: Microeconomics Equilibrium depends on where demand curve is located High demand characterise in terms of (price, average output) equilibrium is at (p, p/a) where p = aA / [a+b] Medium demand equilibrium is at (p, [A – p]/b) equivalent to (p, bq) where b := a[A – p] / [bp] Achieve this with a proportion b at q and 1–b at 0 Low demand equilibrium is at (p, 0) Ex 3.3(4): Eqm (medium demand) Frank Cowell: Microeconomics AC and MC (for each firm) Supply of output (averaged) Demand p Equilibrium Equilibrium achieved by mixing firms at 0 and at q b here 1b here q* q q Ex 3.4: Points to remember Frank Cowell: Microeconomics Model discontinuity carefully Averaging may eliminate discontinuity problem in a large economy depends whether individual agents are small. Equilibrium in averaged model may involve identical firms doing different things equilibrium depends on the right mixture
© Copyright 2026 Paperzz