,-"",
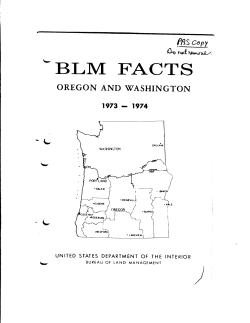
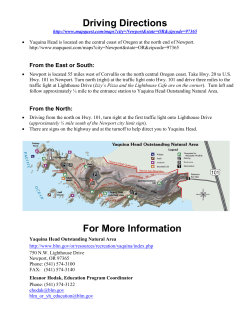
ELM: FACTS
OREGON AND WASHINGTON
1983
-
,
,
.~'-'
I
SPOKANE.
I
WASHINGTON
•
VALE
LAKEVIEW
•
\~
UNITED STATES DEPARTMENT OF THE INTERIOR
BUREAU OF LAND MANAGEMENT
· UNITED STATES DEPARTMENT OF THE INTERIOR
Bureau of Land Management
Oregon and Washington
BLM Facts
1993
Page
contents Bureau of Land Management Offices in Oregon and Washington ------------
Employees of BLM
Lands Managed by BLM in each District
Lands Managed by BLM in each County
RECEIPTS AND PAYMENTS Collections. Classified by Commodity. FY
Collections. Classified by Commodity. FY
Collections. Classified by Commodity. FY
Collections. Classified by Commodity. FY
Payments to Counties and State. FY 1992
Payments to Counties and State. FY 1993 ,
.,
O~ Payments to Counties and State, FY 1992
Payments to Counties and State, FY 1993
Expendi tures for Resource Management 1992 Oregon
1993 Oregon
1992 Washington
1993 Washington -------
Oregon
Oregon -----------------Washington
Washington --------------
TIMBER MANAGEMENT
Commercial Forest Land
Timber Sales -----------------------------------------------------
Timber Harvests
Timber Trespasses
Minor Forest Products Sales
Forest Development - I
Forest Development - II
Forest Development - III ------------------------------------------
CJ'
""
5
6
7
9
9
10
11
12
13
14
15'
15
16
16
17
19
19
20
WILD HORSE MANAGEMENT
Wild Horse Management
21
Horse Populations on BLM Rangelands, Cumulative
21
Disposition of Captured Wild Horses, Cumulative ------------------- 21
_,
~ANGE
~;
MANAGEMENT
Livestock Grazing
Resource Development and Conservation ----------------------------
Resource Development and Conservation, Forage & Fencing,
Cumulative
Resource Development and Conservation, Water Developments,
Cumulative
WILDLIFE HABITAT MANAGEMENT
Big Game Population Estimates
Wildlife Habitat on BLM Lands
Wildlife Habitat Improvement
Aquatic Habitat Improvement ------------~-------------------------
22
23
24
24
25
25
26
26
~Co~nut~e~nut~s~______________________________________________________________~P~a~q~
UNITED STATES DEPARTMENT OF THE INTERIOR
Bureau of Land Management
Oregon and Washington
RECREATION MANAGEMENT
Recreation Management-------------------------------------------- 27
27
Estimated Recreation Visits to BLM Lands
28
Summary of Wi.1demess Inventory Results
FIRE OCCURRENCES
. Fire Statistical Summary ------------------------------------------ 28
ROADS AND EASEMENTS
Roads Constructed -----------------------------------------Rights of Way -------------------------------------------------
Roads Maintained -------------------------------------------------
Road Right of Way Permits and Agreements
Road Right of Way Easements and Lands Acquired - - - - - - - - - Other Acquisitions
29
30
30
30
31
31
~1
33
34~'\
34~
35 .
36
231-6251
William G. Leavell
State Director
LAKEVIEW DISTRICT
1000 Ninth Street S
P.o. BOK 151
Lakeview. OR 97630
947-2177
Jerry E. Asher
District Manager
Joshua L. Warburton
District Manager
BURNS DISTRICT
74 S Alvord Street
Burns, OR 97720
MINERALS MANAGEMENT
Minerals --------------------______________________________________
Competitive Geothermal Leases
,~
Noncompetitive Geothermal Leases
~
Withdrawal Review Determinations
32
Federal Lands Subject to Mineral Location and· Leasing
33
LANDS MANAGEMENT
Lands Transferred Between BLM and Other Federal Agencies
Land Leases ----------------------------------------------------Public Land Surveys
Land Patents Issued
Lands Received by BLM
OREGON STATE OFFICE
825 NE Multnomah Street
P.O. BOK 2965
portland, OR 97208
0".
"';F
..... J;,
~
~
VALE DISTRICT
1000regon.Street
P.O. BOK 700
Vale, OR 97918
473-3144
Fearl M. Parker
District Manager
PRINEVILLE DISTRICT
185 East 4th Street
P.O. Box 550
Prineville, OR 97754
447-4115
Gerald E. Magnuson
District Manager
SALEM DISTRICT
1717 Fabry Road, SE
P.O. Box 3227
Salem. OR 97302
399-5646
EUGENE DISTRICT
1255 Pearl Street
P.O. Box 10226
Eugene, OR 97401
687-6651
Melvin D. Clauson
District Manager
ROSEBURG DISTRICT
777 NW Garden Valley Blvd.
Roseburg, OR 97470
672-4491
James E. Hart
District Manager
MEDFORD DISTRICT
3040 Biddle Road
Medford, OR 97501
776-4174
Hugh R. Shera
District Manager
COOS BAY DISTRICT
3.33 S Fourth Street
Coos Bay, OR 97420
269-5B80
Robert T. Dale
District Manager
509-456-2570
Joseph K. Buesing
District Manager
.m"·
SPOKANE DISTRICT
tast' 4217 Main
'0; ...~pokane. WA 99202
.it-;. ~. ~."' ~ . -
.
,.·ff!.:~·
Joseph C. Dose
District
Manag~r
1
EMPLOYEES OF BLM
. (Authorized permanent pos i tions)
September 30 !I
District 1982
Lakeview Burns
Vale
Prinevi lle Salem Eugene Roseburg Medford Coos Bay Spokane State Office
Ore-Wash Total
September 30 JJ
1982
43
70
111
47
201
172
170
287
182
40
61
96'
45
197
168
168
284
33
32
~
~
l4
54
67
41
188
164
162
285
135
23
-..ll!
1,364
September 30
1983
1,565
',. ,. ",. •
LANDS MANAGED BY THE BUREAU OF LAND MANAGMENT
IN EACH COUNTY IN OREGON AND WASHINGTON
?J
As of September 30, 1983.
Oregon
Count!!
177
.!
1,534
1
11 Does not include temporary and WAE employees.
~I
Includes only permanent full time and WAE pod tions.
I
LANDS MANAGED BY THE BUREAU OF LAND MANAGEMENT
Lands under the exclusive jurisdiction of each district of the Bureau of t1\~
Land Management in Oregon and Washington. Includes public domain, reveste
Oregon & California Railroad grant lands. reconveyed Coos Bay Wagon Road
~
grant lands, Land Utilization Project Lands, and certain other categories.
Acreages are as of September 3D, 1983, and are approximate. Lands managed
by BLM are 25 percent of the total acreage of Oregon and less than 1 percent
of Washington.
'V
District Hectares
Acres
3,350,739
3,570,379
4,585,735
1,373,99:",
Eugene--------------------------
Roseburgl-------------
Medfordl--------------------
Coos Bay'-----------------------Oregon Total-------------------
1,356,575 1,445,498 1,856,573 556,273 181,832 163,882
128,209 171,630
368,828
133,643
6,362,943
Spokane'-------------------------
Ore-Wash Total---------------
127,575
6,490,518
Lakeview~-----------------------
8urns---------------------------Vale'----------------------------Prineville'----------------------Baker---------------------------Salem~-----------------------
~.
V
I, 0'
I )
449,12~)
404,787
316,676
423,927
911,004
330,099
15,716,465
.
•
B<Aker Benton Clackamas Clatsop--
Columbia Coos Crook Curry
Deschutes
Douglas Gilliam
Grant
Harney Hood River
Jackson
Jefferson
Josephine
Klamath--·
Lake Lane Lincoln Linn-·· Malheur
Marion---·
Morrow Multnomah
Polk
Sherman
Tillamook
Umatilla
Union WalloWa Wasco Washington
Wheeler
Yamhill Total
Washi!!9 ton
Acres
367,930
57,574
63,712
43
11,081
166,742
511,241
67,510
518,655
653,357
23,717
171,165
4,098,198
180
430,942
25,846
311,758
288,549
2,585,388
289,207
20,471
88,202
4,557,805
21,005
35,886
5,195
41,672
43,403
49,473
8,857
6,250
18,908
35,904
12,011
85,938
42,690
15,716,465
Countll Adams
Asotin
Benton
Chelan
Clallam
Clark
Columbia
Cowlitz
Douglas
Ferry
Franklin
Garfield
Grant
Grays Harbor
Island
Jefferson
King
Kitsap
Kittitas
Klickitat
Lewis
Lincoln-
Mason
Okanogan
Pacific
Pend Ore i lIe
Pierce
San Juan
Skagit
Skamania
Snohomish
Spokane
Stevens
Thurston
Wahkiakum
Walla Walla
Whatcom
Whitman Yakima
Total
Acres
601
10,422
19,240
21,534
237
5
519
52
17,6B3
11,968
17,367
433
37,129
13
2
90
3B7
16,099
17,4B2
279
6,974
3
55,256
374
1,904
12
288
356
656
170
29,813
1
1
698
145
1,334
25,673
315,110
a:ua::ruJ6, aASSIPII!D Br <DIOll'l'Y, l"i 1982 - <R:lDI
tam
Mineral
Material Sales
81,446.27
$
9,926.00
lIent of Land
Sale of Tintler
Grazin; Fees
Sec. 3~
Sec. 152/
911,820.92
65,549,992. i.2
11,299,730.98
other I!eSaUn:eS
Mineral LeaSeS
Mineral (Material)
Sales
6,880.91
tam Sales
43,308.50
13,000.00
lIent of
2,363, 6ll. 73
5,069,019.76
1,573,682.38
89,578.66
6)
8,363.54
475,126.35
42,162.77
5,086.49
4,469.82
other Soutoes
3,028.99
Total
or.c
}/
~ the Fonst
IncludeS 74,547 acres of [1!ICCXM!yed
the aureau of tam 1IanagBDent.
,!' Prin::ipally public daIBin
am
QlOS
Bay wagon Road grant lands nanaged ~
acquired J.an:ls nanaged ~ the &Jreau of
Managanent, plus other federal J.an:ls with respect to mineral leasing.
~ Fran grazing permits iSSJed wder Sec. 3 of the ~lor Grazing h::t.
2/ Fran grv.ing leases iSSJed wDer Sec. 15 of the ~lor Grazing h::t.
tam
$
U7,036
(-~~
11
__ )'
,!'
3,555
$ 5,998,667
1,800
7,247
597,959
84,517,667
7,587,384
16,830
33,949
6,846
4,690,149
4,839,670
$
40
1,467,487
73,944
24,364
14,418
other Fees
653,184
27,259
85,293
A!nalties &
Forfeitures
other Soutoes
Totals
38,380
$86,841,007
$7,587,384
$4,835,909
$12,466,880
$94,428,391
$111,869,271
J/ Includes 2,074,602 acres of rE!IIeSted Oregon and Cllifomia Railroad qrant lands
managed ~ the aureau of tam ManageI8lt.
Y
'-"-'3 1
0
tam status
48,655
Gram Total BUl, All Sam:es:
Service.
$
tams
to
79,157
$85,490,635.85
Includes 492,399 acres of revested Oregon am Cllifomia Railroad grant lands
mana<JE!d
113,857
Total O&C
J/ Includes 2,074,602 acres of revested Oregon am QUifomia Railroad qrant lands
managed ~ the Bureau of tam Manag<m!nt.
PS]/
Other
814,474
$78,596,218.17
Gram Total BUI, All Sooroes:
Y
I)
$
tmelated
ClIiR }/
other ResoUrCeS
§!!7, 296, 487.19 $11,299,730.98 $2,458,116.50 $15,640,755.22 $95,276.94
Totals
Status
..JRecreation Fees
4,906.30
A!nalties &
Forfeitures
<DIDlI'lY, "' 1983 - auu:N
BUlJ/
GraziD;! FeeS
Sec. 3~
c<;~ Sec. 15 2/
82,aTI.83
Other Fees
Land
Sale of Tintler
161,177.53
Recreation Fees
£r{
tam
43,891.88
tam Sales
ClA$IFIm
a:mn:xlity
$8,831,251.60 $
107.50
~,
or.c I.mIs
tam statUs
tands,!'
-
$ , 116,924.00 $
C'"---.')'.\
to
Other
ClIiR }/
PSy
BUl]l
Mineral LeaseS
Ulrelated
Status
or.c r.um
<l:JImodity
f»)l\
Inc:lllIles 492,399 acres of revested Or~ and Cllifomia Railroad qrant lands
managed ~ the Forest
Servioe.
Includes 74,547 acres of recx:meyed Q)oS say wagon Road qrant lands aanaged ~
the aureau of tam ManagaIIent.
,!' Prin::ipally public dcI!Bin am acquired lands IIIi!IIlaged ~ the &Jreau of tam
ManagEment, plus other federal lands with respect to mineral leasing.
~ Fran qrazing permits issued wder Sec. 3 of the 'nIylor Grazing h::t.
2/ Fran grazing leases issued onSer Sec. 15 of the 'nIylor Grazing h::t.
""
0) $138,091
(~:f~LLECTIONS. CLASSIfIED BY COi"I'IODITY. FY 1983 - WASHINGTON
. COLLECTIONS. CLASSIfIED BY cotf'IOOITY. FY 1982 - WASHINGTON .
Commodity
Mineral Leases
Mineral Sales
Land Sales
BlJ"I
Lands
$1.166.070.00
Unrelated to·
Land Status
11
$
Mineral Leases
1.625.00
Grazing
Sec. 15
Recreation Fees
31.649.00
Land Sales
Rent of Land
301.653.00
Sale of Timber
Grazing
Section 15
53.177 .00
155.00
Recreation Fees
~her Resources
Other Resources
Other Fees
34.129.00
Penalties & Forfeitures
82.443.00
Other Sources
Total
Grand Total. All Sources:
JI
BlJ"I
Lands
Unrelated to
Land Status
$1.503.606.
JI
$
Mineral Sales
Rent of Land
Sale of Timber
Commodity
419.00
10.
301.187.
42.306.
2.95!.
4.205.
47.888.
Other Fees
Penalties & Forfeitures
~:;.\\
96.018.
))ther Sources
$1.554.329.00 ___________ $116.991.00
Total
$1.671.320.00
Principally public domain and acquired lands managed by the 8ureau of
Land ~nagement. plus other federal lands with respect to mineral
leasing.
173.505.
Grand Total. All Sources:
11
o
$2.027.770.
_ _ _ _ _ $143.906.
$2.171.676.
Principally public domain and acquired lands managed by the Bureau of
Land Management. plus other federal lands with respect to mineral
leasing.
()
PAYftENTS TO COUNTIES AND STATE, FY 1982 - OREGON
Distribution of proceed, to Oregon counties and to the State of Oregon derived
from res04.lrc:e IDilnag81D11nt on land. managed by the Bureau of Land I'Ianagement in
Oregon. Revenue. are from .ale, of timber, grazing fee., mineral fee., rental
and ,al., of land, P.I.L.T., and from other .ource. during fi,cal year 1982.
Resource
I'Ianagement
o&c Land,
Countie.
Baker
Benton
Clacka...,
Clatsop
Columbia
Coos
Crook
Curry
De.chute,
00U9 1.. ,
Gilliam
Grant
Harney
Hood River
Jackson
Jefferson
Jo.ephine
Klamath
Lake
Lane
Lincoln
Linn
I'Ialheur
I'Iarion
$
$
1,104,276.86
2,181,045.05
809,541.05
2,318,588.44
37,630.50
5,296.00
42,228.50
4,177.00
758.00
11,003.00
610,644.00
$ 9,383.08
92.301.00
79,204.25
55,094.00
273,351.00
1,237,917.46
8,974.00
35,809.00
80,011.00
7;438.94
97.47
3,305.22
16,365.88
61,603.15
9.00
1,878.26
1,434.63
39.58
6,594.75
25,622.21
11.16
6,110.59
1,434,380.98
9,844,176.33
6,158,013.69
4,747,211.58
919,575.76
6,000,821.25
141.473.19
1,037,470.08
573,752.39
I"Iorrow
I"Iultnomah
Polk
Sherman
Tillamook
Umatilla
Union
Wallowa
Wa.co
Wa,hington
Wheeler
Yamhill
Total
l"Iineral!l
Lea.ing
428,349.39
848,839.16
220,069.42
247,578.09
282,946.39
$39,298,109.09
Payment,
in Lieu
of Taxe.
Grazing
Sec. 3
& Sec. 15
2,472.00
466,451.09
93,915.00
40,969.00
2,851.00
817,185.50
97,457.40
17,775.00
39.954.00
184.56
20.00
452.00
35,341. 50
2,603.49
33,264.50
30,555.00
1.078.82
14,255.50
33 7.33
18,796.50
1,832.21
4,025.40
61.373.00
1,669.00
143,646.00
4,086.50
12,301.50
$4,415,625.80 $241,499.63
$
93,501.00
1,860.00
46,966.00
288.00
Resource
I'Ianagement
O&C Land,
Counties
Totals
$
PAYMENlS TO COUNTIES AND STATE, FY 1983 - OREGON
Oi,tribution of proceed, to Oregon countie, and to the State of Oregon derived
from re,ource IDilnagement on land, managed by the Bureau of Land I'Ianage .... nt in
Or9gon. Revenue, are from ,ale, of timber, grazing fees, mineral fee" rental
and ,ale' of land, P.I.L.T., and from other ,ources during fi,cal year 1983.
140,514.58
I; Ill, 422.86
2,270,239.55
4,465.00
810,299.05
504,660.41~/ 2,834,251.84
86,637.00
703,391. 59
54,209.00
1,488,589.98
133,150.00
232,889.94
155,456.1011 10,078,934.'15
16,888.00
75,277.22
160,616.00
450,332.88 k\);;. j
1,600,952.61 ~(;;.:.
301,432.00
19,300.00
28,283.00
42,815.00
6,239,515.95
26,396.00
107,841. 63
32,388.00
4,779,639. 16
1,124,778.51 .
196,136.00
301,432.00
793,505.30
126.063.00
6,220,810.41
16,755.00
208,197.19
44,133.00
1.084,454.08
407,299.00
1.311.941.90
18,770.00
610,297.39
17,716.00
56,854.56
435,003.
39
6,634.00
849,291.16
29,856.00
67,800.99
9,650.00
262,983. 92
39,260.00
70,893.82
57,307.00
71. 899.83
106,965.00
127,593. 71
18,830.00
84,228.40
265.00
249,512.09
23,494.00
171,216.50 • __
2.454.00
297,701 .89
$3,099,571.51
$47,054,806.03 ~,
.))0)
Baker
Benton
Clackama.
clat,op
Columbia
CoO,
Crook
Curry
Deschute,
Dougla,
Gilliam
Grant
Harney
Hood River
Jack,on
Jeffer,on
Josephine
Klamath
Lake
Lane
Lincoln
Linn
I'Ialheur
Marion
$
$
1.326,718
2',620,398
972,612
3,266,522 21
$
$
350
1,723,318
11,971,410 31
7,398,465
5,703,475
1.104.812
7,209,608
169,971
1,246,455
689,327
I"Iorrow
I"Iultnomah
Polk
Sherman
'Tillamook
Umati lIa
Union
Wallowa
Wa,co
Wa.hington
Wheeler
Yamhill
Total
14,019
6,645
40,827
7,066
740
12,090
303,339
514,635
1,019,827
264,400
297,449
339,942
$47,839,334
135,973
61,510
57,858
261.560
917,572
400
58,847
38,484
4,290
126,897
75,310
27,869
20,436
325,565
16,280
64,623
20
452
38,136
29,930
68,773
20,356
4,325
77,490
4,531
141.106
12,234
$2,975,553
Payment.
in Lieu
of Taxe.
Sec. 15
Grazing
Leases
l"Iineral!l
Leasing
523
62
3,332
14,326
990
819
894
100
3,608
74
8
156
1.825
958
293
1,492
3,084
4,078
$36,972
95,891
1,907
48,154
295
6,371
88,824
55,583
136,518
88,258
3,495
164,683
309,074
19,792
43,906
27,065
33,210
201,108
309.074
129,206
17,202
45,302
417 ,625
19,246'
18,126
6,804
28,837
9,895
40.255
58,748
109,677
19,308
271
24,079
2,516
$2.580,305
Totals
$
109,910
1,335,270
2,709,369
7,361
973,352
3,284,983
392,513
1,778,901
273,014
12,121.240
64,685
440,569
1,227,636
20,192
7,502,037
66,443
5,736,785
1,313,818
436,045
7.414,132
215,042
1,312,193
743,190
724,853
82,905
521,459
1,020,279
68,798
304,225
109,986
79,397
115,494
99,882
302,251
169,263
354,692
$53, 432,164
Payment to State of Oregon from .ale of public domain
timber, IDilterial., land., etc.
$204,995.16
Total payments to counties and State, FY 1982
$47,259,801.19
Payment to State of Oregon from .ale of public domain timber,
material., and laMds, totaling $195,823 and Section 3 grazing
permits totaling $183,436
$379,259
Total payments to counties and State, FY 1983-----------------------~$53,811,423
11 Doe, not include mineral. proceed, from O&C or CBWR land •.
Includes $498,447.41 of CBWR. 11 Include, $69,453.10 of C8WR.
il
il
11 Doe. not include mineral. proceed. from O&C or CBWR land •.
Include. $480,884 of CBWR. 11 Includes $144,254 of CBWR.
PAYMENTS TO COUNTIES AND STATE, FY 1982 - WASHINGTON
I-~\ PAYMENTS TO COUNTIES AND STATE, FY 1983 - WASHINGTON
Distribution of proceed. to Wa.hington counti~. and to the State of
wa.hington derived from re.ource management on land. managed by the 8ureau
of Land Management in Wa.hington. Revenue. are from .ale. of timber,
grazing fee., mineral fee., rental and sale. of land,:P.I.L.T., and from
other .ource. during fi.cal year 1982.
Sec. 15
Grazing
Countie.
Adam.
i,
/1
i!
ii
Ii
j:
1
I'!:
ii
I
i,
A.otin
8enton
Chelan
Clallam
Clark
Columbia
Cowlitz
Douglas
Ferry
Franklin
Garfield
Grant
Gray. Harbor
Island
Jeffer.on
King
Kitsap
Ki ttl tao
Klickitat
L@as@s
$
36.27
749.04
574.21
1,186.22
2,791.27
27,565.04
25,888.21
450,658.22
60,247.00
371.00
15,137.00
1,857.00
28,087.02
48,419.22
19,276.28
9,309.06
82,936.32
15,372.00
8,258.00
66,243.00
30,592.00
72,400.00
3,543.00
43,183.00
11,818.00
15,154.00
143,116.00
2,312.00
44,603.00
30,885.00
1,696.00
47,819.00
73,819.00
57,755.00
74,455.40
5,304.21
43,183.00
12,522.27
15,154.00
149,805.17
2,312.00
44,603.00
30,885.00
1,696.00
47,819.08
73,819.00
57,755.00
1,041.37
23,004.00
24,045.37
5.58
13,634.00
76,377.00
8,266.00
48,680.00
$1,594,873.00
13,639.58
76,377.00
8,340.68
51,737.99
$1,621,461.31
3,624.02
1,250.22
868.28
11.06
2,899.32
2,055.40
1.761.21
704.27
Mason
Okanogan
Paci fie
Pend Orei 11e
6,689.17
Pi@rc@
San Juan
Skagit
Skamania
Snohomish
Spokane
Steven.
Thur.ton
Wahkiakum
walla walla
Whatcom
Whi talan
Yakima
Total
74.68
3,057.99
26,588.31
$
$
~ Distribution
of proceeds to Washington counties and to the State of
Washington derived from re.ource management on lands managed by.the Bureau
of Land Management in Wa.hington. Revenues are from sales of tImber,
grazing fees, mineral fees, rental and sales of land, P.I.L.T., and from
other sources during fiscal year 1983.
Totals
2,755.00 $
26,816.00
25,314.00
449,472.00
60,247.00
371.00
15,137.00
1,857.00
24,463.00
47,169.00
18,408.00
9,298.00
80,037.00
15,372.00
3,258.00
66,243.00
30,592.00
lewis
lincoln
Payment.
in Lieu
of TaKe.
.
counties
t))
0
Payment to State of wa.hington from .ale of public domain
timber, materiah, land., etc.--------------$13,397.08
Payment to State of washington from mineral lea.ing
$583,035.00
Total Payment. to counties and State FY 1982
$2,217,893.39
O
.
Adams
Asotin
Benton
Chelan
Clallam
Clark
Columbia
cowlitz
Douglas
Ferry
Frank lin
Garfield
Grant
Gray s Harbor
Island
Jefferson
King
'Kitsap
Kittitas
Klick itat
Lewis
Lincoln
Mason
Okanogan
Pacific
Pend Ore i 11 e
Pierce
San Juan
Skagit
Skamania
Snohomish
Spokane
Stevens
Thurston
Wahkiakum
Walla Walla
Whatcom
Whitman
Yakima
Total
Payments
in Lieu
of Taxes
Sec. 15
Grazing
Lea.es
$
27
565
428
1,165
2,383
977
1,250
9
3,549
$
2,826
6,193
25,815
228,819
63,430
355
15,521
1,930
25,504
55,265
19,119
9,534
78,679
15,762
3,340
67,919
31,404
Totals
$
2,853
6,758
26,243
229,984
63,430
355
15,521
1,930
27,887
56,242
20,369
9,543
82,228
15,762
3,340
67,919
31,404
39,702
3,633
44,117
12,165
15,539
146,743
2,371
82,864
31,668
1,739
49,054
75,891
59,224
40,538
4,947
44,117
12,695
15,539
151,884
2,371
82,864
31,668
1. 739
49,054
75,891
59,224
685
72,596
73,281
57
2,232
$21,153
13,543
78,314
8,476
49,915
$1,438,969
13,548
78,314
8,533
52,147
$1,460,122
836
1,314
530
5,141
Payment to State of Washington from sale of public
domain timber, materials, lands, e t c . - - - - - - - - - - $
18,988
Payment to State of Washington from mineral leasi09-----$ 728,541
Total payments to counties and State FY 1983
$2,207,651
I.'II
III
"
iI
':i
II
;,'
tl)u!»
. BU1 EXPENDITURES FOR RESOURCE MANAGEl'lENT
Oregon and Washington
<.
FY 1982
~COMI1ERCIAL fOREST LAND
'.
Data are as of 9/30/83.
FY 1983
forest Management:--------------------forest Developmant:-------------------Range Management---------------------Range Improvement--------------------Soil and Watershed COnservatio,nn------Lands and Minerals------------------Wildlife Management------------------Recreat ion Management-----------Recreation COnstructionn---------Cadastral Survey---------------------Resource Protection~----------------
Fire Presuppressionn------------------Fire Suppression'---------------------Fire & Storm Damage Rehabilitation----Blister Rust Control
Law Enforcement----------------Road Construction & Acquisition------Bui lding Constructionl----------Maintenance of Capital Investments-Planning and Data Management:--------Program Services'----------------------
$16,570,602
16,854,435
3,841,233
1,030,71'1
1,257,789
2,373,374
1,972,351
1,170,509
115,898
756,263
3,058,690
1,248,270
764,964
539,004
65,379
189,304
959,074
12,011
10,363,460
1,251,104
2,952,540
$20,122,957
14,449,521
3,841,744
821,968
1,405,993
2,772,508
1,821,135
1,565,351
27,748
1,009,990
3,088,196
1,120,450
1,014,845
1,526,084
72,657
252,000
2,787,802
Total.-----------------------
$67,346,965
$69,281,224
District
Commercial
Forest Land
Acres
Lakeview
Burns
Vale
Prineville
Salem
Eugene
Roseburg
Medford
Coos Bay
Oregon Total
Spokane
Ore-Wash Total
Withdrawn
Forest Land
Acres 1/
Allowable Cut
11. bd. ft.
28,000
48,000
12,000
700
1,350
3,350
70,000
351,000
299,000
387,000
696,000
264,000
2,179,000
38,000
2,217,000
9,000
10,000
3,000
500
143,000
11,000
194,200
7,000
201,200
5,480
244,000
219,000
201,000
222,000
234,000
1,133,390
4,000
l,ll7,390
Land withdrawn from planned timber harvesting for other forest uses such
as recreation sites, streamside buffers, and scenic zones, but included
in commercial forest land totals.
o
7,725,512
1,002,719
2,852,044
TIMBER SALES
:~.)vofiscal
lumes and
year
sa Ie prices of timber sold from lands managed by BLI1 during
1982 and fiscal year 1983.
FY 1982
Volume
District
'~]
11. bd. ft.
Lakeview
Burns
Vale
Prinevi lle
Salem
Eugene
QosebUrg
\ edford
Coos Bay
Oregon Total--
2,041
183
9,497
224,345
207,772
194,243
258,032
228,453
1,128,411
Spokane
Ore-Wash Total--
2,989
l,lll,400
FY 1983
Volume
Value
114,6B5
2,784
M.bd. ft.
Value
$
658,087
23,366,280
19,255,907
18,334,397
19,760,013
24,904,622
106,607,190
1,602
1,796
569
13,616
243,228
218,016
199,621
221,230
247,222
1,146,900
210,415
817,605
3,648
1,150,548
210,122
$136,753,828
$
$~06,
184,178
209,259
78,655
174,091
30,166,340
27,868,055
21,189,442
22,286,820
34,386,866
136,543,706
,:
i: :
~~
~
i~i))
~~'
j. ~
TIMBER HARVESTS
~' r ~'
"'
Acreages from which the timber sold during fiacal year 1982 and fiscal year
1983 will be harvested.
j,~
Oietrict
r!
''~ ~
lakeview--Burna
~I
~'I'
i~"
j,:~
iii;'
~:'~~,
I~~~;
i'~;
~~;. :
~,~~~ ;'
~ i#f~
Clearcut
Acrea
Partialcut
Acres
Clearcut
Rcres
-
366'
566
Val
Prineville
Sale
Eugene
Roseburg
Medford
966
3,385
3,145
4,198
4,935
330
354
4,391
515
1,023
14,897
1
3,616
Z.929
4,212
6,402
383
1,259
623
Z9~
7,291
8,843
Coos Bay
4,207
107
3,947
150
20,897
22,278
21,107
19,771
18
20,915
475
22,753
46
21,153
397
~
20,168~~~~~~~'~
Spokane-Ore-iJaah Total-
TIMBER TRESPASSES
District
FY 1982
Cases
Cases Closed
Pending
Collec9/30/80
tions
No.
Lakevie~r---Burne
Vale
Prineville-Salem---Eugene-Roseburg
Medford
Cooe Bay
Oregon Total-
1
7
15
12
23
45
15
118
1,200.00
8,592.40
35,338.10
33,389.6B
29,159.92
22,605.23
5,209.55
135,494.88
1
15
12
4
29
20
86
SpokaneOre~tash Total-
118
135,494.88
6
92
FY 1983
Cases Closed
Collections
No.
1
1
2
9
12
8
20
24
77
357.00
1,608.00
9,352.00
7,631.75
23,337.07
4,884.89
25,168.35
6,205.08
7B,544.14
77
78,544.14
Caoes
Pending
9/30/81
.
i
14
24
il
37
10
97
Small polee, li~eal feet~arge poles, lineal feet-
,
~
8,665
2,663
1,013
34,300.00
19,700.00
796.00
10,852
-
1,507.00
-
56,200
~46
444.00
322.00
-
4,589
425.00
8,400
216.00
Posts, each
23,329
5,495.00
15,063
3,324.00
_
=
173
34.00
15,035.00
5.00
985.00
97.00
41.00
150
562
3,002
146,273
2,850
-
60.00
1,327.00
36.00
5,264.00
105.00
-
Total
~
6
103
!
~
~~~ )
$ 88,900.00
12,651.00
150.00
1,960.00
Manzanita, tons
j)/ I/
32,082
475
300
-
Mine timbers, each
Pulpwood, cords
Cascara bark, pounds
Bougha, pounds
Ferns, bunches
f ~ y~ o~es, bushels
L ~,.~Nuckleberry brush, bLnchesChristmas trees, each
Wildings, each
Moss, pounds
q rrar stock, coi^ds
Fence stays, each
Greens, bunches
~ Pitch, 9allons
~ Car stakes, each
~~~~') .
Value
93,180
Split rails, eac~
Ii
Quantitv
Corral poles, lineal feet-
Corral poles, each
i
Value
Ouantity
Oregon and Washington:
Fuelwood, ~o ►'ds
Shingle bolts, corde
Small poles, eac ■`~
Partialcut
Acres
549
112
FY 1983
FY 1982
Item and Unit
~
b1
-
Oregon Total
'~
FY 1983
FY 1982
;~~
~ ~~INOR FOREST PRODUCTS SAIES
l~ J)
4,497
405
53,449
2,013
355
8,438
277.OU
4,856
190.00
1,781
300
7,103
154
520
31
1,373.00
19.00
213.00
4,569.00
166.00
16.00
2,120
1,928
17,443
63
20
3,100
2,155.00
120.00
479.00
1,478.00
1.00
46.00
600
60.00
500
50.00
300
15.00
10.00
$133,544.00
-
70,872.00
1
~
'.,,;~,~
FOREST DEVELOPMENT - I
\-.
<
FOREST DKVBLOPKBIT - II
I
~,
Reforestation wOrk in site preparation, planting, and seeding on commercial
forest land is tabulated here. Natural seeding is not included.
FY 1982
District
Site
Planti!!!:!
M
Preparation
Trees
Acres
Acres
Lakevieew~--------
Planting
& Seeding
Acres
70
41
70
70
41
70
2,279
2,795
2,655
2,926
8urns----------Va 1ee-----------Prineville----Sa le,mlD,.----------Eugene--------Ro seburg~-----
Medford-----Coos 8ay-------Oregon Total-
6,523
7,602
5,057
2,334
23,227
4,354
3,077
4,287
4,902
3,432
20,192
Spokane--------Ore-w&sh Total-
23,227
20,192
1. 711
Seedi!:!!:!
Pounds
Acres
Seeds
12,385
4,354
3,077
4,287
4,902.!l
3,432:'- .if
20,192;.7
12,385
20; 192
--L.ill
Reforestation treatments made to protect unestablisbed stands from animals,
inlects, and disease are tabulated· under "Protection.", Reforestation
treatments made to releale unestablisbed stands from campetins vesetation
are tabulated under "Release."
,
t
FY
1982
District
Lakeview-------------------Burns----------------------Vale---------------------Prineville-----------------Salem----------------------Busene---------------------,;"'\ Roseburs--------------------
(tl
Protection
Acres
Release
Acres
Protection
and Release
Acres
10
70
~::!O~:J--==============
Dreson Total--------'----
522
3,392
1,545
3,255
1,916
10,760
1,228
402
334
2,135
5,429
9,528
1,750
3,794
1,819
5,390
7,405
20,288
Spokane--------------------Dre-Wasb Total------------
10,760
9,528
20,288
FY 1983
District
Lakeview
Burns
Vale
Prine,ville
SalelD
Eugene
Roseburg
I'Iedford
Coos Bay
Oregon TotalSpokane
Ore-w&sh Total-
Site
Planting
Preparation
M
Acres
Acres
Trees
Seedi!:!!:!
Pounds
Seeds
Acres
Planting
FY
& Seeding
Acres
72
7
72
3,841
2,687
3,751
4,126
2,672
17,149
1,683
1,556
2,480
2,366
1,236
9,328
3,841
2,687
3,751
4,126
2,672
17,149
District
____
0
14,670
___
0
17,149
____
0
9,328
_____
0
17,149
Protection
Acres
Release
Acres
Protection
and Release
Acres
19
19
'2,519
1,277
1,666
1,504
2,795
9,780
2,802
2,100
3,860
5,530
(\:._, COos
"C.
OreSon Total----------
283
823
2,194
4,026
2,359
9,685
Spokane..:.-------------Ore~asb Total-----------
__
0
9,685
__
0
9,780
Lakevlew-------------------Burns---------'-----------Vale-----------------------Prinevi1le-----------------Salem--------------------BuSene----------------------
60
2,046
1.215
5,992
3,012
2,345
14,670
1983
Roseburs-------------------~
A~
lIedford---------------
BaJ---------------
2...ll!
19,465
___
0
19,465
FOREST DEVELOPMENT - III
:C)LD HORSE f'lANAGEMENT, FY 1983
Fertilization and thinning accomplishments on commercial forest land are
tabulated below. The "Tree Improvement" column reports acres seeded or
planted wi th genetically improved seed or seedlings. "Tree Improvement"
acres are included in the "Forest Development - I" Table.
,
FY 1982
lakeview
Burns
Vale
Prineville
lledford
Nevada
USFS 21
Total
District
Ferti lization
Acres
Improvement
Acres
Thinninq
Precommercial Commercial
Acres
Acres
Lakeview~-------
35
Burns------------Vale-------------Prinevi lle------
Spokane
Ore-lolash Total
296
1,409
2,233
3,023
2,530
3,405
12,635
296
12,635
100
Salem~----------
Eugene----------Roseburgl------Medford----------Coos Bay---------Oregon Total---
60
100
...i
6
6"
~
90
90
222
617
Horses Removed
FroIII Range
Claimed
or
wild
District 11 Branded
":C)S~.
~
District
Improvement
Acres
99
45
Lakeview--------Burns------------Vale-------Prineville~------
Salem~----------
Thinninq
Precommercial Commercial
Acres
Acres
500
Eugene----------Roseburg---------Medfordl----------Coos Bay---------Oregon Total--
500
47
Spokane
Ore-lolash Total
500
47
47
200
1,835
1,606
4,095
4,57B
~
41
60
1
2
4
13
22
184
Sent to
Adoption
Centers
104
249
1
1
2
1
21
49
54
101
..ll
5
55
ill
221
73
POPULATIONS ON BU. RANGELANDS, CUMULATIVE
Horses Removed from Range
12-15-71 to 9-30-83
Claimed
or Branded
Wild
Total
Horses
on Range
District
11
~
iirl.akeview
Fertilization
Acres
24
413
1
Y )rns
FY 19B3
1SO
263
"
1,152
1,152
-1.
" Disposition of Wild Horses
Returned In
Adopted
Died or
to
Corral
in
District Destroyed
Range
9-30-83
" Ie
Prineville
lied ford
Ore-Wash Total
1,235
2,308
2,403
360
~
6,341
1,623
26B
209
667
1,447
2,849
4,407
474
3,070
3,117
4,616
1,141
2,767
9,177
11,944
Horses
on Range
9-30-83
Level
to be
r.&intained
384
1,358
1,996
160-360
645-1,295
610-1,210
35
3,773
25-50
1,440-2,915
DISPOSITION OF CAPTURED WILD HORSES, CUMULATIVE
193
68
o
~~~O
15,841
800
15,841
800
District
11
)",\edew
31
Vale 3/
Prineville 11
lied ford
Ore-Wash Total
"Jns
Cumulative, 12-15-71 to 9-30-83
Died or
Returned
Destroyed
to Range
1,110
1,986
3,539
207
311
452
542
229
1
3
6,843
1,537
29
189
76
294
No wild horses are present in the Salem, Eugene, Roseburg, Coos Bay,
Prineville, or Spokane Districts.
11 These horses were gathered by USFS from USFS lands and processed by
Burns district during fiscal years 1982 and 1983.
11 . Includes 3 Vale, 3 Prineville, 102 Burns and 7 Nevada FY 81 residuals.
11
!" 'J'SOURCE
LIVESTOCK GRAZING
Grazing use is tabulated for grazing fee year 1983.
grazing fee for all BU'! lands was $1. 40 per ~.
During 1983. the
Major watershed conservation and range improvement jobs are tabulated here.
other accomplishments include preparation of watershed management plans.
soil stabilization. and water control.
Number
Number
Permits &
Cattle &
Number
Number
District ______________ ~L~e~a~s~e~s______~H~o~r~s~e~s____~S~h~e~e~p~____~A~UM~s~_
Lakeview
Permits----------Leases-----------Burns
Permi tSl----------Leases-----------Vale
Permits----------Leases----------Prineville
Permits----------Leases-----------Salem
Leases-----------Eugene
Leases-----------Roseburg
Leases-----------Medford
Leases-------Coos Bay
Leases-----------Oregon Total-Spokane
Leases-----------Ore4lash Total--
131
62
170
38.602
1.492
962
1.765
387
116
96.756
1.439
8.695
339
469.886
4.544
126
15.884
3.048
1.075
569
61.226
17.627
213
District
I(j!'
100
Fencing
Miles
15
83
14
100
~
4.431
Spokane--------Ore-Wash Total-
4.431
Water
Development
Numbers
16
114
29
3
11.552
115
159
___
5
---.1
_3
11.557
117
162
588
8
115
21
1.124
386
1.066
118
5.237
97
22.602
1983
_ _6
___
5
_____1
1.502
212.568
13.909
--1Zl
1.875
- 6.526
219.094
---1.2Q
14.099
_ _3_8
954.587
District
Number
Permits &
Leases
1.487
---.ill
1.852
Number
Cattle &
Horses
Number
Sheep &
Goats
212.787
13.829
~
~
-218.499
14.069
Vegetation
Manipulation
Acres
Lakev iew~----
Burns---------Vale------------Prinev i lle,-----Salem
28.445
983.032
Number
AUMs
Spokane---------Ore-Wash Total--
936.410
27.021
963.431
11
o
810
8.235
2.320
!I
Grass
Seeding
Acres
81011
9.060
1.470
Fencing
Miles
25
2 11
36
19
Water
Development
Numbers
49
46
75
5
Eugene~--------
Roseburg,--------!ted fordl---------i '}s Bay
'·"~regon Total----
Grazing use totals during grazing fee year 1983 were:
Oregon----------Was hi ngton------Ore4lash Total--
3.881
Prinevi lle'------Salem
Eugene----------Roseburgl-----ford
I, ' s Bay'-------", reg on Total----
Grass
Seeding
Acres
4.780
4.575
1.400
672
450
Vale'------~-----
Above figures do not include numbers authorized by Exchange of Use Agreement.
District
Vegetation
Manipulation
Acres
Lak ev i ew--------Burns,-------------
192.269
19.667
45.075
3.791
20
FY 1982
159.914
5.160
144
DEVELOPMENT AND CONSERVATION
Fire Rehabilitation
100
100
--!.Q
~
11.475
---ll2
11.595
11
11.465
93
11.465
93
175
~
178
:(j)
RESOURCE DEVELOPMENT AND CONSERVATION
Big game animals which used lands managed by BLM dUring fiscal year 1983.
FORAGE AND FENCING--Cumulative totals from 1934 through 9/30/83.
Vegetation
Manipulation
Acres
Grass
Seeding
Acres
Lakevie_
Ourns
Vale
Prinev i 11e-Salem
Eugene
Roseburg--Medford
Coos Bay--Oregon Total-
27,711
29,689
358,455
32,079
107,768
210,763
356,134
50,782
200
200
941
448;1i4
7z6.5e8
Spokane
Ore-wash Total
~
449,619
-Lill
District
:Juniper
Management
Acres
733,737
495
20
16,226
16,741
16,741
Cattle
Fencing Guards
Number
Miles
Truck
Stock
Trail
Miles
1,381
1,843
3,405
1,045
163
128
435
104
46
100
7,720
930
1,631
-ID
---2
_ _3
1,634
935
7,855
'yG GAME POPULATION ESTIMATES
District
599
600
432
Pronghorn
Antelo2e
Deer
Elk
20
350
6,250
150
2,400
560
660
500
2,500
13,390
Lakeview
OUrns
Vale
Prineville
Salem
Eugene
Roseburg
Medford
Coos Bay
Oregon Total--
2,500
4,500
5,300
1,600
13,900
40,000
40,000
41,000
20,000
19,000
10,600
16,600
35,000
15,000
245,200
Spokane
Ore-Wash Total--
_ _3_5
13,935
10,000
255,200
()
Bighorn
Sheep
Mountain
Goats
60
350
280
5
690
~~
13,640 1,005
Black
Bear
Cougar
5
20
15
00
10
230
340
90
500
200
1,405
20
10
20
5
20
25
15
50
~
225
160
165
---1QQ
1,505
.-!!
/
""".
WILDLIFE HAOITAT ON BLM LANDS as of 9/30/03.
WATER DEVELOPMENTS--Cumulative totals from 1934 through 9/30/83.
Oistrict
Lakeview
Burns
Vale
Prinev i lle--Salem
Eugene
Roseburg
Medford
Coo. Oay
Oregon TotalSpokane
Ore~.h
Total-
Pieelines
Number
Tanks
Miles
95
257
595
150
108
270
682
125
5
15
Number
Reservoirs
1,111
1,059
1.154
218
14
45
35
-.-ll
1.097
__1_1
1,108
1,205
3,664
-1.i
__
2
3,666
1,219
Number
Sl!rings
141
208
978
20
Number
Wells
20
190
~
---2
1,411
Small Game
Acres
Waterfowl
Acres
-Lakeview
Ourns
Vale
Prinevi lle
Salem
Eugene
Roseburg
Medford
Coos Bay
Oregon Total--
2,500,000
3,089,095
3,153,000
1,242,000
405,000
304,400
424,000
900,000
200,000
12,297,495
2,000,000
2,492,300
4,260,000
1,430,000
405,000
304,400
424,000
900,000
300,000
12,515,700
30,000
16,795
10,600
10,000
15,000
22
Spokane
:)re-Wash Total--
307,700
12,605,195
307,700
12,023,400
'1~)strict
39
81
57
13
1,367
Big Game
Acres
195
')
2,200
Fishable
Streams
Mi les
51
231
735
345
620
284
268
540
04,717
~
3,410
4,000
00,717
~
3,538
---1QQ
243
WILDLIFE HABITAT
~ROV~ENT
RECREATION MANAGEI'IENT
i .)
Bru.h Control
Acru
District
1982
Lakeview-----Burn.---Valee----Prineville-Sa 1e ....- - - Eugene---Ro.eburgr.edford--Coos Bay--Oregon Total-
Gra •• /Legume
Seed in<!, Ac re.
1982
1983
--,"~1~·l~e;..!.~_
water
Development
Number
other
Wildlife
I .. prove .... nt.
1982
1982
1982
Fencing
1983
1983
300
240
5
2
500
150
550
1,000
30
5
5
1983
22
7
5
12
1983
270
SpokaneOre-wa.h Total
795
6
7
270
- - -4
1,595
200
204
35
199
- -4
1,749
1,595
200
Number
District
1
Lakeview
8
Burn.
4
Prineville--10
Vale
16
Salem
4
Eugene
10
Ro.eburg
9
Medford
Coos Bay
.269
Oregon TotalSpokane
2
70
Ore-lolash Total
24
3
80
400
50
·l
1,749
15
15
---.£
48
38
481
245
_3
51
.:l
...!!
...ll
40
493
267
Recreation Sites
Use Fee.
Number Units
Amount.
Picnic
camp
50
55
43
140
160
29
101
57
125
760
760
0
31
$ 3,130.50
33
14
205
82
78
94
~
629
_3
632
6,700.00
30,539.34
9,596.00
19,065.56
4,350.00
41,012.00
$114,393.40
$114,393.40
Special Recreation Use
Permit.
Permits
Permi t.
Amounts
Number
220.00
265.00
11,279.00
2,670.00
104.00
0
0
6,455.00
20.00
$21,013.00
1,550.00
$22,563.00
2
4
95
84
4
0
0
83
$
~
274
_1
275
Data as of 9-30-83 for FY 1983.
:~STII1ATED RECREATION VISITS TO BLP! LANDS (Thousands of Hours)
AQUATIC HABITAT
!I
I"PROV~ENT
Strea.. 2/
Clearance
"ile.
Di .trict
lakeview..- - - Burn.----Va 1e e - - - - - Prineville-----Sa 1e....- - - - Eugentee----Ro.eburg---r.edford---Coo. Bay---Oregon TotalSpokanee---Ore-wash Total
1982
1983
Fi scal Year 1983
Spawning
and/or
Rearing
Area
Mile.
~/
Improved
Fi.h
Passage
Miles
Y
Fencing
Mi leo
1982
1983
1982
1983
1982
9
4
1
5
2
4
Reservoirs
Acre.
1983
1982
3
10
2
5
20
7
7
7
3
1
7
--1
...1.
~
5
16
43
5
16
43
2
4
3
~/
2
16
15
6
~/
381
3,908
858
6,714
4,314
4,068
2,263
579
1,930
wa.hington
228
7
5
76
12
63
84
2
48
!/ Includes recreation related driving for plea.ure.
1/ Include. bicycling, horseback riding, backpacking, hiking and walking
4
27
14
20
27
14
20
1/ "iles refer to number of .tream mile. where fish production will be
£/
!/
1983
Oregon
Use
Off-road vehicle travel
Other motorized travel 1/
Non-motorized travel 1/, ~ Camping
JHunting
, Fi.hing
Boating
Winter sports
Other ~/
0
for pleasure.
Include. sightseeing and water related activities out. ide of boating
(.wimming, etc.).
ESTI"ATED RECREATION VISITS TO BLP! LANDS - Fiscal Year 1983
Jtate
~
increased by the project •.
Removal of debris jams.
Includes fish passage over waterfalls and dams and through culvert •.
Includes new projects and improvement of existing water.
)
Oregon
washington
Total
Number of vi.its
3,772,000
150,400
3,922,400
S~RY
I \,
OF WILDERNESS INVENTORY RESULTS
Total Acres Burned by Problem Class During 1983:
)
Wilderness study areas - 80 areas
Lands lacking wilderness characteristics
O&C lands eKempted from wilderness review
Total public lands (Based on 1978 Acreage)
problem Class
I
II
2.479.100
11.486.200
1,759,200
15,724.500
III
IV
V
VI
Acres
--1-352.672
50.306
54.934
10.587
30.294
Washington
Number of Fires by Size Class During 1983:
Wilderness study area - 1 area
Lands lacking wilderness characteristic.
Total public lands
FIRE STATISTICAL
5.500
304.700
310.200
Size Clas.A
B
C
S~ARY
Number of fires and acres burned on lands managed by the Bureau of Land
in Oregon and Washington during 1983.
Number
141
50
25
D
14
E and larger
False Alarms
36
62
~nagement
Number of
~n-caused
Fires
Lakeview
8urns
Vale
Prineville--Salem
Eugene
Roseburg
I1edford
Coos Bay
Oregon TotalSpokane
Ore~sh
Total-
4
19
16
11
5
0
2
3
....i
64
...l
67
Acres
Burned
2.089
8,134
4,871
1,760
42
0
0
0
__
6
16.902
4,660
21,562
Number of
Lightning
Fires
33
54
20
59
2
3
27
---.!!
199
---.!!
199
Acres
8urned
Total
Number
Fire.
84.825
29,352
60.612
2.446
0
37
0
2
0
4
___
0
177.239
5
30
0
177,239
Average Number of Fires Annually During Five Years. 1979-1983:
l'Ian-caused - 11 5
Lightning-eaused - 193
Acre. burned - 78.224
Total fires for 5 years - 1,540
73
36
70
6
'~JOADS
Total_
Acres
CONSTRUCTED
~
86.914
37.486
65. 483 ,('::~
4.206: ) "
42't'
.'
District
Lakeview,
Burns--~-------
)
Vale------------Prineuillee--------Total. Eastern Oregon
0'
o
---.!
___
6
Sale'mmr--~----
263
194,141
_3
266
~
Eugene-----------Roseburg------------Medford------Coos Bay-----------"Total. Western Oregon
198,801
Oregon Total-----
'J'
pokane
'
" ,Total. Oregon/Washington
Average Number of Fires Annually During Ten Years, 1974-1983:
~n-caused - 100
Lightning-caused - 231
Acres burned - 47.100
Total fires for 10 years - 3,308
)
Miles 8uilt With
Al!l!rol!riated Funds
FY
FY
Total to
1982
1983
9/30/83
Miles Built Under
Timber Sale Contracts
FY
Total to
FY
1982
1983
9130/83
45
132
97
47
148
110
312
_3
4
1
1.5
.5
_4_
7
168
80
148
205
21
40
64
41
30
35
53
48
-ill
21
...n
189
960
1.496
1.848
3.432
1.193
8.929
1,109
203
196
9.407
1,109
203
~
~
--.-iQ.
797
199
205.5
----1ll
478
9.416.5
RIGHTS OF WAY
Right of way permits issued by the Oregon State Office during the 1982 and
1983 fiscal years. (Does not include permits for logging roads in western
Oregon. )
Oregon
FY 1982
FY 1983
Kind
Electric Transmission Lines----Telephone, Telegraph Lines-----Communication Sites
Water Pipelines, Ditches, etc.-Roads, Highways, Material SitesAirports
Sewer Lines
Oil and Gas Pipeline
Total
14
7
3
5
8
....!
38
)
District
2
1
3
4
72
8
191
FY 1982
Direct
Eminent
Purchase
Domain
Lakeview
Burns
Vale
Prineville
Baker
Salem
Eugene
Roseburg
Medford
Coos Bay
Spokane
Ore-Wash Total
Washington
FY 1982
FY 1983
35
33
1
50
ROAD RIGHT OF WAY EASEMENTS AND LANDS ACQUIRED
4
17
,0
The Bureau of Land Management performed maintenance on 6,500 miles of
permanent roads in western Oregon and 811 miles in eastern Oregon and
Washington during FY 1982. Approximately 7,311 miles of BLM roads were
maintained during FY 1983 by BLM, with an additional 4,000 miles being
maintained by timber ~~rchasers and under agreements with counties or tim~.
'~."
companies.
'J
2
4
')
Right of way permits issued for logging, and reciprocal right of way and road
use agreements signed.
Spokane
Ore-wash Total--
4
1
5
6
10
9
7
53
~
107
107
2
10
23
1
1
3
2
64
10
--.!.
-.1.
65
13
...!
2
2'
2
67
2
FY 1982'
Direct
Eminent
Purchase
Domain
Salem
Yaquina Head ONA
Medford
Rogue River Scenic Easements
Provolt Seed Orchard
Total Other Acquisitions
1
2
4
4
.'
(of
FY 1983
Direct
Eminent
Purchase
Domain
3)
4
9
5
~
14
o
MINERALS
Aqreements Signed
FY 1982
FY 1983
2
16
8
5
6
3
8
25
12
41
Item
Lakeview
Burns
Vale
Prinevi lle
Baker
Salem
Eugene
Roseburg
Medford
Coos Bay
Oregon Total--
11
4
7
2
9
OTHER ACQUISITIONS
District
ROAD RIGHT OF WAY PERMITS AND AGREEMENTS
Permits Issued
FY 1982
FY 1983
2
1
4
....!
ROADS MAINTAINED
District
FY 1983
Direct
Eminent
Purchase
Domain
.~')
.,
Oregon
FY 1982
FY 1983
Mineral Patents Issu·ed----Coal Leases Issued, Acres-Coal Leases in Force, Acres5,403
Oil & Gas Leases Issued, Acres- 6,770,039
Oil & Gas Leases in Force,
Acres--------------------- 9,022,931
P.L. 167 Determinations,
Completed, Acres----------Cumulative Determinations,
Acres-BLI'1 Lands------------- 3,203,412
Cumulative Determinations,
Acres-FS Lands-------------- 14,254,030
Cumulative Determinations,
Total
17,457,442
Claims Retaining Surface Rights
Numberr----------------_____
Acres----------------______
75
1,500
Washi!:!9 ton
FY 1982
FY 1983
3
5,430
721,730
521
1,161,335
521
491,351
5,987,386
1,315,404
1,370,327
3,203,412
157,311
157,311
14,254,030
9,808,613
9,808,613
17,457,442
9,965,924
9.,965,924
75
1,500
6
120
120
6
r-..'·_. ·
,
.
.
-"
j
.J
COMPETITIVE GEOTHERMAL LEASES
In effect 9-3c)-82
Acres
No.
District
13,586.14
44,553.34
11,918.44
6,858.40
76,916.32
7
20
6
Lakeview
Burns
Vale
fS-oregon
Total
In effect 9-3c)-83
No.
Acres
.2
38
3
20
4
-.!
II
7,114.53
43,873.34
8,393.37
9,431.21
68,812.45
NONCOMPETITIVE GEOTHERMAL LEASES
In effect 9-3c)-82
No.
Acres
District
Lakeview
8urns
Vale
Prinevi 11e
fS-oregon-.!1
fS-Washington-l/----Total
11
28
In effect 9-3c)-83
No.
Acres
43,438.47
34,304.26
121,116.41
86,048.87
50,848.51
62,503.31
398,259.83
24
75
52
33
21
243
18
45
22
171
...ll
283
Remaining
to be Reviewed
As of 9-3c)-83
No.
~
Reviewed in FY 1983
Revoke
Continue
No.
Acres
Acres
~
998.94
30,479.62
69,999.10
37 ,743.33
328, 716. 94a.
52,866.37:.'
520,804.30 .
Oregon
Wi thdraw<ils
Land Classifications
61
95,767
11
15,739
Washington
'Wi thdrawal s
Land Classifications
42
55,389
8
1,361
471
1,020,040
103
151,156
19
17,100
1,078
2,037,871
~l
607
'hJfRAL LANDS SUBJECT TO MINERAL LOCATION AND LEASING
As of 9-3c)-83.
I,017,Bll
1.1
BLM has leasing responsibility on National forests.
Oregon
WITHDRAWAL REVIEW DETERMINATIONS
Reviewed in FY 1982
Revoke!
Continue
No.
Oregon
Wi thdrawals
Land Classifications
74
55
Washington
Withdrawals
13
land Classifications. --2
Total
151
468,861
9,499,285
36
13
Acres
293,793
3,891,239
Remaining
to be Reviewed
As of 9-3c)-82
No.
Acres
679
G
1,129,337
732,081
21,750
7
--1
1,232
271
521
1.076,790
10,721,977
58
4,186,535
1,200
2,206,127
.,
Acres
Open
"')
Acres
Closed
Washi!)9ton
Acres
Acres
Open
Closed
{\... ry and Location
Under the Mining laws
33,604,000
828,000
8,819,000
2,814,000
Application and Offer
Under the Mineral
leasing Laws
34,655,000
1.192,000
10,593,000
2,400,000
11
Acreage includes federal subsurface ownership and acquired lands.
lANDS TRANSfERRED BETWEEN BlM .AND OTHER FEDERAL AGENCIES
()
Oregon
Jurisdiction Transferred to BLM
Jurisdiction Transferred from BLM
Washington
Jurisdiction Transferred to BLM
Jurisdiction Transferred from BLM
o
9,348
208
170
4,576
2,689
4,736
1
o
LAND LEASES
In effect 9-30-82.
Oregon
Number
Acres
Kind
Recreation & Public Purposes Act-Small Tract---------------------Airport-------------------------Mining Claim Occupancy Act------Public Works Leases-------------Communication Site Leases-------Special Land Use Permi ts,--------Total--------------------------
60
35
Washington
Number
Acres
4,370
51
296
37
5
10
13
1,449
II
____
9
4
1
~
201
100,787
105,546
26
1,459
LAND LEASES
In effect 9-30-83.
Ore9on
Number
Acres
Kind
Recreation & PUblic Purposes Act-Small Tract---------------------Airport------------------------Mining Claim Occupancy Act------Public Works Leases-------------Communication Si te Leases-------Special Land Use Permi ts--------Sec. 302 FLPMA Leases, Permits
and Easements-----------------Total-------------------------
56
Washi[!9ton Number
Acres
5
10
1
1
89
3,604
41
211
37
4
1
86,879
103
299
144,829
235,606
34
15
1,450
=.
12
6
28
1,457
PUBLIC LAND SURVEYS
FY 1982
Kind
Miles of Line Retraced
or Surveyed
Corners Monumented-----Plats Accepted
Ore90n
Washi!!9 ton
647
1,290
77
21
Ore90n
770
1,082
58
FY 1983
Washi[!9ton
166
350
15
•
1/ Includes one sale of 45 acres of acquired land conveyed by a quitclaim
. ) deed.
~. This patent was to supplement a patent issued a previous year to include
additional land due to the exchange applicant. No land was received
during this year but was included in the report for the previous year.
J
.1
'1
LANDS RECEIVED BY BlJ1-
FY 1982
Acres
Oregon
Ex chang es-----------------------------Reconveyance of Recreation & Public
Purposes Act Land:-------------------Acquistions in Fee--------------------Total Oregon~-----------------------
FY 1983
Acres
681
29,933
10
_ _ _3
-2§1
694
30,377
Washington:
Ex chang es-----------------------------Reconveyance of Recreation & Public
Purposes Act Land:-------------------Total Washington,------~-------------
o
o
Ore-Wash Total---------------------------
694
30,377
•
'~.~'
77
()
,.
Ai
•
';
.)
1
~I
As the Nation's principal conservation
agency, the Department. of the Interior has
responsibility for most of our nationally
owned public lands and natural resources.
This includes fostering the wisest use of our
land and water resources, protecting our fish
and wildlife, preserving the environmental and
cultural values of our national parks and
historical places, and providing for the enjoyment of life through outdoor recreation. The
Department assesses our energy and mineral
resources and works to assure that their
development is in the best interest of all our
people. The Department also has a major
responsibility for American Indian res(>J"vation
communities and for people who live in Island
Territories under U.S. administration.
© Copyright 2026 Paperzz