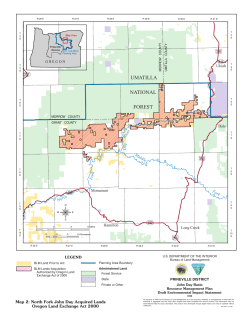
ELM FACTS OREGON AND WASHINGTON 1970 - 1971 . SPOKANE WASHINGTON UNITED STATES DEPARTMENT OF THE INTERIOR BUREAU OF LAND MANAGEMENT UNITED STATES DEPARTMENT OF THE INTERIOR Bureau of Land Management Oregon and Washington ->'y' " BLM FACTS Contents ) ) () \ J ) Page BLM Offices in Oregon and Washington--------------------~--- Lands Managed by BLM---------------------------------------- Permanent Employees of BLM---------------------------------- Payments to Counties and States, FY 1970-------------------- Payments to Counties and States, FY 1971-------------------- Resource Management Receipts-------------------------------- Expenditures for Resource Management------------------------ Commercial Forest Land--------------------------------------Timber Sa1es------------------------------------------------Timber Harvest Acreages------------------------------------- Timber Stand Improvement (Precommercia1)--------------------Reforestation-----------------------------------------------Non-Timber Forest Products Sa1es----------------------------Timber Trespass---------------------------------------------Livestock Grazing-~-----------------------------------------Forage Provided---------------------------------------------Big Game Population Estimates------------------------------- Resource Development and, Conservation-~---------------------Recreation Sites------------------~-------------------------Estimated Recreation Visits-------------------------~-------Fire Contro1------------------------------------------------ Land Leases------------------------------,-------------------Lands Classified for Multiple Use Management----------------Minerals----------------------------------------------------Land Patents Issued----------------------------------------- Lands Received by BLM--------------------------------------- Road Right of Way Permits and Agreements-------------------- Road Right of Way Easements and Deeds Acquired--------------Roads Constructed-------------------------------------------Miles of Road Maintained------------------------------------Rights of Way-----------------------------------------------Public Land Surveys------------------------------------------ 2 3 3 4 5 6 6 7 7 8 8 9 10 10 11 12 12 13 14 15 16 17 17 17 18 18 19 19 19 20 20 20 This booklet contains statistics about the Bureau of Land Management in Oregon and Washington. Most of the figures pertain to fiscal year 1971 (July 1, 1970 to June 30, 1971). For compari son, data for the preceding year are usually listed, too. In a few cases it has been more appropriate to list data on a calendar year basis. As one means of conserving natural resources, this booklet is printed on recycled paper. August 1971 1 UNITED STATES DEPARTMENT OF THE INTERIOR Bureau of Land Management Oregon and Washington Archie D. Craft State Director ',i) I I .'}~ I ' .: LANDS MANAGED BY THE BUREAU OF LAND MANAGEMENT Public lands under the exclusive jurisdiction of the Bureau of Land Management, United States Department of the Interior, in Oregon and Washington. Includes public domain, revested Oregon & California Railroad grant lands, reconveyed Coos Bay Wagon Road grant lands, Land Utilization Project lands, and certain other categories. Acreages are as of June 30, 1971 and are approximate. Lands managed by BLM are 25 percent of the total acreage of Oregon and less than 1 percent of Washington. OREGON STATE OFFICE 729 NE Oregon Street P. O. Box 2965 Portland, Oregon 97208 234-3361 Ext. 4001 LAKEVIEW DISTRICT 357 North L Street P. O. Box 151 Lakeview, Oregon 97630 947-2177 BURNS DISTRICT 74 So. Alvord Street Burns, Oregon 97720 573-2071 VALE 'DISTRICT 365 A Street West P. O. Box 700 Vale, Oregon 97918 473-3144 PRINEVILLE DISTRICT 185 East 4th Street P. O. Box 550 Prineville, Oregon 97754 447-4115 BAKER DISTRICT Federal Building P. O. Box 589 Baker, Oregon 97814 523-6391 Chester E. Conard District Manager SALEM DISTRICT 3550 Liberty Road South P. O. Box 3227 Salem, Oregon 97302 585-1793 Boris T. Vladimiroff District Manager PERMANENT EMPLOYEES OF BLM EUGENE DISTRICT 1255 Pearl Street P. O. Box 392 Eugene, Oregon 97401 342-5141 Joseph C. Dose District Manager District ROSEBURG DISTRICT 1928 Airport Road P. O. Box 1045 Roseburg, Oregon 97470 672-4491 George C. Francis District Manager MEDFORD DISTRICT 310 West 6th Street Medford, Oregon 97501 779-2351 Donald J. Schofield District Manager COOS BAY DISTRICT 375 Park Avenue P. O. Box 1139 Coos Bay, Oregon 97420 267-3138 Edward G. Stauber District Manager Donald G. Gipe District Manager I Ij I Dis trict 456-2570 SPOKANE DISTRICT West 920 Riverside Avenue Spokane, Washington 99201 2 L. Christian Vosler District Manager Marlyn V. Jones District Manager, Acting Donald Z. Robins 'District Manager Paul W. Arrasmith District Manager I I i i I o Acres Coos Bay----------------------------------------- Oregon Total----------------------------------- 3,213,000 3,485,000 4,666,000 1,385,000 546,000 415,000 317 ,000 424,000 911,000 330,000 15,692,000 Spokane------------------------------------------ Ore-Wash Total--------------------------------- 292,000 15,984,000 Lakeview----------------------------------------- Burns-------------------------------------------- Vale--------------------------------------------- Prineville--------------------------------------- Baker-------------------------------------------- Salem-------------------------------------------- Eugene------------------------------------------- Roseburg----------------------------------------- Medford---------~-------------------------------- t, ) January 1 1970 January 1 1971 Lakeview------- -------- Burns---------- -------- Vale------------ ------- Prineville----- --------- Baker---------- -------- Salem---------- -------- Eugene--------- -------- Roseburg------- -------- Medford-------- -------- Coos Bay------- -------- Spokane-------- -------- 23 28 47 27 20 127 84 96 115 97 13 23 29 45 28 19 125 84 96 120 99 12 23 28 46 30 20 127 80 95 123 100 11 State Office--- -------- Ore-Wash Total -------- -E 105 785 117 800 774 3 June 30 1971 PAYMENTS TO COUNTIES AND STATES, FY 1970 PAYMENTS TO COUNTIES AND STATES, FY 1971 Distribution of proceeds to Oregon Oregon and Washington derived from administered by the Bureau of Land Revenues are from sales of timber, rental and sales of land, and from year 1970. Distribution of proceeds to Oregon Oregon and Washington derived from administered by the Bureau of Land Revenues are from sales of timber, r~nta1 and sales of land, and from year 1971. ' Resource Management O&C Lands Oregon Counties Baker----------- Benton---------- C1ackamas------- C1atsop--------- Co1umbia-------- Coos------------ $ Mineral & Grazing Public Domain *inc1udes CBWR Pay!!!ents $ 829,205.88 1,631,805.13 610,802.88 1,741,037.26 Crook---~------- Curry----------- Deschutes------- Doug1as--------- Gi11iam--------- Grant----------- Harney---------- Hood River------ lackson--------- lefferson------- Josephine------- K1amath--------- Lake------------ Lane------------ Linco1n--------- Linn------------ Ma1heur--------- Marion---------- Morrow---------- Multnomah------- Po1k------------ Sherman--------- Ti11amook------- Umatil1a-------- Union----------- Wa110wa--------- Wasco----------- Washington---- Whee1er--------- Yamhi11--------- Tota1--------- counties and to the States of resource manag'ement on lands Management in those states. grazing fees, mineral fees, other sources during fiscal 1,080,792.75 7,392,031.05 4,624,076.91 3,564,700.01 690,513.08 4,506,040.48 106,232.78 779,040.40 430,832.95 1,794.78 9.57 35.00 345.00 *323,564.19 26,353.69 142.00 1,578,64 54,475.56 1,373.59 6,462.86 9,9,96.50 1,267.10 1,051. 72 73.14 1,972.37 4,510.85 5.00 71.88 15,072.01 22.50 7.53 214,437.46 637,396.68 165,251.00 185,231.93 212,465.56 $29,401,894.19 1,115.50 16.25 232.00 24.90 469.45 1,65,7.36 67.50 1,731. 82 2.50 $455,502.76 Total Pay!!!ents $ 1,794.78 829,215.45 1,631,805.13 35.00 611,147.88 2,064.601.45 26,353.69 1,080,934.75 1,578.64 Baker-----------Benton---------- C1ackamas------- C1atsop--------- Co1umbia-------- Coos------------ Crook----------- Curry----------- 1,373.59 6,462.86 9,996.50 Payment to State of Oregon from sale of public domain 78,987.81 timber, materials, lands, etc.----------------- Paymeni to State of Wash. & Wash. counties, 10,165.46 all sources------------------------------------Total payments to counties and States, FY 1970 $29,946,550.22 $ $ 30.00 345.00 *372,942.29 36,372.86 159.50 661,588.18 1,886,490.32 -1,170,776.42 898,884.47 1,768,629.61 30.00 661,933.18 2,259,432.61 36,372.86 1,170,935.92 ')" "."" '~ ) ) 8,067,892.40 8,009,590.25 (est.)*58,302.15 Doug1as--------~ 2,000.52 2,000.52 Gi11iam--------- 10,637.57 10,637.57 Grant-----------25,775.95 25,775.95 Harney---------- Hood River------ 5,01l,840.62 1,450.23 Jackson--------- 5,010,390.39 1,213.03 1,213.03 Jefferson------- 3,862,601.91 92.92 Josephine------- 3,862,508.99 750,760.72 2,559.47 748,201.25 K1amath--------- 6,769.19' 6,769.19 Lake------------ 4,882,492.73 Lane------------ 4,882,492.73 5.00 115,1l2.88 115,107.88 Linc01n--------- 844,124.48 844,124.48 Linn------------ 38,523.85 38,523.85 Ma1heur--------- 466,835.70 9.28 466,826.42 'Marion---------- 73.32 73.32 Morrow---------- 241,309.30 241,309.30 Multnomah------- 690,647.30 690,647.30 Po1k------------ 1,353.39 1,353.39 Sherman--------- 179,056.71 179,056.71 Ti11amook------- 361.11 361.il Umati11a-------- 66.02 66.02 Union----------- 552.20 552.20 Wa11owa---------2,132.54 2,132.54 Wasco----------- Washington------ 200,763.36 67.50 200, 830~ 86 - Whe e Ie r--------- 1,949.86 1,949.86 Yamhil1--------- 230,215.76 230,215.76 Tota1----------$31,867,200.32 $564,148.25 $32,431,348.57 Payment to State of Oregon from sale of public domain timber, materials, lands, etc.-----------------$107,127.33 Payment to State of Wash. & Wash. counties, all sources-------------------------------______ 21,511.93 Total payments to counties and States, FY 1971 $32,559,981.83 / 4 $ 403.5C 898,480.97 1,768,629.61 Total Payments Deschutes------- 7~446,5U6.61 4,625,344.01 1,051.72 3,564,773.15 692,485.45 4,510.85 4,506,040.48 106,237.78 779,112.28 15,072.01 430,855.45 7.53 214,437.46 637,396.68 1,115.50 165,267.25 232.00 24.90 469.45 1,657.36 185,299.43 1,731.82 212,468.06 $29.857,3'16.95 Mineral & Grazing Pub I i c Domain *inc1udes CBWR Pay!!!ents Resource Management O&C Lands Oregon Counties counties and to the States of resource management on lands Management in those states. grazing fees, mineral fees, other sources during fiscal 5 RESOURCE MANAGEMENT RECEIPTS COMMERCIAL FOREST LAND ')"" ,; Total collection made by the Bureau of Land Management from the indicated source. Collections are deposited in the U. S. Treasury. Oregon Source FY 1970 Mineral Leases------- $ 73,635 Timber Sales, O&C 11- 58,803,788 2,642,467 Timber Sales, CBWR II 1,812,028 Timber Sales, PD----- 162,667 Land & Material Sa1es 432,540 Grazing Fees--------- 1,398 Rent of Land--------- Fines, Penalties & Forfeitures-------- 63,379 Other Sources-------- 31.255 Tota1-------------- $64,023,207 Washington FY 1971 FY 1970 FY 1971 280 $ 15,008 183,541 $ 63,734,401 2,616,176 2,636,122 42,062 603,429 1,729 $ 42,036 22,951 14,922 590 165,622 2,216 18,566 228 62,978 41.726 $69,922,164 272 1.823 $144,277 530 7.337 $209,507 Data are as of 6-30-71 Commercial Forest Land Acres District Lakeview-----------------Burns-------------------- Va1e--------------------- Prinevi11e---------------- 30,000 53,300 2,000 8,900 Sa1em--------------------Eugene-------------------Roseburg----------------- Medford------------------ Coos Bay-----------------Oregon Tota1------~----- 72,150 20,692 351,812 298,955 376,088 689,631 277 .200 2,169,828 9,-100 3,900 267,000 173,000 187,000 272,000 228.000 1,150,900 Spokane------------------ Ore-Wash Tota1---------- 52.600 2,222,428 5,500 1,156,400 Baker--------~----------- 11 Includes receipts from all sources on O&C lands. FY 1970 receipts from O&C lands managed by USFS amount to $10,366,378 and FY 1971 receii~ amount to $6,682,186. Annual Allowable Cut M.bd.ft. '-'I II Includes receipts from all sources on CBWR lands. r) )~. ........ .. , ,., TIMBER SALES Volumes and sale prices of timber sold from lands managed by BLM during fiscal years 1970 and 1971. EXPENDITURES FOR RESOURCE MANAGEMENT For BLM in Oregon and Washington FY 1970 FY 1970 Investments Soil and Watershed Conservation------- $1,560,600 144,000 Range Improvement--------------------- Range Fire & Storm Damage Rehabilitation 170,600 Building Construction----------------- 12,335,800 Road Construction & Acquisition------- 631,800 Recreation Construction~-------------- Forest Deve10pment-------------------- / 1,189,400 2,777,900 Maintenance of Capital Investments----Resource Protection Fire Presuppression------------------- Forest Protection--------------------- Blister Rust Contro1------------------- FY 1971 $1,287,500 145,100 175,500 5,647,300 387,000 1,697,700 3,512,600 354,200 921,500 85,100 7,843,900 300,300 301.600 Tota1------------------~--------------- $28,631,500 7,454,400 318,500 340.100 $22,326,500 Expenditures for FY 1970 totaled $28,631,500 -'J, :) ) I( . FY 1971 Value Volume M.bd.ft. Value Lakeview-------1,856 6,190 Burns----------Va1e----------- Prinevi11e-----13,884 3,222 Baker----------Sa1em----------408,850 225,152 Eugene---------300,499 Roseburg-------393,545 Medford--------Coos Bay-------334.182 Oregon Tota1-- 1,687,380 77,150 124,941 1,713 3,116 284,448 59,373 21,],07,658 12,847,617 14,143,425 15,676,364 -18.326.035 $82,647,011 1,143 4,480 300,235 179,172 239,214 282,715 234.084 1,245,932 17,874 98,389 12,506,136 8,729,689 9,341,953 10,164,773 11.169.959 $52,188,789 Spokane--------2.595 Ore-Wash------ 1,689,975 45.006 $82,692,017 4.029 1,249,961 82.269 $52,271,058 () ,Y 321,800 951,500 102, JOO Management Resource Management-~~---------------- Lands & Minera1s-----~---------------- Cadastral Survey-----..:,--------------- District Volume M.bd. ft. $ 7 $ 86,862 73,154 I TIMBER HARVEST ACREAGES Acreages from· which the timber sold in fiscal years 1970 and 1971 will be harvested. FY 1970 District Clear-Cut Acres 222 13 6,202 4,194 7,192 2,827 '5,026 25,679 Spokane----------Ore-Wash Total-- 4 25,683 1,475 1,027 Clear-Cut Acres FY 1970 Partial-Cut Acres 33 6 3 4,732 3,078 6,774 2,256 356 422 5,662 2,498 5,496 24,238 ~ 2.m ~ ~ 68,058 i 20,595 I District I Lakeview------- I , .-ill 42,393 ~) '>:... ) ~) \ . I; : , TIMBER.STAND IMPROVEMENT (Precommercia1) District Lakeview-----~---- Acres Thinned , Acres Released From Brush 70 174 Burns------------ Vale------------- Prineville·------- Baker------------ Salem------------ Eugene----------- Roseburg--------- Medford---------- Coos Bay---------Oregon Total---- 328 290 1,317 678 Spokane---------- Ore-Wash Total-- 40 3,189 ) FY 1971 FY 1970 Acres Thinned 292 3,149 Vale----------- Prineville-----Baker---------- Salem----------Eugene---------Roseburg-------Medford--------Coos Bay-------- Oregon Total-- 829 Spokane-------- Ore-Wash Total 829 FY 1971 District Acres Released From Brush 175 280 100 235 520 4,388 852 96 182 6,828 1,952 439 Planting Seeding M Trees Acres Acres Pounds Seeds Planting & Seed ing Acres Burns--------~~- 41,763 39 20,634 Site Prepara- tion I 327 678 3,125 405 11,766 3,457 11,626 29,061 67,385 REFORESTATION Reforestation work in site preparation, planting, and seeding is tabulated here. Natural reforestation acreages are not included. FY 1971 Partial-Cut Acres 1 2 Lakeview---------Burns------------Vale------------- Prineville-------Baker------------Salem7-----------Eugen·e-----------Roseburg---------Medford----------Coos Bay---------Oregon Total----. _.j) -) I ,f.) :/") ':,\" 382 2,773 48 85 371 371 3,434 3,132 3,241 2,884 39 Site Preparation 26 ~ 15,868 -- 15,868 85 1,208 1,164 1,426 915 3,588 1,046 876 910 1,401 -1...§1l 6,140 10,293 2,368 866 666 918 3,151 7,969 7,022 4,178 4,117 3,794 6.965 26,161 6,140 10,293 7,969 26,161 Planting Seeding M Acres Trees Lakeview------- Burns---------- Vale----------- Prineville-----55 4 Baker----------691 2,706 Salem----------4,034 Eugene---------- 2,050 3,847 Roseburg-------- 1,368 699 Medford~-------2,707 Coos Bay-------- 1,605 ~ Oreg on Total-- 6,413 18,137 20 2 1,238 1,531 1,669 947 1.783 7,190 Spokane--------- ~ Ore-Wash Total 6,413 7,190 Acres Pounds Seeds 496 672 9 9 505 681 505 681 - 18,137 Planting & Seed ing Acres 55 4 2,706 4,530 3,847 2,716 ~ 18,642 - 18,642* *From 1958 through 1971, a total of 386,893 acres were reforested. 6,828 2,773 ) 8 9 NON-TIMBER FOREST PRODUCTS SALES '0'--.-" . .;..: <...... ~.~ FY 1970 Item and Unit Quantity FY Value ".. 1971 Quantity " .. LIVESTOCK GRAZING Grazing use is tabulated for calendar year 1970. Value Oregon: Christmas trees, each------ Wi1d1ings, each·----------- Cascara bark, pounds------- Moss, pounds--------------- Huckleberry brush, bunches- Ferns, bunches------------- Greens, bunches------------ Boughs, pounds------------- Cones, bushe1s------------- Pitch, ga11ons-------------Oregon Tota1-------------- 2,322 4,150 5,462 1,500 5,346 9,547 167 33,057 $2,309 215 69 30 202 219 5 661 295 19 $3,729 3,353 15 12,054 3,500 10,629 7,725 141,837 30 District $2,096 4 120 70 445 150 Lakeview Permits------------------- Leases-------~------------ If 5,437 15 II $8,337 Washington: $8,337 $3,729 Ore-Wash To.ta1------------ TIMBER TRESPASS .-' FY District Lakeview------Burns---------Va1e--------- Prineville----Baker---------Sa1em---------.Eugene--------Roseburg------Medford-------Coos Bay-----Oregon Tota1Spokane------Ore-Wash Total Burns Permits------------------- Leases-------------------Vale Permits------------------- Leases--------------------Prineville Permits------------------ Leases--------------------(~·~-)Baker . " . Permi ts------------------ Leases--------------------Salem ') EU~::es--------------------- 1970 Cases Closed Co11ecNo. tions FY 1971 Cases Pending 6-30-70 Cases C'losed Co11ections No. $ $ 3 1,500 3 4 4 20 6 10 18 16 81 5,000 6,982 33,005 9,662 7,464 4,745 13,285 $81,643 7 35 13 22 56 10 146 2 84 Cases Pending 6-30-71 ~ 2 148 $81,849 10 99 3 3 9,022 20 13 15 18 8 77 5,534 14,940 5,i68 11,866 6,864 $53,493 6 1 33 11 14 52 15 135 77 $53,493 Number Sheep & Goats Acres 39,820 3,500 1,110 1,000 3,328,753 55,436 53,951 30,000 7 ,340 6,300 3,324,757 178,640 67,904 24,505 4,691,017 15,677 7,100 2,000 1,106,333 322,854 15,904 19,591 7,182 6,660 368,530 33,597 141 25,007 267 25,297 Leases--------------------Roseburg Leases--------------------Medford Leases-------------------Coos Bay Leases--------------------Oregon Total--------------Spokane Leases-------------------~I Other Wash. Leases----- Ore-Wash Tota1------------- 8,473 3,305 278,353 2,500 1,036 48,508 10,125 1,700 419,935 95 266,575 58,833 1,384 13,930,048 5,680 238,072 8,021 14,176,141 I'D \ .'1/ Washington grazing lease lands administered by Baker District. Above figures do not include numbers authorized by Exchange of Use Agreement. --2 138 Number Cattle & Horses o ) Grazing use totals during calendar year 1969 were: Number Number Cattle & Sheep & Horses Goats Oregon---------------------- 306,258 Washington--------------- n,1l8 Ore-Wash Tota1----------- 317,376 68,621 ~ 74,900 Acres 13,926,224 253,985 14,180,209 FORAGE PROVIDED Numbers of livestock operators, permits and leases, and number of animal-unit-months of forage provided in calendar year 1970. District Number of Operators Number of Permits & Leases Animal Unit Months 169 329 269 438 274 8 11 57 151 2 1,708 169 342 269 447 274 8 11 57 134 2 1,713 148,968 250,969 407,152 94,945 53,651 540 920 3,637 24,644 505 985,931 427 26 2,166 35,883 1.000 1,022,814 ,J 'J) RESOURCE DEVELOPMENT AND CONSERVATION Major range conservation projects are tabulated here. Other accomplishments include preparation of watershed management plaris, soil stabilization, and water control. FY 1970 Brush Control Acres Grass Seeding Acres Fencing Miles Water Development Ntnnber 600 24,100 500 13,100 10,180 11,600 1,890 600 49 54 136 1 29 43 14 160 8 22 Roseburg------------ Medford------------- Coos Bay-------------, Oregon Tota1------- 25,200 -37,370 269 247 Spokane-------------Ore-Wash Total----- 25,200 -37,370 5 274 _2 249 Brush Control Acres Grass Seeding Acres Fencing Miles Water Development Number District Lakeview-------------Burns----------------Vale-----------------Prineville-----------Baker----------------Salem----------------Eugene---------------Roseburg-------------Medford--------------Coos Bay-------------Oregon-Total-------Spokane---I7--~------- Other Was~ ---------Ore-Wash Total-----~I 410 26 2,144 Lakeview------------Burns---------------Vale----------------Prineville---~------- Baker---------------Salem--------------- Washington grazing lease lands administered by Baker District Forage provided in calendar year 1969 totaled: Oregon--------------- 1,747 1,760 Washington------~---- ~ ~ Ore-Wash Total------ 2,237 2,208 'Eugene------------~- . (() 0) 0) 987,647 39.396 1,027,043 FY 1971 District Lakeview------------Burns--------------- Vale--------------Prineville---------- BIG GAME POPULATION ESTIMATES Baker---~-~---------- Big game animals which use lands managed by BLM.(197l) District Lakeview-------- Burns----------- Vale------------ Prineville------ Baker--------- Salem----------- Eugene-----~---- Roseburg-------- Medford--------- Coos Bay--------Oregon Total-- Spokane--------- Ore-Wash Total- Pronghorn Antelope Deer 61,000 50,000 30,000 17 ,000 16,000 24,000 10,000 23,000 33,000 15.000 10,250 279,000 ----2Q 8,000 10,300 287,000 2,500 3,600 3,200 900 50 12 Elk 150 100 50 1,500 300 100 900 150 2.500 5,750 Bighorn Sheep Salem--------------- Eugene-------------- Roseburg------------ Medford------------- Coos Bay------------ Oregon Total------- Mountain Goats 60 50 Ii Spokane------------- Ore-Wash Total------ 3,500 7 18 32 92 7 18 13,402 135 167 1.970 15,372 211 137 _2 169 2,880 3,010 11 4, 01 511 1,270=- 8 33 87 2,227~1 3,500 ~ 3,630 -- ~I Includes following acreages reseeded in emergency watershed rehabilitation projects on lands burned by wildfires: Medford--l,685; Baker--425; Prineville--lO; Total--2l20 acres. r;''l,\\ \JU 110 -12Q --.!!Q 5,900 150 150 150 )' .'~ 11 Includes 2 miles of protective fence built in emergency pro jects to protect lands burned by wildfire. RECREATION SITES RECREATION SITES (Continued) The following table applies to recreation sites constructed and operated as of 7-1-71 by the Bureau of Land Management. District. No. of Camping Units . Name of Si te Lakeview--- *Gerber Reservoir Burns------ Page Springs Fish Lake Jackman Park Blitzen Crossing Vale------- Cow Lakes Chukar Park Prineville- *Beavertail Chimney Rock *Macks Canyon Blue Hole Handicap Ramp Baker------ . Spring Salem------ Alder Glen Scaponia Elkhorn Valley *Fishermens Bend Yellowbottom N. Fork Eagle Creek Canyon Creek Dogwood Wildwood Little Bend Alsea Falls Mill Creek Missouri Bend Fan Creek Dovre Elk Bend Eugene----- Turner Creek Whit taker Creek *Clay Creek Sharps Creek Haight Creek Lake Creek South Jetty Roseburg--- Gunter Tyee *Rock Creek *Mill Pond Cavitt Creek Falls Scaredman Creek Lone Rock Wolf Creek Susan Creek Falls Emile Site 14 District Trailers Usable Picnic Units 50 15 20 x x 8 8 4 5 x x x 10 19 20 x x x x Cold Spring Ninemile Shady Branch Deer Creek Surveyor Topsy Little Applegate Elderberry Flat Gold Nugget Tunnel Ridge Hyatt Lake Rogue River Trail: Rainie Falls Big Slide Russian Creek Horseshoe Bend Kelsey Creek Tucker Flat Coos Bay--- Smith River Falls Sixes River *Loon Lake Park Creek BearCreek Vincent Creek Che rry Creek Palmer Butte Burnt Mountain 1 33 13 x 3 3 x 8 4 20 38 22 23 x x x x x 27 34 116 16 21 14 101 9 5 17 9 10 10 Name of Site Medford---- x x No. of .Camping Units x x Trailers Usable Picnic Units 2 1 2 16 x 10 x 17 10 10 x x 25 x 10 30 5 2 3 1 3 3 9 8 20 88 12 10 3 x x x x x 23 8 8 4 7 1 *BLM Annual Permit or daily fee for camping. 6 7 18 22 10 4 x x x x x 2 17 5 2 5 ESTIMATED RECREATION VISITS TO BLM LANDS FY 1971 Use 10 10 11 19 10 9 x x x x x 10 x 5 20 11 48 13 6 6 3 1 ')) ) Camp ing------------------------___ Picnicking------------------____ Fishing-----------------------___ _ Hun ting--------------------------Sightseeing-------------------___ _ Water Sports--------------------- Winter Sports-------------------__ Other-------------------------____ Total--------------------_______ 10 ,c: Oregon Washington 373,000 863,000 1,100,000 957,000 5,390,000 351,000 51,000 611,000 9,696,000 2,080 10,400 26,000 19,760 63,440 7,280 2,080 5,200 136,240 FIRE CONTROL Number burned Oregon Oregon , LAND LEASES ,~ , of man-caused and lightning-caused fires, with acres on lands managed by the Bureau of Land Management in and Washington. Fire control is by BLM in eastern and by contract in western Oregon and Washington. In effect 6-30-71. Oregon Occurrence of Fires CY 1970 District Number Lakeview----------------------- 'Burns-------------------------- Va1e---------------------------Prinevi11e---------------------Baker-------------------------- Sa1em-------------------------- Eugene------------------------- Roseburg----------------------- Medford------------------------ Coos Bay-----------------------, Oregon Tota1------------------ 331 Spokane------------------------Ore-Wash Tota1---------------- 337 Acres 510.58 121.17 21,476.02 883.77 725.25 22.75 37.47 210.35 2,488.58 3.60 26,479.54 75 24 37 81 4 15 10 31 51 3 No. Acres No. Recreation & Public Purposes-- Small Tract-------------------_ Ai rp or t-----------------------Mining Claim Occupancy Act---- Public Works Leases----------- Boy Scout Leases-------------- Communication Site Leases----- Mineral Lake Leases-----------~ Deer Fence Lease-------------- Special Land Use Permits------Tota1----------------________ 44 45 3 13 1 1 1 2,266 78 266 86 4 1 1 45 815 1 1 5 52 80 1 10.838 11,734 .22 163 41,663 44,365 Acres ; ' ) LAND CLASSIFIED FOR' MULTIPLE USE MANAGEMENT IN OREGON & WASHINGTON Acres 7,440.25 33,919.79 6 Washington Kind Classified under PL 88-607 of 9-19-64---------------- Classified under PL 75-405, O&C Act of 8-28-37-------Tota1-----------------------________________________ 13,356,381 2,145,900 15,502,281 Cause of Fires MINERALS CY 1970 District Man Oregon Lightning Item Lakeview---------------------~- 10 Burns------------------------- Va1e--------------------------Prinevi11e--------------------Baker------------------------- Sa1em------------------------- Eugene------------------------ Roseburg----------------------- 3 15 9 2 65 21 22 72 2 Medford----------------------~- 9 5 8 19 Coos Bay----------------------Oregon Tota1----------------- 81 23 32 2 250 Spokane-----------------------Ore-Wash Tota1--------------- 2 83 4 254 1 6 5 ) FY 1970 FY 1971 Mineral Patents Issued------- Coal Leases Issued, acres----~ Coal Leases in Force, .. ----- Oil & Gas Leases issued, acres 42,171 302,638 Oil & Gas Leases in force, " - 65,916 P.L.167 Determinations Completed, acres----------- 81,037 136,594 Cumulative Determinations, acres--------------------- 2,518,8542,655,448 Claims Retaining Surface Rights, number-----------101 101 acres------------2,020 2,020 Percent of Mineralized Area on which P.L.167 action is comp1eted--------------64 65 16 17 Washington FY 1970 FY 1971 14,706' 14,706 1 157,412 6 6 120 120 97 97 LAND PATENTS ISSUED FY 1970 FY 1971 Acres No. Acres 5 40 4 8 1 58 791 4,441 750 24,169 40 30,191 2 4 1 9 165 175 40 12,688 16 13,068 Oregon - Other Agency Reclamation Sale-------------National Forest Exchange-----Total - Other Agency-------- 2 2 4 253 ~ 1,215 12 12 Washington - BLM Public Sale------------------Total - BLM----------------- l. 750 750 2 2 No. Kind of Patent , ROAD RIGHT OF WAY PERMITS AND AGREEMENTS Right of way permits issued for logging and reciprocal right of way and road use agreements signed. 7 Lakeview--------------Burns----------------- Vale------------------ Prineville------------Baker----------------- Salem-------~--------- Eugene----'---------- Roseburg------------ Medford--------------- Coos Bay-------------- 4,650 4,650 11. 23 Washington - Other Agency National Forest Exchange-----Indian Fee and Reissue Trust-New Indian Trust------------- Total - Other Agen cy-------- 5 2,800_ 2 7 260 3,060 65 BLM------------ 30,941 3 157 160 18 6,017 12,068 Ore-Wash Total------- Agreements Signed Total to FY 1971 6-30 71 1 41 2 1 4 1 18 32 814 401 790 853 450 1 3,401 15 5 4 19 8 54 1 294 108 244 193 69 2 1 1 914 ROAD RIGHT OF WAY EASEMENTS AND DEEDS ACQUIRED () C> -); -) f! 18,085 13,091 District Lakeview--------------Burns--------------- Vale----------------Prineville------------Baker----------------- Salem----------------- Eugene----------------Roseburg------------ Medford---~----------- Coos Bay-------------- Spokane---------------Ore-Wash Total---- LANDS RECEIVED BY BLM FY 1970 Permits Issued Total to FY 1971 6-30-71 Spokane------~-------- ,. ' - . District Oregon - BLM Desert Land------------------Public Sale------------------Recreation Sale--------------Exchange---------------------/Mineral----------------------Total - BLM----------------- Ore-Wash Total , 'j) , FY 1971 FY 1971 Direct Eminent Purchase Domain 3 7 3 4 22 15 16 23 10 1 1 2 105 Total to 6-30-71 Direct Eminent Purchase Domain 51 129 26 66 85 433 318 472 738 325 1 3 1 38 22 50 61 13 ----.!Z. 2 '2,660 189 ROADS CONSTRUCTED Oregon Exchanges-------------------- Other (gift from Marion Co.)- 49,36 0 49,360 Total--------------------~- Washington Exchange-------------------Total----------------------- 560 560 Ore-Wash Total------------------ 49,920 39,369 32 39,401 I t District Lakeview--------------Burns----------------- Vale-----------------Prineville------------ Baker----------- Salem------------- 39,401 Eugene-~------------- - .-.:3 18 Miles built with appropriated funds Total to FY 1971 6-30-71 Roseburg------------ Medford------~-------- 15 Bay--------------Oregon Total--------- 15 ~oos 19 41 122 63 38 14 132 61 123 190 163 947 Miles built under timber sale contracts Total to FY 1971 6-30-71 4 46 136 7 3 10 43 91 252 58 468 146 76 523 978 1,125 2,050 831 5,911 ROADS MAINTAINED The Bureau of Land Management performed maintenance on 3,400 miles of permanent roads in Oregon and Washington during FY 1971. RIGHTS OF WAY Right of way permits issued by the Oregon State Office during the past two fiscal years. (Does not include permits for logging roads in western Oregon.) Oregon Kind FY 1970 Electric Transmission Lines-----------------Te],ephone, Telegraph Lines-----------------Communication Sit~s-----Water Pipelines, Ditches, Etc.------------------Oil & Gas pipelines-----Roads, Material Sites---Total------------------ Washington FY 1971 FY 1970 16 12 4 6 3 4 4 4 2 1 3 5 1 8 37 8 'I" FY 1971 I L 1 -.l. 35 2 1 7 13 PUBLIC LAND SURVEYS FY 1970 Oregon Kind Line Resurveyed, miles-- Corners remonumented-----' Sections subdivided----- Books of Field Notes---- Plats accepted----------- 90 69 15 38 35 FY 1971 Washington 5 165 3 4 Oregon 283 436 14 51 23 Washington 4 266 10 4 '[) ',:: "J> r#Pn~ =V sys: This Land is YOUR Land KEEP IT CLEAN! I 0 ) A6 the Nctt).o n'[) pJL.i.ncipaJ. cOn[) Vtvctt.i..on ag enclJ, the VepaJLtment 06 the Intvu.oIL hM bM.ic ILU,tJOn[).i b~u 60IL untVt, land, m.inVtaJ., 6.wh, w.ildU6e, 60ILUt, ILange, and ILecJteationai" ILUOWtcU. IncUa.n and T~oJt.iaJ. a660vi.JL6 aILe othVt majoIL COncVtM 06 Amvu.ca' [) "VepaJz.;tment 06 Natl1.Jl.ai RuouILcu." The VeptV!;tment WOIL~ to M[)UJte the w.u..ut cho.ice .in manag.<.ng ctU. ILUOUJtcU [)O each will. make -i.;t6 6ull con.tJr.i.but..ion to a bettVt Un.ited Statu -- now and .in the 6u.twr.e. U. So DEPARTMENT Of 1HE NTERIOR aullAU OF LAND MANAGIMINT
© Copyright 2026 Paperzz