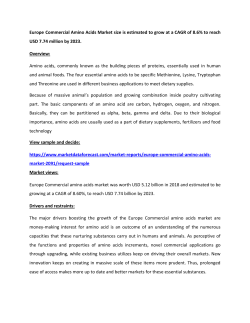
Glutamic Acid, the Main Dietary Amino Acid, and Blood Pressure The INTERMAP Study (International Collaborative Study of Macronutrients, Micronutrients and Blood Pressure) Jeremiah Stamler, MD*; Ian J. Brown, PhD*; Martha L. Daviglus, MD, PhD; Queenie Chan, MPhil; Hugo Kesteloot, MD, PhD; Hirotsugu Ueshima, MD, PhD; Liancheng Zhao, MD; Paul Elliott, MB, PhD; for the INTERMAP Research Group Downloaded from http://circ.ahajournals.org/ by guest on June 18, 2017 Background—Data are available that indicate an independent inverse relationship of dietary vegetable protein to the blood pressure (BP) of individuals. Here, we assess whether BP is associated with glutamic acid intake (the predominant dietary amino acid, especially in vegetable protein) and with each of 4 other amino acids that are relatively higher in vegetable than animal protein (proline, phenylalanine, serine, and cystine). Methods and Results—This was a cross-sectional epidemiological study with 4680 persons 40 to 59 years of age from 17 random population samples in China, Japan, the United Kingdom, and the United States. BP was measured 8 times at 4 visits; dietary data (83 nutrients, 18 amino acids) were obtained from 4 standardized, multipass, 24-hour dietary recalls and 2 timed 24-hour urine collections. Dietary glutamic acid (percentage of total protein intake) was inversely related to BP. Across multivariate regression models (model 1, which controlled for age, gender, and sample, through model 5, which controlled for 16 possible nonnutrient and nutrient confounders), estimated average BP differences associated with a glutamic acid intake that was higher by 4.72% of total dietary protein (2 SD) were ⫺1.5 to ⫺3.0 mm Hg systolic and ⫺1.0 to ⫺1.6 mm Hg diastolic (z scores ⫺2.15 to ⫺5.11). Results were similar for the glutamic acid–BP relationship with each of the other amino acids also in the model; eg, with control for 15 variables plus proline, systolic/diastolic pressure differences were ⫺2.7/⫺2.0 mm Hg (z scores ⫺2.51, ⫺2.82). In these 2–amino acid models, higher intake (by 2 SD) of each of the other amino acids was associated with small BP differences and z scores. Conclusions—Dietary glutamic acid may have independent BP-lowering effects, which may contribute to the inverse relation of vegetable protein to BP. (Circulation. 2009;120:221-228.) Key Words: amino acids 䡲 glutamic acid 䡲 blood pressure 䡲 nutrition 䡲 epidemiology T he population-based International Collaborative Study of Macronutrients, Micronutrients and Blood Pressure (INTERMAP) found a significant inverse relation of vegetable protein intake to blood pressure (BP) for individuals.1 Among those who consumed predominantly vegetable protein compared with animal protein, intake of glutamic acid, the most common dietary amino acid, made up a higher percentage of total protein, as did (to a lesser degree) cystine, proline, phenylalanine, and serine. We therefore hypothesized that the higher the intake of these 5 amino acids, and in particular, glutamic acid, the lower the BP. Results are presented here. Clinical Perspective on p 228 Methods Basic Premises, Population Samples, and Field Methods (1996 –1999) Basic INTERMAP premises are as follows: Multiple nutrients have small, independent influences on BP that in combination summate as Received November 27, 2008; accepted May 15, 2009. From the Department of Preventive Medicine (J.S., M.L.D.), Feinberg School of Medicine, Northwestern University, Chicago, Ill; Department of Epidemiology and Public Health (I.J.B., Q.C., P.E.), Faculty of Medicine, St Mary’s Campus, Imperial College London, United Kingdom; Central Laboratory (H.K.), Akademisch Ziekenhuis St. Rafael, Leuven, Belgium; Department of Health Science (H.U.), Shiga University of Medical Science, Otsu, Japan; and Department of Epidemiology (L.Z.), Fu Wai Hospital and Cardiovascular Institute, Chinese Academy of Medical Sciences, Beijing, People’s Republic of China. *Drs Stamler and Brown contributed equally to this work. The online-only Data Supplement is available with this article at http://circ.ahajournals.org/cgi/content/full/CIRCULATIONAHA.108.839241/DC1. Correspondence to Jeremiah Stamler, MD, Department of Preventive Medicine, Feinberg School of Medicine, Northwestern University, 680 N Lake Shore Dr, Suite 1102, Chicago, IL 60611. E-mail [email protected] © 2009 American Heart Association, Inc. Circulation is available at http://circ.ahajournals.org DOI: 10.1161/CIRCULATIONAHA.108.839241 221 222 Circulation July 21, 2009 Table 1. Estimated Mean Difference in BP With Consumption of Foods Higher by 2 SD in Glutamic Acid (as % Total Protein): Multiple Regression Analyses Model SBP Difference, mm Hg (z Score) DBP Difference, mm Hg (z Score) Main analyses: All 4680 participants Table 1. Continued SBP Difference, mm Hg (z Score) DBP Difference, mm Hg (z Score) 4 ⫺1.20 (⫺2.20) ⫺0.76* (⫺1.88) 5b-Mg ⫺1.65 (⫺2.86) ⫺1.17 (⫺2.75) Model Nonhypertensive persons (n⫽3671) 1 ⫺3.03* (⫺5.11) ⫺1.44 (⫺3.67) 2 ⫺2.78* (⫺4.73) ⫺1.39 (⫺3.58) 3 ⫺2.08* (⫺3.51) ⫺1.02 (⫺2.60) 4 ⫺1.94 (⫺2.95) ⫺1.19 (⫺2.73) 5a-P ⫺2.43 (⫺3.59) ⫺1.48 (⫺3.28) 4 ⫺2.45 (⫺3.06) ⫺1.28 (⫺2.42) ⫺1.63 (⫺3.57) 5b-Mg ⫺2.83 (⫺3.43) ⫺1.65 (⫺2.99) 4⫹Total energy (kJ/d) ⫺1.62 (⫺1.96) ⫺1.05 (⫺1.86) 5b-Mg⫹total energy (kJ/d) ⫺0.18 (⫺0.19) ⫺0.45 (⫺0.74) 4⫹Total energy⫹height⫹ weight ⫺1.87 (⫺2.36) ⫺1.21 (⫺2.23) 5b-Mg⫹total energy⫹ height⫹weight ⫺1.48 (⫺1.70) ⫺1.24 (⫺2.10) 5b-Mg ⫺2.50 (⫺3.66) 5c-Ca ⫺1.48 (⫺2.21) ⫺0.96 (⫺2.15) 5d-Fe ⫺1.81 (⫺2.73) ⫺1.15 (⫺2.59) 5e-Fiber ⫺1.95 (⫺2.93) ⫺1.21 (⫺2.72) Sensitivity analyses Downloaded from http://circ.ahajournals.org/ by guest on June 18, 2017 Also adjusted for education (years) and current smoking (yes/no; n⫽4680) Excluding persons with high day-to-day variability in nutrient intake and/or BP (n⫽3473) Glutamic acid expressed as g/d (instead of % total protein; n⫽4680) 4 ⫺1.88 (⫺2.86) ⫺1.23 (⫺2.81) 5b-Mg ⫺2.46 (⫺3.59) ⫺1.68 (⫺3.67) 4 ⫺1.95 (⫺2.96) ⫺1.21 (⫺2.77) 4 ⫺1.06 (⫺2.33) ⫺0.66 (⫺2.15) 5b-Mg ⫺2.52 (⫺3.67) ⫺1.64 (⫺3.56) 5b-Mg ⫺0.22 (⫺0.44) ⫺0.35 (⫺1.02) 4⫹Height⫹weight ⫺1.08 (⫺2.48) ⫺0.66 (⫺2.22) 5b-Mg⫹height⫹weight ⫺0.86 (⫺1.76) ⫺0.72 (⫺2.17) Also adjusted for month of field survey (n⫽4680) Also adjusted for season of field survey (n⫽4680) 4 ⫺1.93 (⫺2.93) ⫺1.19 (⫺2.74) 5b-Mg ⫺2.49 (⫺3.64) ⫺1.63 (⫺3.56) 4 ⫺1.96 (⫺2.98) ⫺1.19 (⫺2.72) 5b-Mg ⫺2.53 (⫺3.70) ⫺1.64 (⫺3.58) 4 ⫺1.99 (⫺3.05) ⫺1.20 (⫺2.76) 5b-Mg ⫺2.54 (⫺3.72) ⫺1.60 (⫺3.49) 4 ⫺1.74 (⫺2.56) ⫺1.19* (⫺2.64) 5b-Mg ⫺2.07 (⫺2.91) ⫺1.57 (⫺3.30) 4 ⫺1.50 (⫺2.12) ⫺0.81 (⫺1.73) 5b-Mg ⫺2.27 (⫺3.07) ⫺1.35 (⫺2.71) Also adjusted for total energy (kJ/d; n⫽4680) Adjusted for urinary Na/creatinine and K/creatinine ratio (mmol/ mmol) instead of urinary Na and urinary K (mmol/24 h; n⫽4680) Also adjusted for total available carbohydrate (% kJ; n⫽4680) Also adjusted for starch (% kJ; n⫽4680) Censored normal regression to adjust for antihypertensive treatment (n⫽4680) 4 ⫺2.29 (⫺3.10) ⫺1.40 (⫺2.89) 5b-Mg ⫺2.82 (⫺3.66) ⫺1.81 (⫺3.55) (Continued) Glutamic acid expressed as % kJ (instead of % total protein; n⫽4680) Model 1: Controlled for sample, age, and gender. Model 2: Model 1 variables plus special diet (yes/no), supplement intake (yes/no), diagnosis of cardiovascular disease/diabetes mellitus (yes/no), physical activity (medium and heavy, hours per day), family history of high BP (yes, no, or unknown). Model 3: Model 2 variables plus urinary Na and urinary K (mmol/24 h), 14-day alcohol consumption (g/d). Model 4: Model 3 variables plus cholesterol (mg/1000 kJ), total saturated fatty acids, and total polyunsaturated fatty acids (% kJ). Models 5a through 5e, main analyses: Controlled for model 4 variables plus each stipulated nutrient (expressed per 1000 kJ). Sensitivity analyses: Controlled for model 4 variables plus each stipulated variable, or variables in model 5b-Mg plus each stipulated variable. Month of field survey represents the midpoint between first and fourth clinic visit; season of field survey is Winter (December/January/February), Spring (March/April/May), Summer (June/July/August), or Fall (September/October/ November). z Score⫽regression coefficient/standard error; z score ⱖ1.96: uncorrected Pⱕ0.05; z score ⱖ2.58: uncorrected Pⱕ0.01; and z score ⱖ3.29: uncorrected Pⱕ0.001. 2-SD higher glutamic acid intake for % total protein, 4.72%; for grams per day, 9.60; for % total kilocalories, 1.00%. *Test for cross-country heterogeneity significant, P⬍0.05. sizable (clinically relevant) effects. To detect the impact of single nutrients on the BP of individuals, standardized high-quality data are needed on large population samples. Accordingly, INTERMAP surveyed 4680 men and women 40 to 59 years of age from 17 random population samples in Japan (4 samples), the People’s Republic of China (3 samples), the United Kingdom (2 samples), and the United States (8 samples).2 Participants were selected randomly from community or workplace population lists, arrayed into 4 age/gender strata. Staff were trained and certified by senior col- Stamler et al Downloaded from http://circ.ahajournals.org/ by guest on June 18, 2017 leagues based on a common protocol. Each participant attended 4 times, with visits 1 and 2 on consecutive days and visits 3 and 4 on consecutive days an average of 3 weeks later. BP was measured twice per visit with a random-zero sphygmomanometer and averaged. Measurements of height and weight and data on daily alcohol consumption over the previous 7 days were obtained at 2 visits. Dietary data were collected at each visit by multipass 24-hour recall.2,3 All foods, drinks, and supplements consumed in the previous 24 hours were recorded. For participants from the People’s Republic of China and the United States, monosodium glutamate (66% and 46% glutamic acid, respectively) was quantitated4; for Japan and UK participants, monosodium glutamate use was negligible and was not quantitated. Questionnaire data were obtained on demographic, biomedical, and other possible confounders. Each participant provided two 24-hour urine collections, start- and endtimed at the research center (visits 1 to 2 and visits 3 to 4); measurements included urinary volume, sodium, potassium, creatinine, and urea nitrogen, a biomarker of total protein intake.3,5 Eight percent of the specimens were split locally and sent in a blinded fashion to the central laboratory to estimate technical error.2 Individuals were excluded if they did not attend all 4 visits; if diet data were considered unreliable; if energy intake from any 24-hour dietary recall was ⬍2092 or ⬎20 920 kJ/d for women or 33 472 kJ/d for men; if 2 urine collections were not available; or if other data were incomplete or indicated protocol violation (total⫽215 people). For each exclusion, an alternative participant was recruited. The study received institutional ethics committee approval for each site, and all participants gave written informed consent. Statistical Methods Food data for individuals were converted into nutrients (83 nutrients, including 18 amino acids) with the use of country-specific tables on the nutrient composition of foods, updated and standardized across countries by the Nutrition Coordinating Center, University of Minnesota.2,6 For nutrients that supplied energy, intake was calculated as percentage of total energy; for other nutrients, intake was calculated as intake per 1000 kJ and as amount per 24 hours. For amino acids, intake was also calculated as a percentage of total protein intake. Main food groups supplying each amino acid were assessed. Urinary values per 24 hours were calculated as products of urinary concentrations and volumes, were standardized to 24 hours. Measurements per person were averaged, for BP and nutrients, across the 4 visits; for urinary excretions, they were averaged across the 2 collections. For descriptive statistics, means and SDs or numbers and percentages were calculated by country and studywide. The reliability of BP and amino acid intakes (mean of 4 visits) was estimated from the formula 1/[1⫹(ratio/4)]⫻100, where the ratio was intraindividual variance/interindividual variance, estimated separately for 8 gender/ country strata and pooled by weighting each stratum-specific estimate by (sample size⫺1). This gives a first approximation of the effect of random error due to day-to-day variability on the reliability of amino acid associations with BP; the statistic is the estimated size of an observed coefficient as a percentage of the theoretical coefficient in univariate regression analysis.7–10 Associations among nutrients were explored by partial correlation, adjusted for sample, age, and gender; pooled across countries; and weighted by sample size. Multiple regression analyses were used to examine relations of each of the 5 dietary amino acids (grams per day, percentage of kilojoules, and percentage of total protein) to systolic BP (SBP) and diastolic BP (DBP). Adjustment for confounders was done sequentially with the use of 9 models (3 to 15 covariates; Table 1), with and without height and weight.1,2 Regression models were fit by country, and coefficients were pooled across countries, weighted by the inverse of the variance, to estimate the overall association. The cross-country heterogeneity of regression coefficients was tested by 2 analysis. Interactions were assessed for age and gender, and departures from linearity were tested with quadratic terms. Regression coefficients were expressed as mm Hg for a 2-SD difference in amino acid intake from overall SDs adjusted for across-country variation. Statistical significance is presented as Dietary Glutamic Acid and Blood Pressure 223 the z score (z score⫽regression coefficient/standard error); equivalent probability values are given in the Table footnotes. Sensitivity analyses were also done (Table 1; online-only Data Supplement Tables VI, VII, and VIII) that included censored normal regression to adjust for potential antihypertensive treatment bias.11 Adjusted mean SBP and DBP by country-specific quartiles of glutamic acid (% total protein) were calculated by ANOVA and plotted. Analyses were performed (by I.J.B. and Q.C.) with SAS version 9.1 (SAS Institute, Inc, Cary, NC). The authors had full access to and take full responsibility for the integrity of the data. All authors have read and agree to the manuscript as written. Results Descriptive Statistics Multiple characteristics of the study population samples are provided in online-only Data Supplement Table I. Mean SBP ranged from 117.2 mm Hg (Japan) to 121.3 mm Hg (People’s Republic of China), and mean DBP ranged from 73.2 mm Hg (People’s Republic of China) to 77.3 mm Hg (United Kingdom). Consistently, glutamic acid was the predominant dietary amino acid, averaging 15.7 g/d, 3.0% kJ, and 20.1% total protein for all 4680 INTERMAP participants. As grams per day and percent kilojoules, these values were higher for persons from the United Kingdom and the United States than for those from Japan or the People’s Republic of China; as a percentage of total protein, glutamic acid intake was highest for People’s Republic of China participants (24.1%) and lowest for Japanese (17.8%; for the United Kingdom and the United States, the respective values were 20.5% and 19.8%). Only 2% of women and men reported use of dietary supplements containing glutamic acid; intake from supplements and from foods plus supplements among supplement users averaged 0.5 and 16.4 g/d, respectively. Univariate estimates of the reliability of glutamic acid intake, based on mean values from the four 24-hour recalls per participant, were as follows: 68% of theoretical coefficient (g/d), 61% (% kJ), and 61% (% total protein; onlineonly Data Supplement Table II). These were similar for men and women, across the 4 countries, and for the 4 other amino acids. BP reliability estimates were 94% (SBP) and 93% (DBP) and were high across all 8 gender/country subgroups. Partial Correlations Expressed as grams per day or percentage of kilojoules, partial correlations (adjusted for sample, age, and gender) for glutamic acid with proline, phenylalanine, serine, and cystine were of a high order (0.83 to 0.90; online-only Data Supplement Tables III and IV) and were smaller for amino acids expressed as a percentage of total dietary protein (0.37 to 0.47, except for the correlation of glutamic acid with proline [0.80]; online-only Data Supplement Table V). Glutamic acid expressed as grams per day and as percentage of kilojoules was positively correlated with dietary calcium, copper, iron, magnesium, phosphorus, and selenium (partial r from 0.21 for copper to 0.62 for phosphorus; online-only Data Supplement Tables III and IV); with glutamic acid expressed as a percentage of total protein, partial r values with these micronutrients (expressed as caloric density) were small, ranging from 0.09 (calcium) to ⫺0.10 (magnesium and selenium), 224 Circulation July 21, 2009 except for phosphorus (⫺0.18; online-only Data Supplement Table V). Glutamic acid as a percentage of total protein was positively correlated with total carbohydrate (0.33) and starch (0.39) and inversely correlated with alcohol (⫺0.17 to ⫺0.19). Partial correlation (r) data were similar for the 4 other amino acids. Multiple Regression Analyses: Glutamic Acid and BP Downloaded from http://circ.ahajournals.org/ by guest on June 18, 2017 The glutamic acid–BP relation was stronger when expressed as a percentage of total protein than as grams per day or as a percentage of kilojoules. With glutamic acid intake (percentage of total protein) from food higher by 2 SD (4.72% total protein), in multivariate controlled models (models 4 to 5e in Table 1), average SBP was lower by 1.5 to 2.5 mm Hg (z score ⫺2.21 to ⫺3.66), and average DBP was lower by 1.0 to 1.6 mm Hg (z score ⫺2.15 to ⫺3.57). Results were qualitatively similar, with smaller BP differences, in corresponding analyses that included height and weight; for example, in model 5b-Mg, SBP was lower by 1.8 mm Hg (z score ⫺2.73) and DBP by 1.2 mm Hg (z score ⫺2.70; data not tabulated). Compared with model 4 findings, coefficients in models that also adjusted for phosphorus or magnesium (models 5a-P and 5b-Mg) were larger for both SBP and DBP; results for those that adjusted for iron or fiber (models 5d-Fe and 5e-fiber) were similar to model 4; and results for the model that adjusted for calcium (model 5c-Ca) were lower, particularly for SBP. With adjustment for vegetable protein, associations of glutamic acid and BP remained qualitatively similar, and BP differences and z scores were quantitatively weaker (data not tabulated). Sensitivity analyses yielded results similar to the foregoing, including for nonhypertensive persons and after adjustment for antihypertensive treatment, seasonality, and additional sociodemographic characteristics (smoking and education; Table 1). BP differences and z scores were largest with the exclusion of persons with high day-to-day variability in nutrient intake or BP. Tests for age/gender interaction and quadratic nonlinearity consistently yielded nonsignificant results; most cross-country heterogeneity tests were nonsignificant. Despite the lack of significant interaction terms, the inverse relationship of glutamic acid to SBP was stronger for women than for men; also, in models 4 and 5a through 5e, it was stronger in those 50 to 59 years of age than in those 40 to 49 years old (online-only Data Supplement Tables X and XI). All analyses yielded almost identical results with the independent variable of glutamic acid from foods plus supplements (data not tabulated). The Figure demonstrates successively lower mean SBP and DBP across quartiles 1 to 4 of country-specific glutamic acid intake, controlled for model 5b-Mg covariates (P for trend ⬍0.001 for SBP, 0.12 for DBP). Proline, phenylalanine, and serine (but not cystine) were related to BP in a qualitatively similar way, with smaller BP differences and z scores (online-only Data Supplement Tables VI, VII, and VIII). In multivariate models that included glutamic acid and 1 of the other 4 amino acids (2 SD higher as a percentage of total protein), glutamic acid intake was Figure. Mean SBP (A) and DBP (B) by country-specific quartiles of glutamic acid intake (% total protein), adjusted for model 5b-Mg covariates, for all 4680 participants. Whiskers are 99% CIs. A, P for trend ⬍0.001; B, P for trend⫽0.12. Countryspecific quartile cutoffs for glutamic acid intake (% total protein) were as follows: for Japan, 16.8 (25th percentile), 17.6 (50th percentile), and 18.6 (75th percentile); for People’s Republic of China, 19.4, 25.1, and 27.4; for the United Kingdom, 19.4, 20.3, and 21.5; and for the United States, 18.6, 19.7, and 20.9. Model 5b-Mg covariates were estimated by ANOVA, overall (coefficients not pooled by country). Adjusted for country (not sample), age, gender, special diet, supplement intake, diagnosis of cardiovascular disease/diabetes mellitus, physical activity, family history of high BP, urinary sodium, urinary potassium, 14-day alcohol consumption, cholesterol, total saturated fatty acids, total polyunsaturated fatty acids, and magnesium (see Table 1 footnote for units). associated with 2.0 to 2.9 mm Hg lower SBP and 1.2 to 2.0 mm Hg lower DBP (z score ⫺2.32 to ⫺3.63; Table 2); For each of the other amino acids in these analyses, BP differences and z scores were of low order. With height and weight included in these regressions, BP differences and z scores for the glutamic acid–BP relation were ⫺1.4 to ⫺2.2 mm Hg for SBP and ⫺0.8 to ⫺1.7 mm Hg for DBP, z score ⫺1.65 to ⫺2.44 (data not tabulated). Sensitivity analyses for these 2-amino acid assessments yielded findings generally similar to those in Table 2 (online-only Data Supplement Table IX). The relation was generally less strong with amino acids expressed as grams per day or percentage of kilojoules. Results were nonsignificant for tests of age/gender interaction and quadratic nonlinearity with these 2-amino acid models, as were most tests for cross-country Stamler et al Table 2. Estimated Mean Difference in BP With Consumption of Foods Higher by 2 SD in Amino Acids (% Total Protein), 2 Amino Acids in Same Model, Model 5b-Mg, All Participants (nⴝ4680) Variable (2 SD) SBP Difference, mm Hg (z Score) DBP Difference, mm Hg (z Score) Glutamic acid (4.72) ⫺2.72 (⫺2.51) ⫺2.00 (⫺2.82) Proline (2.54) 0.30 (0.26) 0.55* (0.72) Glutamic acid (4.72) ⫺1.99 (⫺2.48) ⫺1.24 (⫺2.32) ⫺0.72 (⫺1.32) ⫺0.63 (⫺1.71) ⫺2.27 (⫺2.84) ⫺1.37 (⫺2.58) ⫺0.51 (⫺0.96) ⫺0.40 (⫺1.12) Phenylalanine (0.35) Glutamic acid (4.72) Serine (0.45) Glutamic acid (4.72) ⫺2.88 (⫺3.63) ⫺1.56 (⫺2.95) Cystine (0.27) 0.57 (1.00) ⫺0.09* (⫺0.25) Downloaded from http://circ.ahajournals.org/ by guest on June 18, 2017 Model 5b-Mg: Controlled for sample, age, gender, special diet, supplement intake, diagnosis of cardiovascular disease/diabetes mellitus, physical activity, family history of high BP, urinary Na, urinary K, 14-day alcohol consumption, cholesterol, total saturated fatty acids, total polyunsaturated fatty acids, and magnesium (see Table 1 footnote for units). z Score⫽regression coefficient/standard error; z score ⱖ1.96: uncorrected Pⱕ0.05; z score ⱖ2.58: uncorrected Pⱕ0.01; and z score ⱖ3.29: uncorrected Pⱕ0.001. *Cross-country heterogeneity significant, P⬍0.05. heterogeneity for the glutamic acid–BP relation (data not tabulated). Food Sources of Glutamic Acid Seven food groups (4 vegetable, Table 3, rows 2–5; 3 animal, Table 3, rows 9 –11) supplied most (83.6%; vegetable 41.9%, animal 41.7%) of the glutamic acid. Discussion Our main finding was a consistent inverse relation of glutamic acid intake (as a percentage of total protein) to BP that Table 3. Dietary Glutamic Acid and Blood Pressure 225 prevailed in repeated regression models with control for multiple confounders, both nondietary and dietary (including variables previously demonstrated to relate significantly and independently to BP [eg, sodium, potassium, alcohol intake, and weight adjusted for height]);12 also with control for intake of each of the 4 other amino acids that are more common in vegetable than animal protein. This relationship prevailed for women and men; for those ages 40 to 49 and 50 to 59 years; across 4 countries; for nonhypertensive persons; and with control for month or season of dietary survey and for sociodemographic characteristics. It was strongest with the exclusion of individuals who manifested marked intraindividual variability in nutrient intake or BP, results that are concordant with the tentative inference that dietary glutamic acid may have an etiologically significant favorable effect on BP. This novel finding needs replication in other populations and in trials. Of 18 dietary amino acids quantified in the present study, glutamic acid intake was consistently and by far the most common. For predominantly vegetable versus predominantly animal protein consumers, glutamic acid constituted 23% versus 18% of total protein intake. Thus, given the previous INTERMAP finding of an independent inverse relation of vegetable protein intake to BP,1 it was an expected result that this most common amino acid (especially in vegetable protein) would be inversely related to BP. To the best of our knowledge, this is the first report of the relation of glutamic acid (or proline, phenylalanine, serine, or cystine) intake to BP. Previous literature reporting lower BP in vegetarian than omnivorous populations did not deal with specific nutrients,13 and more recent reports (from observational studies or controlled trials) did not report on glutamic acid or the other 4 amino acids predominant in vegetable protein.1 In the 2 DASH (Dietary Approaches to Stop Hypertension) trials and the OMNIHEART (Optimal Macro- Food Groups Supplying the Most Dietary Glutamic Acid, by Country Japan (n⫽1145) Food Group PRC (n⫽839) UK (n⫽501) USA (n⫽2195) All (n⫽4680) g/d % g/d % g/d % g/d % g/d % 14.19 100.0 14.97 100.0 16.83 100.0 16.54 100.0 15.72 100.0 Pasta, rice, noodles* 3.03 21.3 3.01 20.2 0.31 1.8 0.85 5.1 1.71 10.9 Bread, rolls, biscuits* 1.06 7.5 0.15 1.0 4.19 24.9 2.22 13.4 1.77 11.3 Vegetables, beans 0.96 6.8 1.47 9.8 1.21 7.2 1.10 6.6 1.14 7.3 Grains, flour, cereals 0.13 0.9 6.30 42.1 0.66 3.9 1.50 9.0 1.94 12.4 Vegetarian meat substitutes 1.07 7.5 0.33 2.2 0.04 0.2 0.11 0.6 0.37 2.4 All Cakes, puddings, cookies, sweet snacks* 0.37 2.6 0.99 6.6 1.07 6.4 0.39 2.4 0.56 3.6 Nuts, seeds 0.12 0.8 0.27 1.8 0.13 0.8 0.33 2.0 0.25 1.6 Fish, shellfish 3.20 22.6 0.36 2.4 0.64 3.8 0.69 4.2 1.24 7.9 Meat 1.91 13.5 1.25 8.4 4.59 27.3 5.09 30.8 3.57 22.7 Milk, cheese, dairy† 0.87 6.2 0.03 0.2 2.76 16.4 2.63 15.9 1.75 11.1 Eggs 0.61 4.3 0.31 2.1 0.24 1.4 0.43 2.6 0.44 2.8 Sum–vegetable (rows 2–8) 6.73 47.4 11.53 77.1 7.60 45.2 6.48 39.2 7.76 49.4 Sum–animal (rows 9–12) 6.60 46.5 1.95 13.0 8.22 48.9 8.85 53.5 6.99 44.5 PRC indicates People’s Republic of China; UK, United Kingdom; and USA, United States of America. *May include small quantities of glutamic acid of animal origin (eg, from egg white). †Does not include ice cream. 226 Circulation July 21, 2009 Downloaded from http://circ.ahajournals.org/ by guest on June 18, 2017 nutrient Intake Trial for Heart Health) feeding trials, dietary protein, particularly vegetable protein, was increased, and hence, so was glutamic acid,14 –16 but this modification was for protein overall, so that no inference is possible as to whether the individual nutrient glutamic acid produced BP reduction with the DASH/OMNIHEART eating pattern. Correspondingly, there are no data on total glutamic acid intake and BP in the 39 papers from a recent international symposium on glutamate.17 The only related information is from small (11 to 52 persons), short-term, randomized, controlled trials dealing with monosodium glutamate,18 –22 with an amount ranging from a 1.5-g tablet given with breakfast to 12 g given after an overnight fast, without effects on BP. In 3 East Asian studies,23–25 inverse relations were reported with regard to SBP for the urinary ratio of sulfate to urea (an index of intake of sulfur-containing amino acids from animal protein) and of serum phenylalanine and serine; overnight urinary cysteine; and 24-hour urinary 3-methylhistidine (a marker for animal protein intake). These articles reported no dietary-BP relationship data on the 5 amino acids considered in the present report. Glutamate has been characterized as “an amino acid of particular distinction . . . an abundant biomolecule [with] involvement in multiple metabolic processes that play major roles . . . .”26 Therefore, multiple mechanisms can be invoked as possibly accounting for a favorable effect of dietary glutamic acid on BP; for example, oxidized in the intestinal tissues, glutamic acid may serve as an energy-yielding or glutathione substrate.26 Glutathione in its redox state can counteract oxidative injury from free radicals27 and can enhance the hypotensive effects of nitric oxide.28 Dietary glutamate may also be a substrate for arginine,29 a precursor of nitric oxide and a potent vasodilator.30 Glutamate is an excitatory neurotransmitter; areas of the brain most sensitive to increased plasma glutamate (potentially from dietary intake) are those that are relatively unprotected by the bloodbrain barrier, notably the hypothalamus, linking the nervous system to the endocrine system via the pituitary gland.26,31 Glutamate excitation of hypothalamus neurons could affect vasoactive hormone production, although findings in human studies to date are negative.32 Another possible pathway for a favorable BP influence of higher glutamate intake is enhanced kidney size and function.33–35 The inverse relation between dietary glutamic acid and BP is 1 of several independent associations of nutrients with BP found by the INTERMAP study (as expected).1,36 –39 The relation between glutamic acid and BP is stronger with glutamic acid expressed as a percentage of total protein than when it is expressed as grams per day or as a percentage of kilojoules. This may be because glutamic acid expressed as a percentage of total protein correlates much less strongly with other possibly confounding variables than glutamic acid expressed as grams per day or as a percentage of kilojoules. Compared with model 4, glutamic acid–BP associations were larger in models that also adjusted for phosphorus or magnesium, similar in models that adjusted for iron or fiber, and smaller in models that adjusted for calcium. This may reflect the different sign of the correlation between these variables and glutamic acid, but all partial r values are of low order, and hence, any inference is conjectural. Another possibility is chance variation. For all models, the glutamic acid–BP relationship remains qualitatively the same, ie, inverse, with all z scores ⬎2. Bias toward the null of exposure-BP associations induced by reduced BPs of treated hypertensive participants is a concern for all studies that include such individuals.11 Glutamic acid–BP associations were quantitatively similar in models that adjusted for antihypertensive treatment effect compared with main analyses, which indicates that bias of this kind is not substantial. Limitations of our findings in the present study include the following: Their cross-sectional nature (although they are the only population-based data available); effect-size underestimation due to limited reliability in nutrient measurement (regression-dilution bias), despite multiple standardized stateof-the-art measurements; ability to control only partially (albeit considerably) for high-order collinearity among dietary variables of concern, which is less of a problem in analyses with amino acids expressed as percentage of total dietary protein than as grams per day or percent total kilocalories; limited generalizability to persons younger than 40 years and older than 59 years; and the apparently small effect size. This last limitation, anticipated by INTERMAP,2 must be kept in perspective: With “small” independent influences of multiple nutrients,1,36 –39 combined effects become substantial, ie, improved nutrition is capable of preventing/reducing unfavorable BP levels for most people, as the DASH and OMNIHEART feeding trial findings demonstrate.14 –16 Also, long-term BP effects of habitual eating patterns, from childhood into middle age, may be greater, as data on salt intake and BP indicate.12 Moreover, reduction of a population’s average SBP by small amounts (eg, 2 mm Hg), is estimated to result in mortality rates that are lower by 6% for stroke and 4% for coronary heart disease.12,40 Finally, eating patterns based mainly on foods with predominantly vegetable protein (those high in glutamic acid, -3/-6 polyunsaturated fatty acids, calcium, magnesium, phosphorus, iron, and other micronutrients; low/moderate in fats/ saturated fats/cholesterol/refined sugars/caloric density; and low in salt/alcohol) have multiple favorable influences on BP, serum lipids, cardiovascular disease risk, and general health. In conclusion, we found an independent inverse relation of dietary glutamic acid to BP with control for multiple possible confounders. Glutamic acid, the most common dietary amino acid, especially in vegetable protein, may be a key component accounting for the previously reported inverse relation of vegetable protein intake to BP. Acknowledgments We thank all INTERMAP staff at local, national, and international centers for their invaluable efforts; a partial listing of these colleagues is given in Reference 2 of this article. We dedicate this paper to the memory of Vernon R. Young, world-renowned amino acid investigator, whose exchange with the senior author years ago was seminal in setting the stage for the research reported here. Sources of Funding This study was supported by grant 2-ROI-HL50490 from the National Heart, Lung, and Blood Institute, National Institutes of Stamler et al Health, and by the National Institutes of Health Office on Dietary Supplements (Bethesda, Md); and by national agencies in China, Japan (the Ministry of Education, Science, Sports, and Culture, grant-in-aid for scientific research [A] No. 090357003), and the United Kingdom. Dietary Glutamic Acid and Blood Pressure 17. 18. Disclosures None. References Downloaded from http://circ.ahajournals.org/ by guest on June 18, 2017 1. Elliott P, Stamler J, Dyer AR, Appel L, Dennis B, Kesteloot H, Ueshima H, Okayama A, Chan Q, Garside DB, Zhou B; for the INTERMAP Cooperative Research Group. Association between protein intake and blood pressure: the INTERMAP Study. Arch Intern Med. 2006;166: 79 – 87. 2. Stamler J, Elliott P, Dennis B, Dyer AR, Kesteloot H, Liu K, Ueshima H, Zhou B, for the INTERMAP Research Group. INTERMAP: background, aims, design, methods, and descriptive statistics (nondietary). J Hum Hypertens. 2003;17:591– 608. 3. Dennis B, Stamler J, Buzzard M, Conway R, Elliott P, Moag-Stahlberg A, Okayama A, Okuda N, Robertson C, Robinson F, Schakel S, Stevens M, Van Heel N, Zhao LC, Zhou BF; for the INTERMAP Research Group. INTERMAP: the dietary data: process and quality control. J Hum Hypertens. 2003;17:609 – 622. 4. He K, Zhao L, Daviglus ML, Dyer AR, Van Horn L, Garside D, Zhu L, Guo D, Wu Y, Zhou B, Stamler J; for the INTERMAP Cooperative Research Group. Association of monosodium glutamate intake with overweight in Chinese adults: the INTERMAP Study. Obesity. 2008;16: 1875–1880. 5. Dyer A, Elliott P, Chee D, Stamler J. Urinary biochemical markers of dietary intake in the INTERSALT Study. Am J Clin Nutr. 1997;65(suppl): 1246S–1253S. 6. Schakel SF, Dennis B, Wold AC, Conway R, Zhao L, Okuda N, Okayama A, Moag-Stahlberg A, Robertson C, Van Heel N, Buzzard IM, Stamler J. Enhancing data on nutrient composition of foods eaten by participants in the INTERMAP study in China, Japan, the United Kingdom, and the United States. J Food Comp Anal. 2003;16:395– 408. 7. Grandits GA, Bartsch GE, Stamler J. Chapter 4: method issues in dietary data analyses in the Multiple Risk Factor Intervention Trial. Am J Clin Nutr. 1997;65(suppl):211S–227S. 8. Dyer AR, Shipley M, Elliott P; for the INTERSALT Cooperative Research Group. Urinary electrolyte excretion in 24 hours and blood pressure in the INTERSALT Study, I: estimates of reliability. Am J Epidemiol. 1994;139:927–939. 9. Dyer AR, Elliott P, Shipley M; for the INTERSALT Cooperative Research Group. Urinary electrolyte excretion in 24 hours and blood pressure in the INTERSALT Study, II: estimates of electrolyte-blood pressure associations corrected for regression dilution bias. Am J Epidemiol. 1994;139:940–951. 10. Dyer AR, Liu K, Sempos CT. Nutrient data analysis techniques and strategies. In: Berdanier CD, Dwyer J, Feldman EB, eds. Handbook of Nutrition and Food, Second Edition. Boca Raton, Fla: CRC Press; 2005: 93–103. 11. Tobin MD, Sheehan NA, Scurrah KJ, Burton PR. Adjusting for treatment effects in studies of quantitative traits: antihypertensive therapy and systolic blood pressure. Stat Med. 2005;24:2911–2935. 12. Stamler J The INTERSALT Study: background, methods, findings, and implications. Am J Clin Nutr. 1997;65(suppl):626S– 642S. 13. Sacks FM, Rosner B, Kass EH. Blood pressure in vegetarians. Am J Epidemiol. 1974;100:390 –398. 14. Appel LJ, Moore TJ, Obarzanek E, Vollmer WM, Svetkey LP, Sacks FM, Bray GA, Vogt TM, Cutler JA, Windhauser MM, Lin PH, Karanja N; for the DASH Collaborative Research Group. A clinical trial on the effects of dietary patterns on blood pressure. N Engl J Med. 1997;336:1117–1124. 15. Sacks FM, Svetkey LP, Vollmer WM, Appel LJ, Bray GA, Harsha D, Obarzanek E, Conlin PR, Miller ER, Simons-Morton DG, Karanja N, Lin PH; for the DASH-Sodium Collaborative Research Group. Effects on blood pressure of reduced dietary sodium and the Dietary Approaches to Stop Hypertension (DASH) diet. N Engl J Med. 2001; 344:3–10. 16. Appel LJ, Sacks FM, Carey VJ, Obarzanek E, Swain JF, Miller ER, Conlin PR, Erlinger TP, Rosner BA, Laranjo NM, Charleston J, 19. 20. 21. 22. 23. 24. 25. 26. 27. 28. 29. 30. 31. 32. 33. 34. 35. 36. 37. 38. 227 McCarron P, Bishop LM; for the OmniHeart Collaborative Research Group. Effects of protein, monounsaturated fat, and carbohydrate intake on blood pressure and serum lipids: results of the OmniHeart Randomized Trial. JAMA. 2005;294:2455–2464. Fernstrom JD, Garattini S, eds. International symposium on glutamate. J Nutr. 2000;130(suppl):891S–1079S. Morselli PL, Garattini S. Monosodium glutamate and the Chinese restaurant syndrome. Nature. 1970;227:611– 612. Rosenblum I, Bradley JD, Coulston F. Single and double blind studies with oral monosodium glutamate in man. Toxicol Appl Pharmacol. 1971; 18:367–373. Zanda G, Franciosi P, Tognoni G, Rizzo M, Standen SM, Morselli PL, Garattini S. A double blind study on the effects of monosodium glutamate in man. Biomedicine. 1973;19:202–204. Yang WH, Drouin MA, Herbert M, Mao Y, Karsh J. The monosodium glutamate symptom complex: assessment in a double-blind, placebocontrolled, randomized study. J Allergy Clin Immunol. 1997;99: 757–762. Prawirohardjono W, Dwiprahasto I, Astuti I, Hadiwandowo S, Kristin E, Muhammad M, Kelly MF. The administration to Indonesians of monosodium L-glutamate in Indonesian foods: an assessment of adverse reactions in a randomized double-blind, crossover, placebo-controlled study. J Nutr. 2000;130(suppl):1074S–1076S. Yamori Y, Kihara M, Nara Y, Ohtaka M, Horie R, Tsunematsu T, Note S. Hypertension and diet: multiple regression analysis in a Japanese farming community. Lancet. 1981;1:1204 –1205. Zhou B, Zhang X, Zhu A, Zhao L, Zhu S, Ruan L, Zhu L, Liang S. The relationship of dietary animal protein and electrolytes to blood pressure: a study on three Chinese populations. Int J Epidemiol. 1994;23:716 –722. Liu L, Ikeda K, Yamori Y; for the WHO-CARDIAC Study Group. Inverse relationship between urinary markers of animal protein intake and blood pressure in Chinese: results from the WHO Cardiovascular Diseases and Alimentary Comparison (CARDIAC) Study. Int J Epidemiol. 2002;31:227–233. Young VR, Ajami AM. Glutamate: an amino acid of particular distinction. J Nutr. 2000;130(suppl):892S–900S. Beutler E. Nutritional and metabolic aspects of glutathione. Ann Rev Nutr. 1989;9:287–302. Prasad A, Andrews NP, Padder FA, Husain M, Quyyumi AA. Glutathione reverses endothelial dysfunction and improves nitric oxide bioavailability. J Am Coll Cardiol. 1999;34:507–514. Reeds PJ, Burrin DG, Stoll B, Jahoor F. Intestinal glutamate metabolism. J Nutr. 2000;130:978S–982S. Bode-Böger SM, Böger RH, Galland A, Tsikas D, Frölich JC. L-arginine–induced vasodilation in healthy humans: pharmacokineticpharmacodynamic relationship. Br J Clin Pharmacol. 1998;46:489 – 497. Food and Nutrition Board, National Academy of Sciences. Protein and amino acids. In: Dietary Reference Intakes for Energy, Carbohydrate, Fiber, Fat, Fatty Acids, Cholesterol, Protein, and Amino Acids. Washington, DC: National Academies Press; 2005:589 –768. Fernstrom JD. Pituitary hormone secretion in normal male humans: acute responses to a large, oral dose of monosodium glutamate. J Nutr. 2000; 130:1053S–1057S. Smith HW. The Kidney: Structure and Function in Health and Disease. New York, NY: Oxford University Press; 1951. Wilson HEC. An investigation of the cause of renal hypertrophy in rats fed on a high protein diet. Biochem J. 1933;27:1348 –1356. Bosch JP, Saccaggi A, Lauer A, Ronco C, Belledonne M, Glabman S. Renal functional reserve in humans: effect of protein intake on glomerular filtration rate. Am J Med. 1983;75:943–950. Ueshima H, Stamler J, Elliott P, Chan Q, Brown IJ, Carnethon M, Daviglus ML, He K, Moag-Stahlberg A, Rodriguez BL, Steffen LM, Van Horn L, Yarnell J, Zhou B; for the INTERMAP Research Group. Food omega-3 fatty acid intake of individuals (total, linolenic acid, long-chain) and their blood pressure: INTERMAP Study. Hypertension. 2007;50: 313–319. Elliott P, Kesteloot H, Appel LJ, Dyer AR, Ueshima H, Chan Q, Brown IJ, Zhao L, Stamler J; for the INTERMAP Cooperative Research Group. Dietary phosphorus and blood pressure: international population study on macronutrients and blood pressure. Hypertension. 2008;51:669 – 675. Miura K, Stamler J, Nakagawa H, Elliott P, Ueshima H, Chan Q, Brown IJ, Tzoulaki I, Saitoh S, Dyer AR, Daviglus ML, Kesteloot H, Okayama A, Curb JD, Rodriguez BL, Elmer PJ, Steffen LM, Robertson C, Zhao L; 228 Circulation July 21, 2009 for the International Study of Macro-Micronutrients and Blood Pressure Research Group. Relationship of dietary linoleic acid to blood pressure: the International Study of Macro-Micronutrients and Blood Pressure. Hypertension. 2008;52:408 – 414. 39. Tzoulaki I, Brown IJ, Chan Q, Van Horn L, Ueshima H, Zhao L, Stamler J, Elliott P; for the International Collaborative Research Group on Mac- ro-/Micronutrients and Blood Pressure. Relation of iron and red meat intake to blood pressure: cross sectional epidemiological study. BMJ. 2008;337:a258. 40. Stamler J, Rose G, Stamler R, Elliott P, Dyer A, Marmot M. INTERSALT Study findings: public health and medical care implications. Hypertension. 1989;14:570 –577. CLINICAL PERSPECTIVE These data showing an independent inverse relationship of dietary glutamic acid (the most common dietary amino acid, especially in vegetable protein) to blood pressure are consistent with previous findings on the inverse relationship of dietary vegetable protein to blood pressure and lend further weight to those results. They generally reinforce current recommendations for a high intake of vegetable products as a part of comprehensive nutritional/lifestyle approaches to preventing and controlling major established cardiovascular risk factors and epidemic cardiovascular disease. Downloaded from http://circ.ahajournals.org/ by guest on June 18, 2017 Glutamic Acid, the Main Dietary Amino Acid, and Blood Pressure: The INTERMAP Study (International Collaborative Study of Macronutrients, Micronutrients and Blood Pressure) Jeremiah Stamler, Ian J. Brown, Martha L. Daviglus, Queenie Chan, Hugo Kesteloot, Hirotsugu Ueshima, Liancheng Zhao and Paul Elliott for the INTERMAP Research Group Downloaded from http://circ.ahajournals.org/ by guest on June 18, 2017 Circulation. 2009;120:221-228; originally published online July 6, 2009; doi: 10.1161/CIRCULATIONAHA.108.839241 Circulation is published by the American Heart Association, 7272 Greenville Avenue, Dallas, TX 75231 Copyright © 2009 American Heart Association, Inc. All rights reserved. Print ISSN: 0009-7322. Online ISSN: 1524-4539 The online version of this article, along with updated information and services, is located on the World Wide Web at: http://circ.ahajournals.org/content/120/3/221 Data Supplement (unedited) at: http://circ.ahajournals.org/content/suppl/2009/07/07/CIRCULATIONAHA.108.839241.DC1 Permissions: Requests for permissions to reproduce figures, tables, or portions of articles originally published in Circulation can be obtained via RightsLink, a service of the Copyright Clearance Center, not the Editorial Office. Once the online version of the published article for which permission is being requested is located, click Request Permissions in the middle column of the Web page under Services. Further information about this process is available in the Permissions and Rights Question and Answer document. Reprints: Information about reprints can be found online at: http://www.lww.com/reprints Subscriptions: Information about subscribing to Circulation is online at: http://circ.ahajournals.org//subscriptions/ SUPPLEMENTAL MATERIAL Glutamic Acid – the Main Dietary Amino Acid – and Blood Pressure: The INTERMAP Study Stamler J, Brown IJ, Daviglus ML, Chan Q, Kesteloot H, Ueshima H, Zhao L, Elliott P for the INTERMAP Research Group Supplemental Tables Table S.1. Descriptive Statistics by Country and for All 4,680 INTERMAP participants Table S.2. Reliability and its Potential Effect on Regression Coefficients for Dietary Amino Acids and Blood Pressure, for Participants of the INTERMAP Study, Men and Women Combined and Separately Table S.3. Partial correlation of dietary amino acids (grams/day) and other variables Table S.4. Partial correlation of dietary amino acids (% kJ) and other variables Table S.5. Partial correlation of dietary amino acids (% Total Protein) and other variables Table S.6. Estimated Mean Difference in Blood Pressure, Proline Intake (% Total Protein) from Foods Higher by 2 s.d., Multiple Regression Analyses Table S.7. Estimated Mean Difference in Blood Pressure, Phenylalanine Intake (% Total Protein) from Foods Higher by 2 s.d., Multiple Regression Analyses 1 Table S.8. Estimated Mean Difference in Blood Pressure, Serine Intake (% Total Protein) from Foods Higher by 2 s.d., Multiple Regression Analyses Table S.9. Sensitivity Analyses: Two Amino Acids Regressed Simultaneously, Model 5b - Mg Table S.10. Estimated Mean Difference in Blood Pressure, by Gender, Glutamic Acid Intake (% Total Protein) from Foods Higher by 2 s.d., Multiple Regression Analyses Table S.11. Estimated Mean Difference in Blood Pressure, by Age Group (40-49 and 50-59 years), Glutamic Acid Intake (% Total Protein) from Foods Higher by 2 s.d., Multiple Regression Analyses 2 Table S.1. Descriptive Statistics by Country and for All 4,680 INTERMAP participants Variable Japan P.R. China UK USA All (N=1,145) (N=839) (N=501) (N=2,195) (N=4,680) Mean (s.d.) Mean (s.d.) Mean (s.d.) Mean (s.d.) Mean (s.d.) Age (years) 49.4 (5.3) 49.0 (5.8) 49.1 (5.6) 49.1 (5.4) 49.2 (5.5) Systolic BP (mm Hg) 117 (14) 121 (17) 120 (15) 119 (14) 119 (15) Diastolic BP (mm Hg) 74 (10) 73 (10) 77 (10) 73 (10) 74 (10) Glutamic Acid, g/day 14.2 (3.2) 15.0 (5.1) 16.8 (4.9) 16.5 (5.3) 15.7 (4.9) Cystine, g/day 1.26 (0.28) 1.33 (0.38) 1.15 (0.34) 1.14 (0.37) 1.20 (0.36) Proline, g/day 4.50 (1.07) 3.93 (1.89) 5.69 (1.69) 5.45 (1.83) 4.97 (1.79) Phenylalanine, g/day 3.57 (0.83) 3.07 (0.95) 3.68 (1.09) 3.69 (1.22) 3.55 (1.10) Serine, g/day 3.54 (0.83) 2.99 (0.93) 3.76 (1.11) 3.80 (1.26) 3.59 (1.14) Glutamic Acid, % kJ 2.81 (0.36) 2.94 (0.48) 3.19 (0.54) 3.02 (0.56) 2.97 (0.51) Cystine, % kJ 0.25 (0.03) 0.26 (0.04) 0.22 (0.04) 0.21 (0.04) 0.23 (0.04) Proline, % kJ 0.89 (0.14) 0.76 (0.27) 1.08 (0.19) 0.99 (0.20) 0.94 (0.22) Phenylalanine, % kJ 0.71 (0.09) 0.61 (0.10) 0.70 (0.13) 0.67 (0.13) 0.67 (0.12) Serine, % kJ 0.70 (0.10) 0.59 (0.10) 0.71 (0.13) 0.69 (0.14) 0.68 (0.13) continued on next page 3 Table S.1. continued, page 2 Glutamic Acid, % total protein 17.8 (1.4) 24.1 (4.4) 20.5 (1.6) 19.8 (1.7) 20.1 (3.1) Cystine, % total protein 1.59 (0.12) 2.16 (0.21) 1.39 (0.11) 1.35 (0.10) 1.56 (0.33) Proline, % total protein 5.67 (0.77) 6.32 (2.47) 6.93 (0.75) 6.53 (0.82) 6.32 (1.33) Phenylalanine, % total protein 4.45 (0.17) 4.90 (0.20) 4.43 (0.16) 4.36 (0.17) 4.48 (0.26) Serine, % total protein 4.41 (0.18) 4.76 (0.24) 4.54 (0.23) 4.49 (0.24) 4.52 (0.25) Energy, kJ/day 8530 (1879) 8518 (2413) 9070 (2644) 9390 (2923) 8989 (2613) Total Protein, g/day 80.7 (19.9) 63.0 (19.7) 83.5 (25.1) 84.9 (28.4) 79.8 (26.0) Animal Protein, g/day 45.1 (16.0) 12.8 (13.2) 51.4 (20.7) 55.9 (23.6) 45.1 (25.4) Vegetable Protein, g/day 35.6 (8.4) 50.2 (15.6) 32.1 (10.7) 28.0 (10.8) 34.3 (13.9) Total Fat, g/day 56.8 (16.6) 45.9 (20.4) 81.0 (31.7) 84.4 (33.9) 70.4 (32.3) Total SFA, g/day 15.0 (5.1) 11.5 (5.9) 29.4 (13.6) 28.0 (12.5) 22.1 (12.7) Total MFA, g/day 20.6 (6.7) 18.5 (8.6) 27.3 (11.0) 31.9 (13.5) 26.2 (12.5) Oleic Acid, g/day 18.3 (6.2) 15.4 (8.2) 24.8 (10.0) 29.8 (12.6) 23.8 (12.0) Total PFA, g/day 14.6 (4.6) 13.5 (7.0) 15.2 (6.9) 17.9 (8.1) 16.0 (7.3) Linoleic Acid, g/day 11.3 (3.9) 12.2 (6.6) 13.3 (6.3) 15.8 (7.3) 13.8 (6.7) Total Omega-3, g/day 3.06 (1.12) 1.24 (0.92) 1.76 (0.80) 1.87 (0.93) 2.04 (1.15) continued on next page 4 Table S.1. continued, page 3 Total Omega-6, g/day 11.5 (3.9) 12.2 (6.7) 13.5 (6.3) 16.0 (7.3) 13.9 (6.7) Total TFA, g/day 0.99 (0.67) 0.42 (0.80) 3.34 (1.93) 5.03 (2.83) 3.03 (2.92) Total Carbohydrate, g/day 273 (64) 327 (99) 253 (77) 274 (92) 281 (88) Starch, g/day 179 (54) 283 (90) 145 (49) 125 (45) 169 (82) Estimated Total Sugars, g/day 93 (27) 44 (31) 108 (43) 149 (66) 112 (64) Total Dietary Fiber, g/day 15.6 (4.8) 28.1 (9.5) 25.5 (9.2) 19.1 (7.9) 20.6 (8.9) Calcium, mg/day 606 (221) 303 (143) 933 (319) 791 (372) 674 (362) Magnesium, mg/day 269 (66) 308 (115) 320 (94) 319 (112) 305 (103) Phosphorus, mg/day 1134 (282) 879 (307) 1392 (410) 1295 (441) 1192 (416) Total Iron, mg/day 10.7 (2.8) 15.8 (5.7) 13.1 (4.2) 16.9 (7.1) 14.8 (6.3) Non-Heme Iron, mg/day 9.6 (2.6) 15.3 (5.4) 12.3 (4.1) 15.8 (6.9) 13.8 (6.1) Copper, mg/day 1.36 (0.41) 2.37 (0.72) 1.37 (0.45) 1.46 (0.57) 1.59 (0.67) Selenium, μg/day 171 (75) 34 (14) 95 (38) 132 (65) 120 (75) 14-day Alcohol, g/day 17.0 (22.6) 8.6 (21.4) 14.7 (19.2) 6.9 (13.7) 10.5 (18.8) Total Protein, % kJ 16.0 (2.3) 12.4 (1.9) 15.8 (3.1) 15.5 (3.2) 15.1 (3.1) Animal Protein, % kJ 8.9 (2.4) 2.5 (2.4) 9.8 (3.3) 10.2 (3.2) 8.4 (4.1) continued on next page 5 Table S.1. continued, page 4 Vegetable Protein, % kJ 7.1 (1.1) 9.9 (1.3) 6.1 (1.4) 5.2 (1.6) 6.6 (2.2) Total Fat, % kJ 24.9 (5.0) 20.0 (6.1) 32.8 (6.5) 32.9 (6.9) 28.6 (8.2) Total SFA, % kJ 6.6 (1.8) 5.0 (2.0) 12.1 (3.3) 10.7 (2.8) 8.8 (3.6) Total MFA, % kJ 9.0 (2.2) 8.1 (2.8) 11.0 (2.5) 12.2 (2.9) 10.5 (3.2) Oleic Acid, % kJ 8.0 (2.0) 6.7 (2.8) 10.0 (2.3) 11.6 (2.8) 9.6 (3.2) Total PFA, % kJ 6.4 (1.5) 5.8 (2.2) 6.2 (1.9) 7.0 (2.2) 6.5 (2.1) Linoleic Acid, % kJ 4.9 (1.3) 5.3 (2.1) 5.4 (1.8) 6.2 (2.0) 5.7 (2.0) Total Omega-3, % kJ 1.35 (0.38) 0.55 (0.37) 0.73 (0.26) 0.75 (0.31) 0.86 (0.44) Total Omega-6, % kJ 5.0 (1.3) 5.3 (2.1) 5.5 (1.8) 6.3 (2.0) 5.7 (2.0) Total TFA, % kJ 0.44 (0.30) 0.18 (0.34) 1.36 (0.61) 1.94 (0.80) 1.20 (0.98) Total Carbohydrate, % kJ 54.2 (7.3) 65.0 (10.0) 44.5 (6.6) 49.4 (8.1) 52.9 (10.3) Starch, % kJ 35.5 (7.3) 56.5 (10.3) 25.5 (5.2) 22.8 (5.7) 32.2 (14.3) Estimated Total Sugars, % kJ 18.7 (4.7) 8.5 (5.2) 20.3 (6.0) 16.7 (8.2) 20.8 (9.5) Total Dietary Fiber, g/1,000 kJ 1.9 (0.5) 3.4 (0.9) 2.9 (0.9) 2.2 (0.8) 2.4 (1.0) Calcium, mg/1,000 kJ 73.0 (26.0) 35.7 (13.4) 106.5 (28.4) 86.8 (33.9) 76.3 (35.6) Magnesium, mg/1,000 kJ 32.1 (6.0) 37.0 (11.1) 36.6 (8.4) 35.4 (9.6) 35.0 (9.2) continued on next page 6 Table S.1. continued, page 5 Phosphorus, mg/1,000 kJ 135 (23) 105 (27) 158 (30) 141 (30) 135 (32) Total Iron, mg/1,000 kJ 1.3 (0.3) 1.9 (0.4) 1.5 (0.4) 1.9 (0.6) 1.7 (0.6) Non-Heme Iron, mg/1,000 kJ 1.1 (0.3) 1.8 (0.4) 1.4 (0.4) 1.7 (0.6) 1.6 (0.5) Copper, mg/1,000 kJ 0.16 (0.04) 0.28 (0.04) 0.16 (0.04) 0.16 (0.05) 0.18 (0.06) Selenium, μg/1,000 kJ 20.2 (7.8) 4.0 (1.0) 10.7 (3.4) 14.3 (6.0) 13.5 (7.8) Urinary Sodium, mmol/24-hr 198 (56) 228 (100) 145 (49) 163 (59) 181 (72) Urinary Potassium, mmol/24-hr 49 (14) 38 (13) 68 (20) 58 (21) 53 (20) Urinary Sodium/Potassium Ratio 4.23 (1.24) 6.32 (2.83) 2.23 (0.80) 3.04 (1.20) 3.83 2.07 Height, m 1.61 (0.09) 1.59 (0.08) 1.69 (0.09) 1.68 (0.10) 1.65 (0.10) Weight, kg 61.2 (10.2) 58.9 (10.0) 78.2 (15.3) 82.3 (19.6) 72.5 (19.0) Body Mass Index, kg/m2 23.4 (2.9) 23.1 (3.4) 27.5 (4.6) 28.9 (5.9) 26.4 (5.5) 2.5 (3.6) 6.0 (3.8) 2.2 (2.4) 3.2 (3.1) 3.4 (3.5) Physical Activity, hours/day moderate + heavy activity continued on next page 7 Table S.1. continued, page 6 n (%) n (%) n (%) n (%) n (%) -Yes 528 (46.1) 298 (35.5) 242 (48.3) 1,491 (67.9) 2,559 (54.7) -Unknown 406 (35.5) 188 (22.4) 188 (37.5) 489 (22.3) 1,271 (27.2) 1,039 (90.7) 382 (45.5) 444 (88.6) 1,533 (69.8) 3,398 (72.6) diabetic, fat modified, or other 76 (6.6) 45 (5.4) 106 (21.2) 401 (18.3) 628 (13.4) Taking dietary supplement 243 (21.2) 34 (4.1) 191 (38.1) 1,136 (51.8) 1,604 (34.3) High blood pressure* 153 (13.4) 145 (17.3) 116 (23.2) 595 (27.1) 1,009 (21.6) 131 (11.4) 59 (7.0) 54 (10.8) 343 (15.6) 587 (12.5) 124 (10.8) 86 (10.3) 98 (19.6) 644 (29.3) 952 (20.3) Family history of hypertension in any first degree relative Current alcohol drinkers Special diet: weight loss, weight gain, vegetarian, salt reduced, History of heart attack, other heart disease, stroke, or diabetes Taking prescribed drug treatment for high BP, CVD†, diabetes, or affecting cardiovascular system continued on next page 8 Table S.1. continued, page 7 BP: blood pressure; SFA: saturated fatty acids; MFA: monounsaturated fatty acids; PFA: polyunsaturated fatty acids; TFA: trans fatty acids; CVD: cardiovascular diseases. *Systolic BP ≥140 mm Hg or diastolic BP ≥90 mm Hg or reporting use of medication for high BP † Includes lipid-lowering drugs 9 Table S.2. Reliability and its Potential Effect on Regression Coefficients† for Dietary Amino Acids and Blood Pressure, for Participants of the INTERMAP Study, Men and Women Combined and Separately Variable (units) Japan Ratio* PR China (%)† Ratio (%) UK Ratio USA Overall (%) Ratio (%) Ratio (%) Men and women combined (N=4,680) Glutamic Acid Cystine Proline Phenylalanine (g/day) 1.97 (67.0) 1.41 (73.9) 2.00 (66.7) 1.97 (67.0) 1.87 (68.1) (% kJ) 3.28 (55.0) 2.13 (65.2) 2.23 (64.2) 2.50 (61.5) 2.59 (60.7) (% Protein) 2.90 (58.0) 0.56 (87.7) 3.53 (53.1) 3.01 (57.1) 2.60 (60.6) (g/day) 1.80 (69.0) 1.57 (71.8) 2.28 (63.7) 2.20 (64.5) 2.00 (66.7) (% kJ) 3.61 (52.6) 1.45 (73.4) 2.20 (64.6) 2.62 (60.4) 2.61 (60.5) (% Protein) 2.61 (60.6) 2.09 (65.6) 2.85 (58.4) 3.97 (50.2) 3.18 (55.7) (g/day) 2.04 (66.3) 0.76 (84.0) 1.82 (68.8) 1.82 (68.8) 1.68 (70.4) (% kJ) 2.53 (61.3) 0.59 (87.2) 2.06 (66.0) 2.32 (63.3) 2.03 (66.3) (% Protein) 2.63 (60.3) 0.25 (94.1) 3.11 (56.2) 2.47 (61.8) 2.18 (64.7) (g/day) 1.86 (68.3) 1.97 (67.0) 2.15 (65.0) 2.12 (65.3) 2.03 (66.3) (% kJ) 3.07 (56.6) 1.95 (67.3) 2.35 (63.0) 2.69 (59.8) 2.61 (60.5) (% Protein) 2.33 (63.2) 1.91 (67.7) 2.53 (61.3) 2.71 (59.6) 2.46 (61.9) continued on next page 10 Table S.2. continued, page 2 Serine (g/day) 1.88 (68.0) 1.82 (68.8) 2.05 (66.1) 2.09 (65.7) 1.99 (66.8) (% kJ) 3.16 (55.9) 1.72 (69.9) 2.29 (63.5) 2.57 (60.9) 2.53 (61.2) (% Protein) 3.52 (53.2) 2.01 (66.5) 3.33 (54.5) 3.88 (50.8) 3.40 (54.1) Systolic BP (mm Hg) 0.22 (94.9) 0.23 (94.5) 0.24 (94.4) 0.26 (94.0) 0.24 (94.3) Diastolic BP (mm Hg) 0.27 (93.7) 0.32 (92.6) 0.31 (92.8) 0.31 (92.9) 0.30 (93.0) Men (N=2,359) Glutamic Acid Cystine Proline (g/day) 1.56 (71.9) 1.50 (72.7) 1.91 (67.7) 1.81 (68.8) 1.56 (71.9) (% kJ) 1.85 (68.3) 2.18 (64.7) 2.30 (63.5) 2.32 (63.3) 1.85 (68.3) (% Protein) 0.48 (89.4) 2.52 (61.4) 2.72 (59.5) 2.40 (62.5) 0.48 (89.4) (g/day) 1.78 (69.1) 1.66 (70.7) 2.18 (64.7) 1.96 (67.1) 1.78 (69.1) (% kJ) 1.30 (75.4) 2.03 (66.3) 2.43 (62.2) 2.35 (63.0) 1.30 (75.4) (% Protein) 1.93 (67.5) 2.11 (65.5) 3.82 (51.2) 2.91 (57.9) 1.93 (67.5) (g/day) 0.82 (83.0) 1.37 (74.5) 1.75 (69.6) 1.62 (71.2) 0.82 (83.0) (% kJ) 0.56 (87.7) 1.94 (67.4) 2.06 (66.0) 1.80 (68.9) 0.56 (87.7) (% Protein) 0.24 (94.3) 2.52 (61.3) 2.30 (63.5) 2.10 (65.5) 0.24 (94.3) continued on next page 11 Table S.2. continued, page 3 Phenylalanine (g/day) 2.31 (63.4) 1.60 (71.5) 2.06 (66.1) 2.01 (66.5) 2.31 (63.4) (% kJ) 1.88 (68.0) 2.22 (64.3) 2.44 (62.1) 2.44 (62.1) 1.88 (68.0) (% Protein) 1.89 (67.9) 2.37 (62.8) 2.51 (61.5) 2.22 (64.3) 1.89 (67.9) (g/day) 2.10 (65.6) 1.53 (72.3) 2.09 (65.7) 1.99 (66.8) 2.10 (65.6) (% kJ) 1.59 (71.5) 2.23 (64.2) 2.38 (62.7) 2.39 (62.6) 1.59 (71.5) (% Protein) 1.75 (69.6) 2.73 (59.4) 3.44 (53.7) 2.88 (58.2) 1.75 (69.6) Systolic BP (mm Hg) 0.23 (94.6) 0.21 (94.9) 0.22 (94.9) 0.29 (93.3) 0.25 (94.1) Diastolic BP (mm Hg) 0.27 (93.7) 0.30 (93.1) 0.33 (92.4) 0.31 (92.9) 0.30 (93.1) Serine Women (N=2,321) Glutamic Acid Cystine (g/day) 2.00 (66.7) 1.26 (76.0) 2.56 (61.0) 2.03 (66.3) 1.93 (67.4) (% kJ) 3.80 (51.3) 2.40 (62.5) 2.28 (63.7) 2.70 (59.7) 2.87 (58.2) (% Protein) 2.67 (60.0) 0.64 (86.2) 4.67 (46.1) 3.30 (54.8) 2.80 (58.8) (g/day) 1.81 (68.9) 1.36 (74.6) 2.99 (57.2) 2.22 (64.3) 2.04 (66.2) (% kJ) 4.12 (49.2) 1.60 (71.5) 2.38 (62.7) 2.81 (58.8) 2.87 (58.2) (% Protein) 2.97 (57.4) 2.26 (63.9) 3.68 (52.1) 4.11 (49.3) 3.45 (53.7) continued on next page 12 Table S.2. continued, page 4 Proline (g/day) 2.00 (66.7) 0.70 (85.0) 2.33 (63.2) 1.89 (68.0) 1.74 (69.6) (% kJ) 2.91 (57.9) 0.61 (86.8) 2.21 (64.4) 2.59 (60.7) 2.27 (63.8) (% Protein) 2.39 (62.6) 0.27 (93.8) 3.78 (51.4) 2.63 (60.3) 2.26 (63.9) (g/day) 1.82 (68.8) 1.64 (71.0) 2.78 (59.0) 2.19 (64.6) 2.06 (66.0) (% kJ) 3.19 (55.6) 2.01 (66.6) 2.49 (61.6) 2.94 (57.6) 2.79 (58.9) (% Protein) 2.84 (58.5) 1.93 (67.4) 2.71 (59.6) 2.92 (57.8) 2.70 (59.7) (g/day) 1.84 (68.5) 1.54 (72.2) 2.64 (60.3) 2.09 (65.7) 1.98 (66.8) (% kJ) 3.26 (55.1) 1.86 (68.3) 2.37 (62.8) 2.76 (59.2) 2.68 (59.9) (% Protein) 4.38 (47.7) 2.28 (63.7) 4.01 (49.9) 4.32 (48.1) 3.93 (50.4) Systolic BP (mm Hg) 0.20 (95.2) 0.26 (94.0) 0.26 (93.9) 0.23 (94.6) 0.23 (94.6) Diastolic BP (mm Hg) 0.26 (93.8) 0.34 (92.2) 0.29 (93.2) 0.30 (92.9) 0.30 (93.0) Phenylalanine Serine * Ratio of intra-individual to inter-individual variance estimated separately for 8 country-gender subgroups and pooled by N-1, to prevent between-country and -gender differences from inflating between-person variance and spuriously reducing the ratio † Observed regression coefficient as a percentage of a theoretical regression coefficient in univariate regression analysis, based on 4 repeat measures (for BP, 4× mean of 2 consecutive readings), calculated from the formula 1/[1+(reliability ratio/4)]×100 13 Table S.3. Partial correlation* of dietary amino acids (grams/day) and other variables Variable Glutamic Acid, Cystine, Proline, Phenylalanine, Serine, g/day g/day g/day g/day g/day 1 0.84 0.90 0.88 0.87 Cystine, g/day 0.84 1 0.65 0.88 0.87 Proline, g/day 0.90 0.65 1 0.74 0.74 Phenylalanine, g/day 0.88 0.88 0.74 1 0.98 Serine, g/day 0.87 0.87 0.74 0.98 1 Total Protein, g/day 0.86 0.86 0.71 0.97 0.96 Animal Protein, g/day 0.62 0.63 0.54 0.80 0.80 Vegetable Protein, g/day 0.33 0.32 0.23 0.19 0.16 Total Fat, g/day 0.04 0.03 0.04 0.11 0.13 Total SFA, g/day 0.06 -0.02 0.12 0.10 0.12 Total MFA, g/day 0.01 0.03 -0.01 0.08 0.10 Oleic Acid, g/day -0.01 0.01 -0.02 0.06 0.08 Total PFA, g/day 0.002 0.02 -0.04 0.04 0.03 Linoleic Acid, g/day -0.02 -0.01 -0.05 -0.004 -0.01 Glutamic Acid, g/day continued on next page 14 Table S.3. continued, page 2 Total Omega-3, g/day 0.08 0.10 0.01 0.14 0.14 Total Omega-6, g/day -0.02 -0.001 -0.05 0.004 -0.001 Total TFA, g/day -0.05 -0.08 0.001 -0.09 -0.09 Total Carbohydrate, g/day -0.18 -0.16 -0.16 -0.31 -0.31 0.12 0.19 0.05 -0.02 -0.04 -0.31 -0.37 -0.20 -0.31 -0.29 Total Dietary Fiber, g/day 0.14 0.16 0.12 0.11 0.10 Calcium, mg/day 0.40 0.17 0.52 0.39 0.42 Magnesium, mg/day 0.32 0.34 0.28 0.38 0.36 Phosphorus, mg/day 0.60 0.56 0.60 0.70 0.71 Total Iron, mg/day 0.36 0.35 0.31 0.38 0.37 Non-Heme Iron, mg/day 0.32 0.31 0.28 0.32 0.31 Copper, mg/day 0.21 0.28 0.12 0.23 0.22 Selenium, μg/day 0.38 0.40 0.29 0.40 0.42 -0.13 -0.17 -0.10 -0.08 -0.09 Starch, g/day Estimated Total Sugars, g/day 14-day Alcohol, g/day continued on next page 15 Table S.3. continued, page 3 Urinary Sodium, mmol/24-hr 0.17 0.17 0.14 0.16 0.16 Urinary Potassium, mmol/24-hr 0.22 0.15 0.24 0.22 0.22 Urinary Sodium/Potassium Ratio -0.03 0.02 -0.07 -0.05 -0.04 Height, m 0.02 0.02 0.04 0.02 0.02 Weight, kg 0.09 0.11 0.07 0.12 0.11 Body Mass Index, kg/m2 0.08 0.10 0.06 0.11 0.11 Systolic BP, mm Hg -0.02 0.003 -0.02 -0.001 0.001 Diastolic BP, mm Hg -0.03 -0.02 -0.02 -0.01 -0.01 SFA: saturated fatty acids; MFA: monounsaturated fatty acids; PFA: polyunsaturated fatty acids; TFA: trans fatty acids; BP: blood pressure. * Pooled by country (weighted by N), adjusted for age, gender, center, energy 16 Table S.4. Partial correlation* of dietary amino acids (% kJ) and other variables Variable Glutamic Acid, Cystine, Proline, Phenylalanine, Serine, % kJ % kJ % kJ % kJ % kJ 1 0.84 0.89 0.89 0.88 Cystine, % kJ 0.84 1 0.65 0.88 0.88 Proline, % kJ 0.89 0.65 1 0.75 0.75 Phenylalanine, % kJ 0.89 0.88 0.75 1 0.98 Serine, % kJ 0.88 0.88 0.75 0.98 1 Total Protein, % kJ 0.87 0.86 0.73 0.97 0.96 Animal Protein, % kJ 0.65 0.64 0.57 0.81 0.81 Vegetable Protein, % kJ 0.35 0.35 0.24 0.23 0.20 Total Fat, % kJ 0.01 -0.01 0.02 0.06 0.08 Total SFA, % kJ 0.02 -0.07 0.10 0.05 0.07 Total MFA, % kJ -0.03 -0.02 -0.03 0.02 0.04 Oleic Acid, % kJ -0.04 -0.03 -0.03 0.01 0.03 Total PFA, % kJ -0.02 -0.01 -0.06 0.01 0.001 Linoleic Acid, % kJ -0.04 -0.03 -0.07 -0.03 -0.03 Glutamic Acid, % kJ continued on next page 17 Table S.4. continued, page 2 Total Omega-3, % kJ 0.07 0.10 -0.01 0.14 0.14 Total Omega-6, % kJ -0.04 -0.02 -0.06 -0.02 -0.03 Total TFA, % kJ -0.08 -0.12 -0.03 -0.13 -0.12 Total Carbohydrate, % kJ -0.19 -0.15 -0.17 -0.28 -0.29 0.12 0.21 0.04 0.002 -0.02 Estimated Total Sugars, % kJ -0.30 -0.38 -0.19 -0.31 -0.28 Total Dietary Fiber, g/1,000 kJ 0.17 0.19 0.16 0.16 0.14 Calcium, mg/1,000 kJ 0.39 0.17 0.53 0.38 0.41 Magnesium, mg/1,000 kJ 0.35 0.36 0.32 0.40 0.38 Phosphorus, mg/1,000 kJ 0.62 0.57 0.62 0.71 0.72 Total Iron, mg/1,000 kJ 0.37 0.35 0.33 0.39 0.38 Non-Heme Iron, mg/1,000 kJ 0.33 0.31 0.31 0.33 0.32 Copper, mg/1,000 kJ 0.24 0.30 0.16 0.26 0.25 Selenium, μg/1,000 kJ 0.40 0.42 0.31 0.43 0.44 14-day Alcohol, g/day -0.14 -0.18 -0.10 -0.11 -0.11 Starch, % kJ continued on next page 18 Table S.4. continued, page 3 Urinary Sodium, mmol/24-hr 0.10 0.11 0.08 0.10 0.10 Urinary Potassium, mmol/24-hr 0.18 0.10 0.21 0.18 0.18 Urinary Sodium/Potassium Ratio -0.05 0.01 -0.09 -0.06 -0.06 Height, m -0.01 -0.01 0.01 -0.001 0.003 Weight, kg 0.06 0.07 0.05 0.09 0.08 Body Mass Index, kg/m2 0.06 0.08 0.05 0.09 0.09 Systolic BP, mm Hg -0.03 -0.01 -0.03 -0.01 -0.01 Diastolic BP, mm Hg -0.03 -0.03 -0.03 -0.02 -0.02 SFA: saturated fatty acids; MFA: monounsaturated fatty acids; PFA: polyunsaturated fatty acids; TFA: trans fatty acids; BP: blood pressure. * Pooled by country (weighted by N), adjusted for age, gender, center 19 Table S.5. Partial correlation* of dietary amino acids (% Total Protein) and other variables Variable Glutamic Acid, Cystine, Proline, Phenylalanine, Serine, % Total Protein % Total Protein % Total Protein % Total Protein % Total Protein 1 0.45 0.80 0.47 0.37 Cystine, % Total Protein 0.45 1 0.16 0.43 0.39 Proline, % Total Protein 0.80 0.16 1 0.39 0.36 Phenylalanine, % Total Protein 0.47 0.43 0.39 1 0.80 Serine, % Total Protein 0.37 0.39 0.36 0.80 1 Total Protein, % kJ -0.37 -0.41 -0.30 -0.28 -0.23 Animal Protein, % kJ -0.53 -0.54 -0.35 -0.42 -0.30 0.36 0.35 0.14 0.34 0.18 Total Fat, % kJ -0.08 -0.11 -0.04 0.02 0.08 Total SFA, % kJ -0.02 -0.20 0.11 0.05 0.13 Total MFA, % kJ -0.09 -0.06 -0.08 -0.02 0.06 Oleic Acid, % kJ -0.08 -0.04 -0.06 -0.01 0.06 Total PFA, % kJ -0.02 0.03 -0.07 0.05 0.03 0.03 0.07 -0.03 0.08 0.05 Glutamic Acid, % Total Protein Vegetable Protein, % kJ Linoleic Acid, % kJ continued on next page 20 Table S.5. continued, page 2 Total Omega-3, % kJ -0.16 -0.12 -0.20 -0.07 -0.07 Total Omega-6, % kJ 0.02 0.07 -0.04 0.08 0.05 Total TFA, % kJ 0.14 0.08 0.15 0.07 0.08 Total Carbohydrate, % kJ 0.33 0.37 0.21 0.27 0.20 Starch, % kJ 0.39 0.55 0.15 0.37 0.21 Estimated Total Sugars, % kJ 0.001 -0.14 0.11 -0.08 0.01 Total Dietary Fiber, g/1,000 kJ 0.06 0.09 0.03 0.11 0.03 Calcium, mg/1,000 kJ 0.09 -0.35 0.31 0.23 0.27 Magnesium, mg/1,000 kJ -0.10 -0.12 -0.07 0.04 -0.04 Phosphorus, mg/1,000 kJ -0.18 -0.32 -0.03 0.07 0.10 Total Iron, mg/1,000 kJ -0.01 -0.05 -0.01 0.02 -0.01 0.05 0.004 0.04 0.09 0.05 Copper, mg/1,000 kJ -0.05 0.04 -0.13 0.02 -0.02 Selenium, μg/1,000 kJ -0.10 -0.05 -0.12 -0.15 -0.05 14-day Alcohol, g/day -0.17 -0.21 -0.08 -0.23 -0.22 Non-Heme Iron, mg/1,000 kJ continued on next page 21 Table S.5. continued, page 3 Urinary Sodium, mmol/24-hr -0.04 -0.02 -0.05 -0.04 -0.03 Urinary Potassium, mmol/24-hr -0.06 -0.21 0.01 -0.05 -0.04 Urinary Sodium/Potassium Ratio 0.01 0.16 -0.05 0.01 0.01 Height, m -0.01 -0.02 0.02 0.01 0.01 Weight, kg -0.08 -0.05 -0.06 -0.04 -0.04 Body Mass Index, kg/m2 -0.08 -0.05 -0.07 -0.04 -0.04 Systolic BP, mm Hg -0.08 -0.03 -0.06 -0.07 -0.05 Diastolic BP, mm Hg -0.06 -0.04 -0.03 -0.07 -0.05 SFA: saturated fatty acids; MFA: monounsaturated fatty acids; PFA: polyunsaturated fatty acids; TFA: trans fatty acids; BP: blood pressure. * Pooled by country (weighted by N), adjusted for age, gender, center 22 Table S.6. Estimated Mean Difference in Blood Pressure, Proline Intake (% Total Protein) from Foods Higher by 2 s.d., Multiple Regression Analyses Model Systolic BP Diastolic BP Difference, mm Hg (Z-value) Difference, mm Hg (Z- value) 4 -1.56 (-2.16) -0.81* (-1.67) 5a - P -1.50 (-2.03) -0.76 (-1.52) 5b - Mg -1.88 (-2.58) -1.05* (-2.13) 5c - Ca -0.28 (-0.35) -0.05 (-0.10) 5d - Fe -1.45 (-2.00) -0.79* (-1.62) 5e - Fiber -1.61 (-2.24) -0.83* (-1.72) Main Analyses – All 4,680 Participants continued on next page 23 Table S.6. continued, page 2 Sensitivity Analyses Adjusted also for Education (years), and Current Smoking (yes/no) – N=4,680 4 -1.52 (-2.11) -0.85 (-1.76) 5b - Mg -1.85 (-2.53) -1.10 (-2.23) 4 -1.52 (-2.11) -0.75 (-1.54) 5b - Mg -1.85 (-2.53) -0.97 (-1.98) 4 -1.52 (-2.11) -0.76 (-1.57) 5b - Mg -1.85 (-2.53) -1.00 (-2.03) Adjusted also for Month of Field Survey – N=4,680 Adjusted also for Season of Field Survey – N=4,680 continued on next page 24 Table S.6. continued, page 3 Adjusted also for Total Energy (kJ/day) – (N=4,680) 4 -1.61 (-2.24) -0.81* (-1.68) 5b - Mg -1.92 (-2.63) -1.05* (-2.14) 4 -1.38 (-1.92) -0.68* (-1.40) 5b - Mg -1.68 (-2.30) -0.88 (-1.79) 4 -1.30 (-1.73) -0.76* (-1.52) 5b - Mg -1.35 (-1.78) -0.90* (-1.77) Adjusted for Urinary Na/Creatinine and K/Creatinine Ratio (mmol/mmol) instead of Urinary Na and Urinary K (mmol/24-h) – (N=4,680) Adjusted also for Total Carbohydrate (% kJ) – (N=4,680) continued on next page 25 Table S.6. continued, page 4 Adjusted also for Starch (% kJ) – (N=4,680) 4 -1.22 (-1.66) -0.54* (-1.10) 5b - Mg -1.64 (-2.20) -0.83 (-1.65) 4 -2.18* (-2.72) -1.14* (-2.14) 5b - Mg -2.49 (-3.06) -1.37* (-2.51) 4 -1.49 (-2.53) -0.48 (-1.09) 5b - Mg -1.75 (-2.92) -0.69 (-1.55) 4 -2.10 (-2.44) -1.25 (-2.15) 5b - Mg -2.29 (-2.64) -1.44 (-2.45) Censored normal regression adjusting for antihypertensive treatment – (N=4,680) Nonhypertensive Persons – (N=3,671) Excluding Persons with High Day-to-day Variability in Nutrient Intake and/or BP – (N=3,473) continued on next page 26 Table S.6. continued, page 5 Proline Expressed as grams/day (instead of % Total Protein) – (N=4,680) 4 + Total Energy (kJ/day) -1.74 (-2.18) -0.96 (-1.78) 5b - Mg + Total Energy (kJ/day) -0.60 (-0.70) -0.48* (-0.84) 4 + Total Energy + Height + Weight -1.80 (-2.37) -1.00 (-1.93) 5b - Mg + Total Energy + Height + Weight -1.47 (-1.81) -1.01 (-1.81) 4 -1.18 -2.32 -0.70* -2.03 5b - Mg -0.34 -0.61 -0.38* -1.00 4 + Height + Weight -1.11 -2.28 -0.64* -1.91 5b - Mg + Height + Weight -0.85 -1.60 -0.66* -1.82 Proline Expressed as % kJ (instead of % Total Protein) – (N=4,680) continued on next page 27 Table S.6. continued, page 6 Model 4: Controlled for Sample, Age, Gender, Diet (Yes/No), Supplement Intake (Yes/No), CVD-DM Diagnosis (Yes/No), Physical Activity (Medium + Heavy, hours/day), Family History of High BP (Yes, No or Unknown), Urinary Na and Urinary K (mmol/24-h), 14-day Alcohol (grams/day), Cholesterol (mg/1,000 kJ), Total SFA and Total PFA (% kJ) Model 5a-5e, Main Analyses: Controlled for Model 4 variables + each stipulated nutrient (expressed per 1,000 kJ) Sensitivity Analyses: controlled for Model 4 variables + each stipulated variable, or variables in Model 5b - Mg + each stipulated variable Month of field survey: mid-point between first and fourth clinic visit. Season of field survey: Winter = December/January/February; Spring = March/April/May; Summer = June/July/August; Fall = September/October/November Z-value=regression coefficient/standard error; Z-value ≥1.96: uncorrected p ≤0.05; ≥2.58: uncorrected p ≤0.01; ≥3.29: uncorrected p ≤0.001 2 s.d. higher proline intake for % Total Protein – 2.54%; for grams/day – 3.34; for % Total Kilocalories – 0.40% *Test for cross-country heterogeneity significant, p <0.05. 28 Table S.7. Estimated Mean Difference in Blood Pressure, Phenylalanine Intake (% Total Protein) from Foods Higher by 2 s.d., Multiple Regression Analyses Model Systolic BP Diastolic BP Difference, mm Hg (Z- value) Difference, mm Hg (Z- value) 4 -1.49 (-3.35) -1.03 (-3.40) 5a - P -1.13 (-2.46) -0.81 (-2.59) 5b - Mg -1.31 (-2.89) -0.98 (-3.16) 5c - Ca -0.90 (-1.89) -0.70 (-2.17) 5d - Fe -1.33 (-2.97) -0.96 (-3.14) 5e - Fiber -1.28 (-2.83) -0.94 (-3.05) Main Analyses – All 4,680 Participants continued on next page 29 Table S.7. continued, page 2 Sensitivity Analyses Adjusted also for Education (years), and Current Smoking (yes/no) – N=4,680 4 -1.47 (-3.29) -1.07 (-3.52) 5b - Mg -1.30 (-2.85) -1.03 (-3.31) 4 -1.47 (-3.27) -1.04 (-3.40) 5b - Mg -1.28 (-2.80) -0.98 (-3.15) 4 -1.47 (-3.30) -1.04 (-3.41) 5b - Mg -1.30 (-2.84) -0.98 (-3.17) Adjusted also for Month of Field Survey – N=4,680 Adjusted also for Season of Field Survey – N=4,680 continued on next page 30 Table S.7. continued, page 3 Adjusted also for Total Energy (kJ/day) – (N=4,680) 4 -1.57 (-3.52) -1.04 (-3.42) 5b - Mg -1.37 (-3.00) -0.98 (-3.14) 4 -1.44 (-3.23) -1.00 (-3.30) 5b - Mg -1.34 (-2.94) -0.98 (-3.16) -1.36* (-2.85) -1.09 (-3.36) -0.88 (-1.79) -0.92 (-2.74) Adjusted for Urinary Na/Creatinine and K/Creatinine Ratio (mmol/mmol) instead of Urinary Na and Urinary K (mmol/24-h) – (N=4,680) Adjusted also for Total Carbohydrate (% kJ) – (N=4,680) 4 5b - Mg continued on next page 31 Table S.7. continued, page 4 Adjusted also for Starch (% kJ) – (N=4,680) 4 -1.36 (-2.80) -0.87 (-2.62) 5b - Mg -1.18 (-2.40) -0.79 (-2.36) 4 -2.01* (-3.98) -1.41 (-4.13) 5b - Mg -1.80 (-3.49) -1.33 (-3.81) 4 -0.58* (-1.55) -0.63 (-2.25) 5b - Mg -0.48* (-1.24) -0.61 (-2.13) 4 -1.38 (-2.59) -0.88 (-2.42) 5b - Mg -1.21 (-2.22) -0.85 (-2.29) Censored normal regression adjusting for antihypertensive treatment – (N=4,680) Nonhypertensive Persons – (N=3,671) Excluding Persons with High Day-to-day Variability in Nutrient Intake and/or BP – (N=3,473) continued on next page 32 Table S.7. continued, page 5 Phenylalanine Expressed as grams/day (instead of % Total Protein) – (N=4,680) 4 + Total Energy (kJ/day) -0.97 (-1.17) -0.61 (-1.08) 0.95 (1.03) 0.34 (0.54) 4 + Total Energy + Height + Weight -1.49 (-1.88) -0.97 (-1.77) 5b - Mg + Total Energy + Height + Weight -0.75 (-0.85) -0.73 (-1.20) -0.80 (-1.68) -0.53 (-1.62) 0.38 (0.71) -0.0004 (-0.01) 4 + Height + Weight -0.99 (-2.17) -0.64 (-2.05) 5b - Mg + Height + Weight -0.56 (-1.08) -0.58 (-1.62) 5b - Mg + Total Energy (kJ/day) Phenylalanine Expressed as % kJ (instead of % Total Protein) – (N=4,680) 4 5b - Mg continued on next page 33 Table S.7. continued, page 6 Model 4: Controlled for Sample, Age, Gender, Diet (Yes/No), Supplement Intake (Yes/No), CVD-DM Diagnosis (Yes/No), Physical Activity (Medium + Heavy, hours/day), Family History of High BP (Yes, No or Unknown), Urinary Na and Urinary K (mmol/24-h), 14-day Alcohol (grams/day), Cholesterol (mg/1,000 kJ), Total SFA and Total PFA (% kJ) Model 5a-5e, Main Analyses: Controlled for Model 4 variables + each stipulated nutrient (expressed per 1,000 kJ) Sensitivity Analyses: controlled for Model 4 variables + each stipulated variable, or variables in Model 5b - Mg + each stipulated variable Month of field survey: mid-point between first and fourth clinic visit. Season of field survey: Winter = December/January/February; Spring = March/April/May; Summer = June/July/August; Fall = September/October/November Z-value=regression coefficient/standard error; Z-value=regression coefficient/standard error; Z-value ≥1.96: uncorrected p ≤0.05; ≥2.58: uncorrected p ≤0.01; ≥3.29: uncorrected p ≤0.001 2 s.d. higher phenylalanine intake for % Total Protein – 0.35%; for grams/day – 2.16; for % Total Kilocalories – 0.24% *Test for cross-country heterogeneity significant, p <0.05. 34 Table S.8. Estimated Mean Difference in Blood Pressure, Serine Intake (% Total Protein) from Foods Higher by 2 s.d., Multiple Regression Analyses Model Systolic BP Diastolic BP Difference, mm Hg (Z- value) Difference, mm Hg (Z- value) 4 -1.29 (-2.95) -0.85 (-2.87) 5a - P -0.99 (-2.20) -0.66 (-2.18) 5b - Mg -1.18 (-2.67) -0.84 (-2.80) 5c - Ca -0.55 (-1.15) -0.44 (-1.33) 5d - Fe -1.21 (-2.75) -0.82 (-2.73) 5e - Fiber -1.10 (-2.51) -0.77 (-2.56) Main Analyses – All 4,680 Participants continued on next page 35 Table S.8. continued, page 2 Sensitivity Analyses Adjusted also for Education (years), and Current Smoking (yes/no) – N=4,680 4 -1.28 (-2.94) -0.88 (-2.97) 5b - Mg -1.18 (-2.67) -0.88 (-2.92) 4 -1.30 (-2.97) -0.86 (-2.90) 5b - Mg -1.19 (-2.68) -0.85 (-2.81) 4 -1.29 (-2.95) -0.86 (-2.89) 5b - Mg -1.18 (-2.66) -0.84 (-2.81) Adjusted also for Month of Field Survey – N=4,680 Adjusted also for Season of Field Survey – N=4,680 continued on next page 36 Table S.8. continued, page 3 Adjusted also for Total Energy (kJ/day) – (N=4,680) 4 -1.39* (-3.18) -0.87 (-2.91) -1.26 (-2.81) -0.85 (-2.78) 4 -1.13 (-2.58) -0.75 (-2.53) 5b - Mg -1.08 (-2.45) -0.76 (-2.54) 4 -1.14* (-2.39) -0.93 (-2.86) 5b - Mg -0.69 (-1.42) -0.80 (-2.39) 5b - Mg Adjusted for Urinary Na/Creatinine and K/Creatinine Ratio (mmol/mmol) instead of Urinary Na and Urinary K (mmol/24-h) – (N=4,680) Adjusted also for Total Carbohydrate (% kJ) – (N=4,680) continued on next page 37 Table S.8. continued, page 4 Adjusted also for Starch (% kJ) – (N=4,680) 4 -1.14 (-2.52) -0.70 (-2.27) 5b - Mg -1.05 (-2.29) -0.69 (-2.22) 4 -2.01* (-4.03) -1.37 (-4.10) 5b - Mg -1.87* (-3.70) -1.34 (-3.93) -0.50* (-1.35) -0.51 (-1.86) -0.44 (-1.17) -0.53 (-1.89) 4 -1.18 (-2.29) -0.71 (-2.04) 5b - Mg -1.06 (-2.04) -0.72 (-2.04) Censored normal regression adjusting for antihypertensive treatment – (N=4,680) Nonhypertensive Persons – (N=3,671) 4 5b - Mg Excluding Persons with High Day-to-day Variability in Nutrient Intake and/or BP – (N=3,473) continued on next page 38 Table S.8. continued, page 5 Serine Expressed as grams/day (instead of % Total Protein) – (N=4,680) 4 + Total Energy (kJ/day) -1.15 (-1.33) -0.69 (-1.18) 0.90 (0.94) 0.30 (0.46) 4 + Total Energy + Height + Weight -1.46 (-1.79) -0.92 (-1.63) 5b - Mg + Total Energy + Height + Weight -0.68 (-0.74) -0.69 (-1.08) -0.91 (-1.83) -0.60 (-1.76) 0.36 (0.63) -0.05 (-0.14) 4 + Height + Weight -1.00 (-2.11) -0.65 (-1.98) 5b - Mg + Height + Weight -0.54 (-0.99) -0.60 (-1.60) 5b - Mg + Total Energy (kJ/day) Serine Expressed as % kJ (instead of % Total Protein) – (N=4,680) 4 5b - Mg continued on next page 39 Table S.8. continued, page 6 Model 4: Controlled for Sample, Age, Gender, Diet (Yes/No), Supplement Intake (Yes/No), CVD-DM Diagnosis (Yes/No), Physical Activity (Medium + Heavy, hours/day), Family History of High BP (Yes, No or Unknown), Urinary Na and Urinary K (mmol/24-h), 14-day Alcohol (grams/day), Cholesterol (mg/1,000 kJ), Total SFA and Total PFA (% kJ) Model 5a-5e, Main Analyses: Controlled for Model 4 variables + each stipulated nutrient (expressed per 1,000 kJ) Sensitivity Analyses: controlled for Model 4 variables + each stipulated variable, or variables in Model 5b - Mg + each stipulated variable Month of field survey: mid-point between first and fourth clinic visit. Season of field survey: Winter = December/January/February; Spring = March/April/May; Summer = June/July/August; Fall = September/October/November Z-value=regression coefficient/standard error; Z-value=regression coefficient/standard error; Z-value ≥1.96: uncorrected p ≤0.05; ≥2.58: uncorrected p ≤0.01; ≥3.29: uncorrected p ≤0.001 2 s.d. higher serine intake for % Total Protein – 0.45%; for grams/day – 2.20; for % Total Kilocalories – 0.24% *Test for cross-country heterogeneity significant, p <0.05. 40 Table S.9. Sensitivity Analyses: Two Amino Acids Regressed Simultaneously, Model 5b - Mg Amino Acids, Analysis Systolic BP Diastolic BP Difference, mm Hg (Z- value) Difference, mm Hg (Z- value) -2.70 (-2.50) -2.01 (-2.83) 0.27 (0.23) 0.55* (0.72) -3.18 (-2.94) -2.20 (-3.11) 0.91 (0.78) 0.92 (1.20) -2.71 (-2.51) -1.98 (-2.79) 0.26 (0.22) 0.54 (0.70) -2.81 (-2.54) -1.87 (-2.58) 0.30 (0.26) 0.46 (0.59) Glutamic Acid (% Total Protein) -0.97 (-1.08) -1.51 (-2.29) Proline (% Total Protein) -1.11 (-1.18) 0.51 (0.75) Adjusted also for Total Energy (kJ/day) – (N=4,680) Glutamic Acid (% Total Protein) Proline (% Total Protein) Adjusted for Urinary Na/Creatinine and K/Creatinine Ratio (mmol/mmol) – (N=4,680) Glutamic Acid (% Total Protein) Proline (% Total Protein) Adjusted also for Total Carbohydrate (% kJ) – (N=4,680) Glutamic Acid (% Total Protein) Proline (% Total Protein) Adjusted also for Starch (% kJ) – (N=4,680) Glutamic Acid (% Total Protein) Proline (% Total Protein) Nonhypertensive Persons – (N=3,671) continued on next page 41 Table S.9. continued, page 2 Excluding Persons with High Day-to-day Variability in Nutrient Intake/BP – (N=3,473) Glutamic Acid (% Total Protein) -2.82 (-2.11) -1.43 (-1.63) 0.03 (0.02) -0.32 (-0.34) 2.01 (1.01) 0.31 (0.23) Proline + Total Energy (kJ/day) -2.20 (-1.18) -0.51 (-0.41) Glutamic Acid + Energy + Height + Weight -0.24 (-0.13) -1.09 (-0.84) Proline + Energy + Height + Weight -1.20 (-0.67) 0.12 (0.10) 0.39 (0.36) 0.03 (0.04) Proline -0.63 (-0.53) -0.20* (-0.25) Glutamic Acid + Height + Weight -0.61 (-0.58) -0.59 (-0.85) Proline + Height + Weight -0.14 (-0.13) 0.13* Glutamic Acid (% Total Protein) -1.96 (-2.43) -1.25 (-2.34) Phenylalanine (% Total Protein) -0.78 (-1.42) -0.63 (-1.69) Glutamic Acid (% Total Protein) -2.03 (-2.52) -1.21 (-2.26) Phenylalanine (% Total Protein) -0.73 (-1.35) -0.64 (-1.74) Proline (% Total Protein) Amino Acids as g/day – (N=4,680) Glutamic Acid + Energy (kJ/day) Amino Acids as % kJ – (N=4,680) Glutamic Acid (0.17) Adjusted also for Total Energy (kJ/day) – (N=4,680) Adjusted for Urinary Na/Creatinine and K/Creatinine Ratio (mmol/mmol) – (N=4,680) continued on next page 42 Table S.9. continued, page 3 Adjusted also for Total Carbohydrate (% kJ) – (N=4,680) Glutamic Acid (% Total Protein) -2.01 (-2.50) -1.25 (-2.33) Phenylalanine (% Total Protein) -0.72 (-1.30) -0.60 (-1.60) Glutamic Acid (% Total Protein) -2.09 (-2.57) -1.23 (-2.28) Phenylalanine (% Total Protein) -0.74 (-1.33) -0.55 (-1.46) Glutamic Acid (% Total Protein) -1.40 (-2.09) -0.81 (-1.64) Phenylalanine (% Total Protein) 0.18 (0.39) -0.24 (-0.71) Glutamic Acid (% Total Protein) -2.56 (-2.62) -1.29 (-1.98) Phenylalanine (% Total Protein) -0.34 (-0.52) -0.39 (-0.89) -5.53 (-2.57) -3.83 (-2.68) 5.78 (2.56) 4.04 (2.66) Glutamic Acid + Energy + Height + Weight -4.38 (-2.12) -3.04 (-2.28) Phenylalanine + Energy + Height + Weight 2.92 (1.35) 2.14 (1.46) Adjusted also for Starch (% kJ) – (N=4,680) Nonhypertensive Persons – (N=3,671) Excluding Persons with High Day-to-day Variability in Nutrient Intake/BP – (N=3,473) Amino Acids as g/day – (N=4,680) Glutamic Acid + Energy (kJ/day) Phenylalanine + Total Energy (kJ/day) continued on next page 43 Table S.9. continued, page 4 Amino Acids as % kJ – (N=4,680) Glutamic Acid -2.89 (-2.42) -1.70 (-2.14) Phenylalanine 3.22 (2.47) 1.84 (2.08) Glutamic Acid + Height + Weight -2.02 (-1.76) -1.11 (-1.45) Phenylalanine + Height + Weight 1.39 (1.11) 0.64 (0.75) Glutamic Acid (% Total Protein) -2.22 (-2.77) -1.38 (-2.59) Serine (% Total Protein) -0.59 (-1.09) -0.40 (-1.10) Glutamic Acid (% Total Protein) -2.43 (-3.04) -1.41 (-2.67) Serine (% Total Protein) -0.35 (-0.66) -0.31 (-0.85) Glutamic Acid (% Total Protein) -2.28 (-2.85) -1.37 (-2.59) Serine (% Total Protein) -0.53 (-0.98) -0.38 (-1.03) Glutamic Acid (% Total Protein) -2.37 (-2.93) -1.33 (-2.48) Serine (% Total Protein) -0.50 (-0.94) -0.35 (-0.96) Adjusted also for Total Energy (kJ/day) – (N=4,680) Adjusted for Urinary Na/Creatinine and K/Creatinine Ratio (mmol/mmol) – (N=4,680) Adjusted also for Total Carbohydrate (% kJ) – (N=4,680) Adjusted also for Starch (% kJ) – (N=4,680) continued on next page 44 Table S.9. continued, page 5 Nonhypertensive Persons – (N=3,671) Glutamic Acid (% Total Protein) -1.65 (-2.48) -0.93 (-1.90) 0.26 (0.57) -0.07 (-0.22) Glutamic Acid (% Total Protein) -2.78 (-2.86) -1.40 (-2.16) Serine (% Total Protein) -0.13 (-0.21) -0.19 (-0.45) -4.95 (-2.28) -3.66 (-2.54) 5.53 (2.33) 4.03 (2.50) -4.71 (-2.27) -3.43 (-2.48) 3.67 (1.62) 2.76 (1.78) -2.58 (-2.15) -1.51 (-1.88) 3.14 (2.28) 1.70 (1.81) -2.11 (-1.84) -1.18 (-1.52) 1.73 (1.31) 0.77 (0.85) Proline (% Total Protein) -1.00 (-1.13) -0.44 (-0.72) Phenylalanine (% Total Protein) -0.85 (-1.48) -0.69 (-1.76) Serine (% Total Protein) Excluding Persons with High Day-to-day Variability in Nutrient Intake/BP – (N=3,473) Amino Acids as g/day – (N=4,680) Glutamic Acid + Energy (kJ/day) Serine + Total Energy (kJ/day) Glutamic Acid + Energy + Height + Weight Serine + Energy + Height + Weight Amino Acids as % kJ – (N=4,680) Glutamic Acid Serine Glutamic Acid + Height + Weight Serine + Height + Weight Adjusted also for Total Energy (kJ/day) – (N=4,680) continued on next page 45 Table S.9. continued, page 6 Adjusted for Urinary Na/Creatinine and K/Creatinine Ratio (mmol/mmol) – (N=4,680) Proline (% Total Protein) -0.73 (-0.83) -0.21 (-0.35) Phenylalanine (% Total Protein) -0.94 (-1.67) -0.77 (-2.00) Proline (% Total Protein) -1.06 (-1.19) -0.43 (-0.72) Phenylalanine (% Total Protein) -0.77 (-1.34) -0.64 (-1.64) Proline (% Total Protein) -1.07 (-1.20) -0.47 (-0.77) Phenylalanine (% Total Protein) -0.78 (-1.33) -0.55 (-1.38) Proline (% Total Protein) -1.24 (-1.71) -0.08 (-0.14) Phenylalanine (% Total Protein) -0.17 (-0.36) -0.46 (-1.30) Proline (% Total Protein) -1.82 (-1.71) -0.98 (-1.36) Phenylalanine (% Total Protein) -0.31 (-0.46) -0.35 (-0.76) Adjusted also for Total Carbohydrate (% kJ) – (N=4,680) Adjusted also for Starch (% kJ) – (N=4,680) Nonhypertensive Persons – (N=3,671) Excluding Persons with High Day-to-day Variability in Nutrient Intake/BP – (N=3,473) continued on next page 46 Table S.9. continued, page 7 Amino Acids as g/day – (N=4,680) Proline + Energy (kJ/day) -3.00 (-2.24) -1.55* (-1.72) 3.72 (2.51) 2.25 (2.22) -2.27 (-1.77) -1.08* (-1.25) 1.28 (0.90) 0.67 (0.68) -1.47 (-1.68) -0.73* (-1.24) 1.86 (2.15) 1.09 (1.84) -0.96 (-1.14) -0.38* (-0.67) 0.47 (0.56) 0.19 (0.34) Proline (% Total Protein) -1.38 (-1.51) -0.59 (-0.95) Serine (% Total Protein) -0.60 (-1.02) -0.42 (-1.04) Proline (% Total Protein) -1.28 (-1.40) -0.46 (-0.75) Serine (% Total Protein) -0.51 (-0.87) -0.39 (-0.99) Proline (% Total Protein) -1.44 (-1.57) -0.58 (-0.94) Serine (% Total Protein) -0.53 (-0.88) -0.38 (-0.93) Phenylalanine + Total Energy (kJ/day) Proline + Energy + Height + Weight Phenylalanine + Energy + Height + Weight Amino Acids as % kJ – (N=4,680) Proline Phenylalanine Proline + Height + Weight Phenylalanine + Height + Weight Adjusted also for Total Energy (kJ/day) – (N=4,680) Adjusted for Urinary Na/Creatinine and K/Creatinine Ratio (mmol/mmol) – (N=4,680) Adjusted also for Total Carbohydrate (% kJ) – (N=4,680) continued on next page 47 Table S.9. continued, page 8 Adjusted also for Starch (% kJ) – (N=4,680) Proline (% Total Protein) -1.50 (-1.63) -0.61 (-0.98) Serine (% Total Protein) -0.48 (-0.81) -0.30 (-0.75) Proline (% Total Protein) -1.55 (-2.09) -0.15 (-0.28) Serine (% Total Protein) -0.02 (-0.04) -0.28 (-0.76) Proline (% Total Protein) -2.09 (-1.90) -1.00 (-1.34) Serine (% Total Protein) 0.06 (0.08) -0.05 (-0.10) -3.06 (-2.17) -1.59* (-1.68) 4.20 (2.54) 2.63 (2.33) Proline + Energy + Height + Weight -2.54 (-1.88) -1.25* (-1.38) Serine + Energy + Height + Weight 1.95 (1.23) 1.16 (1.07) Proline -1.45 (-1.59) -0.66* (-1.07) Serine 2.14 (2.21) 1.25 (1.88) Proline + Height + Weight -1.03 (-1.17) -0.36* (-0.62) Serine + Height + Weight 0.79 (0.85) 0.38 (0.59) Nonhypertensive Persons – (N=3,671) Excluding Persons with High Day-to-day Variability in Nutrient Intake/BP – (N=3,473) Amino Acids as g/day – (N=4,680) Proline + Energy (kJ/day) Serine + Total Energy (kJ/day) Amino Acids as % kJ – (N=4,680) continued on next page 48 Table S.9. continued, page 9 Adjusted also for Total Energy (kJ/day) – (N=4,680) Phenylalanine (% Total Protein) -1.29 (-1.52) -0.90 (-1.58) Serine (% Total Protein) -0.25 (-0.30) -0.09 (-0.17) -1.65 (-1.94) -1.12 (-1.96) 0.23 (0.27) 0.17 (0.30) Phenylalanine (% Total Protein) -1.28 (-1.50) -0.89 (-1.56) Serine (% Total Protein) -0.24 (-0.28) -0.09 (-0.15) Phenylalanine (% Total Protein) -1.33 (-1.53) -0.79 (-1.35) Serine (% Total Protein) -0.15 (-0.19) -0.10 (-0.18) -0.54 (-0.75) -0.58 (-1.08) 0.16 (0.23) 0.08 (0.16) -1.245 (-1.21) -0.75 (-1.08) -0.17 (-0.17) -0.08 (-0.12) Adjusted for Urinary Na/Creatinine and K/Creatinine Ratio (mmol/mmol) – (N=4,680) Phenylalanine (% Total Protein) Serine (% Total Protein) Adjusted also for Total Carbohydrate (% kJ) – (N=4,680) Adjusted also for Starch (% kJ) – (N=4,680) Nonhypertensive Persons – (N=3,671) Phenylalanine (% Total Protein) Serine (% Total Protein) Excluding Persons with High Day-to-day Variability in Nutrient Intake/BP – (N=3,473) Phenylalanine (% Total Protein) Serine (% Total Protein) continued on next page 49 Table S.9. continued, page 10 Amino Acids as g/day – (N=4,680) Phenylalanine + Energy (kJ/day) 2.91 (0.61) 1.33 (0.41) Serine + Total Energy (kJ/day) -2.41 (-0.48) -1.19 (-0.35) Phenylalanine + Energy + Height + Weight -2.73 (-0.60) -2.28 (-0.73) 1.79 (0.37) 1.50 (0.46) 1.36 (0.50) 1.03 (0.56) Serine -1.21 (-0.42) -1.19 (-0.61) Phenylalanine + Height + Weight -1.28 (-0.49) -0.66 (-0.37) 0.68 (0.22) -0.01 (-0.01) Serine + Energy + Height + Weight Amino Acids as % kJ – (N=4,680) Phenylalanine Serine + Height + Weight Model 5b: Sample, Age, Gender, Special Diet, Supplement Intake, CVD-DM Diagnosis, Physical Activity, Family History of High BP, Urinary Na, Urinary K, 7-Alcohol, Cholesterol, Total SFA, Total PFA, Magnesium Sensitivity Analyses: controlled for Model 5b - Mg + each stipulated variable Z-value=regression coefficient/standard error; Z-value ≥1.96: uncorrected p ≤0.05; ≥2.58: uncorrected p ≤0.01; ≥3.29: uncorrected p ≤0.01 2 s.d. higher glutamic acid intake for % Total Protein – 4.72%; for grams/day – 9.60; for % Total Kilocalories – 1.00% 2 s.d. higher proline intake for % Total Protein – 2.54%; for grams/day – 3.34; for % Total Kilocalories – 0.40% 2 s.d. higher phenylalanine intake for % Total Protein – 0.35%; for grams/day – 2.16; for % Total Kilocalories – 0.24% 2 s.d. higher serine intake for % Total Protein – 0.45%; for grams/day – 2.20; for % Total Kilocalories – 0.24% *Test for cross-country heterogeneity significant, p <0.05. 50 Table S.10. Estimated Mean Difference in Blood Pressure, by Gender, Glutamic Acid Intake (% Total Protein) from Foods Higher by 2 s.d., Multiple Regression Analyses Systolic BP Men (N=2,359) Difference, Diastolic BP Women (N=2,321) Difference, (Z-value) mm Hg Men (N=2,359) Difference, (Z-value) mm Hg Women (N=2,321) Difference, (Z-value) mm Hg (Z-value) mm Hg 1 -2.06* (-2.56) -3.98 (-4.55) -1.10 (-1.98) -1.83 (-3.31) 2 -2.01* (-2.52) -3.43 (-3.97) -1.13 (-2.04) -1.77 (-3.21) 3 -0.82 (-1.01) -3.01 (-3.49) -0.54 (-0.96) -1.51 (-2.73) 4 -1.19 (-1.30) -2.29 (-2.41) -1.03 (-1.62) -1.34 (-2.20) 5a - P -1.82 (-1.94) -2.50 (-2.54) -1.39 (-2.11) -1.51 (-2.39) 5b - Mg -2.00 (-2.11) -2.45 (-2.47) -1.56 (-2.33) -1.66 (-2.60) 5c - Ca -0.79 (-0.85) -1.76 (-1.81) -0.95 (-1.45) -0.99 (-1.58) 5d - Fe -1.17 (-1.27) -1.85 (-1.92) -1.02 (-1.59) -1.19 (-1.92) 5e - Fiber -1.12 (-1.20) -2.15 (-2.23) -1.04 (-1.59) -1.29 (-2.08) 51 Model 1: Controlled for Sample, Age Model 2: Model 1 Variables + Special Diet (Yes/No), Supplement Intake (Yes/No), CVD-DM Diagnosis (Yes/No), Physical Activity (Medium + Heavy, hours/day), Family History of High BP (Yes, No or Unknown) Model 3: Model 2 Variables + Urinary Na and Urinary K (mmol/24-h), 14-day Alcohol (grams/day) Model 4: Model 3 Variables + Cholesterol (mg/1,000 kJ), Total SFA and Total PFA (% kJ) Model 5a-5e: Controlled for Model 4 variables + each stipulated nutrient (expressed per 1,000 kJ) Z-value = regression coefficient/standard error; Z-value ≥1.96: uncorrected p ≤0.05; ≥2.58: uncorrected p ≤0.01; ≥3.29: uncorrected p ≤0.001 2 s.d. higher glutamic acid intake 4.72 % Total Protein *Test for cross-country heterogeneity significant, p <0.05. 52 Table S.11. Estimated Mean Difference in Blood Pressure, by Age Group (40-49 and 50-59 years), Glutamic Acid Intake (% Total Protein) from Foods Higher by 2 s.d., Multiple Regression Analyses Systolic BP 40-49 years (N=2,365) Difference, Diastolic BP 50-59 years (N=2,315) Difference, (Z-value) mm Hg 40-49 years (N=2,365) Difference, (Z-value) mm Hg 50-59 years (N=2,315) Difference, (Z-value) mm Hg (Z-value) mm Hg 1 -3.19 (-4.13) -2.93 (-3.24) -1.65 (-3.04) -1.24 (-2.21) 2 -3.08 (-4.01) -2.58 (-2.87) -1.55 (-2.86) -1.33 (-2.35) 3 -2.27 (-2.91) -1.99 (-2.21) -1.06 (-1.94) -1.07 (-1.87) 4 -1.67 (-1.94) -2.25 (-2.22) -0.86 (-1.42) -1.70 (-2.67) 5a - P -2.00 (-2.26) -2.88 (-2.76) -0.99 (-1.57) -2.17 (-3.29) 5b - Mg -2.21 (-2.47) -2.79 (-2.65) -1.15 (-1.81) -2.26 (-3.38) 5c - Ca -1.07 (-1.22) -2.08 (-2.01) -0.60 (-0.96) -1.60 (-2.44) 5d - Fe -1.61 (-1.85) -2.13 (-2.07) -0.81 (-1.32) -1.66 (-2.57) 5e - Fiber -1.41 (-1.61) -2.48 (-2.41) -0.67 (-1.09) -1.93 (-2.96) 53 Model 1: Controlled for Sample, Gender Model 2: Model 1 Variables + Special Diet (Yes/No), Supplement Intake (Yes/No), CVD-DM Diagnosis (Yes/No), Physical Activity (Medium + Heavy, hours/day), Family History of High BP (Yes, No or Unknown) Model 3: Model 2 Variables + Urinary Na and Urinary K (mmol/24-h), 14-day Alcohol (grams/day) Model 4: Model 3 Variables + Cholesterol (mg/1,000 kJ), Total SFA and Total PFA (% kJ) Model 5a-5e: Controlled for Model 4 variables + each stipulated nutrient (expressed per 1,000 kJ) Z-value = regression coefficient/standard error; Z-value ≥1.96: uncorrected p ≤0.05; ≥2.58: uncorrected p ≤0.01; ≥3.29: uncorrected p ≤0.001 2 s.d. higher glutamic acid intake 4.72 % Total Protein No significant cross-country heterogeneity detected 54
© Copyright 2026 Paperzz