V ol . 9 9 ( 1901)
A CT A P HY SIC A P O LO NIC A A
No . 3{ 4
P roceed in gs of t h e 32n d Po li sh Sem in ar on Po sit ron An n i hi la t io n, Ja rn o¤t §w ek 200 0
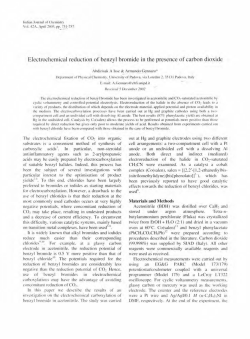
SU RFA CE S OF ELE CTR ON -E M I TTI N G GLA SSES
STU D I E D B Y A SLO W P OSI TR ON BE A M
D . P l i szk a a , M. Ga z da b , B. K u szb , K. T r zebia t o wski b , G.P . Ka r w asz c ,
W. De n g c , R. S. Br u sa c a nd A . Z ecc a c
a
Inst it ut e of Ph ysics, Pedagogical U ni versity
A rciszew skiego 22B, 76-200 S¤upsk, Poland
b
Faculty of T echnical Physics and A pplied Mathe matics, T echnical U niversity
N arutow icza 11/12, 80-952 Gda ¥sk, Poland
c
Istituto N azionale p er la Fisica della Materia, U nita ' di T rento, 38-050 Po vo, Italy
Semi- conducti ng glasses used for electron multipli ers and micro channel plate devices are obtained by surf ace mo di Ùcation of Pb or Bi- reach
silicon -based glasses. T he reduced layer extends dow n to 200{500 nm, much
more than the e˜ective depth of the electron- emittin g layer. By the use
of slow -positron beam w e monitor the structural
changes undergoing in
near- to- surf ace layers after isothermal annealing . T he measurements suggest a possibl e correlation betw een secondary- electron emission coe£cient
and the Doppler- bro aden in g S - parameter. On these samples there w ere also
p erformed atomic force microscopy , secondary electron emission, di˜erential
scanning calorimetry , and electric conductivity measurements.
PACS numb ers: 71. 60. + z, 78. 70. Bj
1. I n t r o d u ct io n
Sem i con ducti ng gl asses, mo di Ùed on sur face, usual l y sil i cate gl assesconta i n i ng l ead, bi smut h or anti mony, are the most com m on m ateri a l used i n el ectro n
m ulti pl ier devi ces. The use of gl asses, whi ch rema in i solato rs i n bul k, sim pl i Ùes
and reduces di mensions of these devi ces. The heat trea tm ent i n hydro gen atm osphere brea ks oxyg en{ meta l i on b onds i n the near- to- surf ace l ayers. As a resul t
di spersed ato m s ( Pb, Bi or Sb) app ear i n the surf ace lay er of the gl ass.
Mo st comm onl y used are l ead- ba sed gl asses in whi ch the reduced, semi- conducti ng layer extends do wn to 5 ñ m. The l ayer enri ched wi th hydro gen ato ms
extends to the 200{ 500 nm depth. On the other ha nd, onl y the very Ùrst l ayer,
whi ch i s sil i ca ri ch and extends down to 20{ 50 nm i s acti ve for seconda ry el ectro n
emi ssion [1]. The gl ass surf ace after the trea tm ent i s bl ack due to the di spersed Pb
pa rti cl es. However, the exact chem ical com p ositi on and the m orpho l ogic structure
of these l ayers i s sti l l not f ul l y understo od [1].
(4 65)
466
D. Pl i szka et al .
The seconda ry emission pro p erti es dep end on the tem pera ture, ti m e and
al so the atm osphere com p ositi on in whi ch the trea tm ent i s done [2]. The emi ssio n
pro perti es are al so subj ect to agi ng, i n pa rti cul ar if the detecto rs are used to
reveal ato m s and i ons. It has b een empi ri cal l y ascertai n tha t pro l ong ed reducti on
ti m es i m pro ve agi ng pro p erti es no t changi ng m uch the i ni ti al emi ssion yi el d but
the rea son for thi s beha vi our i s no t kno wn. The ai m of the present pa p er i s to
check i f surf ace m odi Ùcati ons of the conducti ng gl asses can be moni tored by the
depth- resol ved p ositro n a nni hi l ati o n spectro scopy (P AS). G l ass sampl esha ve b een
chara cteri zed by measurem ents of el ectri cal conducti vi ty i n bul k and on surf ace,
by seconda ry electro n- emission m easurem ents, by cal ori metry , and by ato m ic force
m i croscopy.
2. P r ep ar at io n o f t h e sa m p l es
Two ki nds of electro n emi tti ng gl asses ha ve b een studi ed: the Ùrst one
sil i ca{ bi smuth gl asses, wi th 30Bi 2 O 3 Â 7 0 SiO 2 m ol ar sto i chiom etry , the second one
sil i ca{ l ead gl ass 40PbO Â 6 0 SiO 2 . Lead gl assesha ve b een obta i ned by di rect m elti ng
of oxi des, i n two sta ges, the Ùnal o ne at 1 2 5 0 C.
The bi smuth sampl es were melted fro m Si O2 and bi sm uth ni tra te
4Bi NO 3 (OH) 2 Â Bi OH (the use of Bi 2 O 3 l eads to crysta l l i sati on and pha se separa ti on duri ng cool i ng). The gro und com ponents were accura te crum bled and prel i m ina ry heated at 7 5 0 C to obta i n the cohesion of the gra i ns and pre- form ing
of Bi { O{ Si b ounds. The obta i ned ceram al was m i lled once agai n and melted at
1 2 5 0 C for abo ut 1 h. D uri ng m elti ng an i ntensi ve out- gassing (ni tro gen oxi des,
wa ter vap our) wa s observed. Sol i di Ùedgl asseswere then anneal ed for 3 h at 3 5 0 C.
X- ra y di ˜ra cti on anal ysi s di d not reveal any crysta l l i ne pha se i n the obta i ned m ateri al .
For bi smuth- gl ass sampl es the i sotherm al ( 3 0 0 C) reducti on was p erform ed
i n hydro g en atm osphere for ti m es up to 90 ho urs. Four l ead- gl ass sam pl es the
reducti on tem perature wa s 4 0 0 C wi th ti m es up to 55 h.
£
£
£
£
£
£
3 . Sam p l e m at er i al p r o p er t ies
3.1. El ect r i cal conduct i vit y
The electri cal conducti vi ty of (no n- reduced) 30Bi 2 O 3 Â 7 0 SiO 2 gl ass i n bul k
ha s been measured b etween 5 0 0 C and 7 0 0 C: at 5 0 0 C i t is i n the 1 0 1 2 ( ¨ m) 1
ra ng e. The dep endence of the electri c conducti vi ty on tem p erature i n semi -l og
scale vs. 1 = T (Arrheni us pl ot) shows a l i near dependence. Fro m the dependence
¥ = ¥ 0 exp ( À E = k T ) one can obta i ned the acti va tio n energy f or Bi { Si gl ass,
E = 1 : 3 3 eV.
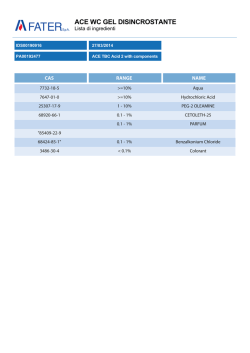
The surf ace electri cal conducti vi ty f or reduced bi smuth sam pl es i s shown i n
Fi g. 1. We can di sti ngui sh three pha ses duri ng sampl es reducti on. D uri ng pha se I
1
the surf ace conducti vi ty ri ses fro m 1 È 1 0 1 2 to 1 È 1 0 1 1 (¨)
j ust after the Ùrst
30 m i n and then rem ai ns al most consta nt up to 1.5 h of annea l i ng ti me. These
val ues are typi cal for the conducti vi ty m echani sm due to i sol ated defects. W hi le
£
£
À
£
À
À
À
À
Sur faces of El ect r on- Emi tti ng Gl asses . .
.
467
Fig. 1. Surf ace conductivi ty of reduced bismuth- glass samples vs. time of treatment
( 3 00 C reduction temp erature ).
£
conti nui ng the reducti on between 2 and 5 hours (pha se I I) the annea l ing of the
surf ace conducti vi ty ri ses by 5{ 6 orders of ma gni tude, i ndi cati ng the form ati on of
p ercola ti on pa ths. The further annea li ng ab ove 6 h causes onl y a sli ght m odi Ùcati on of the surf ace electri c conducti vi ty (pha se I II) caused by a slow gro wi ng of
the reduced lay er.
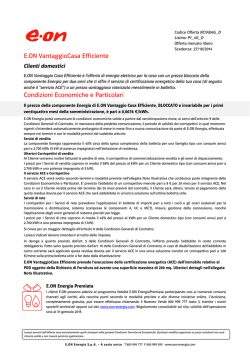
3.2. Secondar y emi ssion coe£ cient
The seconda ry emi ssion coe£ cient has b een m easured by the dc m etho d; for
thi s reason no measurem ents f or non- reduced sampl es were do ne. The results for
bi smuth sampl es are shown i n Fi g. 2. Fo r al l three sampl es the coe£ cient chang es
Fig. 2.
Secondary emission coe£cient
of bismuth- glass samples.
468
D. Pl i szka et al .
fro m 1.3 to 2.8 for the pri m ary electro n energy ri sing fro m 100 to 500 eV. For the
sam pl e reduced for 3 h 20 m i n a sli ght fal l of the emission coe£ cient i s observed at
400{ 5 00 eV. Thi s coul d suggest a non- su£ cient depth o f the acti ve l ayer obta ined
duri ng reducti on.
G eneral l y, the seconda ry emi ssion coe£ cient dep ends weakl y on the reducti on ti m es: i ts m aximum val ue chang es fro m 2.5 after short (3 h 20 mi n) trea tm ent
to 2.9 after pro l onged reducti on ti me. Thi s maxi mum shifts gra dua l l y to hi gher
i nci dent energi es, but al so thi s dep endence i s weak.
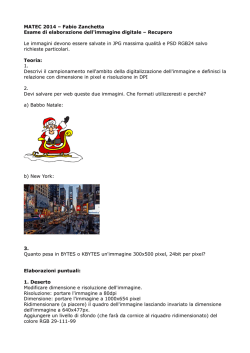
3.3. Di ˜erent i al scanni ng cal or i met r y
The di ˜erenti al scanni ng cal ori m etry (D SC) ha s been p erform ed f or three
bi smuth- gla ss sam pl es: as-obta i ned, reduced for 72 h at 3 0 0 C and reduced and
then annea led under vacuum at 4 0 0 C for 5 h, seeFi g. 3. The tem p erature ra ng e of
m easurem ents spans fro m À 1 0 0 C to 6 0 0 C wi th the heati ng speed of 1 0 C/ m i n.
The curve for the as-gro wn sampl e (A) shows onl y one m aximum due to the one
pha se tra nsiti on of the gl ass at 4 8 5 C.
£
£
£
£
£
£
Fig. 3.
Di˜erential
scanning calorimetry
of Bi{Si
glasses.
The curve for the reduced sampl e (B) shows a sharp p eak at 2 7 0 C. Thi s p eak
can be rel ated to the m elti ng of surf ace dro pl ets of bi sm uth. A l arg e maxi mum
extendi ng fro m 100 to 2 0 0 C i s pro ba bl y due to the m elti ng of Bi clusters of
di ˜erent di m ensions insi de the gl ass. A l arg e wi dth of thi s m axi mum i s caused by
di spersion of clusters di am eters.
For the gl ass reduced and then anneal ed (sam pl e C) there i s no sharp p eak at
2 7 0 C. Pro ba bl y, the surf ace Bi dro pl ets evap ora te duri ng the heati ng , they di ˜use
i nside the materi al or change thei r chem i cal comp ositi on. The l arg e maxi mum
observed at 1 8 0 C i n the reduced sampl es no w shi fts to ab out 2 3 0 C. Thi s i s
caused by i ncreasing numb er of l arg er clusters of Bi at the cost of smal l er ones.
£
£
£
£
£
Sur faces of El ect r on- Emi tti ng Gl asses . .
.
469
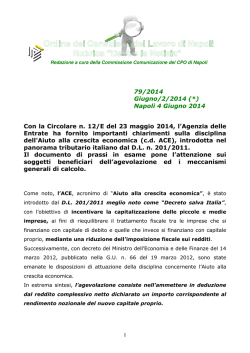
3.4. A tomi c force mi croscopy
Ato mic fo rce mi croscopy perf orm ed on the sampl esreduced at sta nda rd tem p eratures ( 3 0 0 C for Bi and 4 0 0 C for Pb gl asses) do es not show any di ˜erence
wi th as-obta i ned sam pl es. In order to evidence the di ˜erence, we perf orm ed an
annea l i ng at 5 8 0 C. Such a pro cedure causes the gra nul es to gro w b ecause the
annea l i ng tem p eratures exceed bi sm uth m elti ng p oi nt. Indeed, as can b e seen i n
Fi g. 4, i n the reg io n b etween 100 nm and 1500 nm b eneath the surf ace, l arg e gra nul es can b e easil y seen. No tra ces of such m etal l i c granul ates were observed on the
surf ace of as-gro wn gl ass; i n these sam pl es the surf ace ro ughness (a few nm ) i s
caused by the pro cess of pol i shing .
£
£
£
Fig. 4. A FM images of the Bi{Si glass sample ; (a) freshly broken sample, (b) the same
part of the sample after anneali ng at 5 80 C for 21 h.
£
4 . P o sit ro n sp ect r o sco p y
4.1. E xper i ment al pro cedur e
Four Bi - gl ass (a s-grown, reduced for 3 h 20 mi n, 25 h and 91 h) and two
Pb- gl ass (a s-gro wn and reduced for 21 h) sam pl es were chosen for the present
p ositro n study .
Po sitro n anni hi l ati on m easurem ents were perf orm ed by the D oppl er-bro adeni ng techni que [3]. A hi gh puri ty germani um detecto r of 26% e£ ciency was used to
detect the anni hi l ati on ra di ati on; the resoluti on of thi s detecto r at 511 keV l i ne
wa s 1.2 keV.
470
D. Pl i szka et al .
A slow p ositro n b eam wi th energy vari abl e between 50 eV and 25 keV was
obta i ned by m odera ti ng p ositro ns fro m a 4 mCi 2 2Na Cl ra di oacti ve source i n a
1 ñ m thi ck sing l e crysta l tung sten foi l . Al l b eam ha ndl i ng has been obta i ned by
el ectro sta ti c focussing . Deta il s ab out the appa ra tus and the m easurem ents are
rep orted i n R efs. [3, 4].
The shap e of the 511 keV anni hi l ati on l i ne ha s b een chara cteri sed by the
S pa ra meter. The S pa ra meter was cal cul ated as the ra ti o of the counts i n the
centra l area of the peak ( j 5 1 1 keV À E Û j ç 0 :8 5 keV) and the to ta l area of the p eak
( j 5 1 1 keV À E Û j ç 4 : 2 5 keV). The S pa ram eter was m easured as a functi on of the
p ositro n i mpl anta ti on energy i n the 0.15{ 20 keV energy ra ng e. The i m pl anta ti on
depth (i n ¡A) ha s b een obta i ned fro m the energy using the form ul a: d = (4 0 0 = £ ) E 1 : 4
wi th E b eing the b eam energy and £ | the gl ass density (5 .8 g/ cm 3 and 5.46 g/ cm3
for Bi and Pb- gl asses, respecti vel y).
4.2. Bul k prop ert i es
The S -pa ram eter m easurem ents i ndi cate a substa nti al di ˜erence between
as-received and reduced gl asses wi th l ittl e dep endence on the chem ical comp ositi on. Bo th the Bi and Pb non- reduced sam pl es show a bul k S -pa ram eter val ue of
ab out 0.49 compa red to a bul k val ue of 0.53{ 0.54 for the reduced sampl es. The
S -pa ra meter val ue of 0.49 is close to the l i tera ture va lue for the no n- defected Si O2
gl ass [5] i f we al l ow for the ab ove gi ven val ues of the S -pa ra meter wi ndo w.
Fig. 5.
Doppler broadening
S
- parameter for Bi{Si glasses.
The S -pa ram eter at 5 00 nm depth sta rts to increa se onl y after lo ng reducti on ti m es (ab o ve 10 h), see Fi g. 5. W i th a reducti on ti m e of 3 h, onl y the Ùrst
20- nm -l ayer shows a n increa se i n the S -pa ra meter. The ri se fro m 0.49 to 0.53
shoul d be a ttri buted to the form atio n of m etal clusters and/ or precipi ta tes and/ or
defects rel a ted to these aggl om erates. The exi stence of m etal clusters i s i ndi cated
by other m easurem ents i n thi s pap er.
Sur faces of El ect r on- Emi tti ng Gl asses . .
.
471
4.3. Near -t o-sur face l ayers
Al so the surf ace pro p erti es of the Bi and Pb glasses show clear simi la ri ties.
In non- reduced sam pl es the S -pa ra meter fal l s qui ckl y i n the Ùrst 30 nm of depth,
see Fi g. 6.
Fig. 6.
Doppler broadening
S
- parameter dependence for Pb{Si glasses.
In al l reduced sam pl es the S - para m eter ri ses wi th the i m pl anta ti on ra nge
for the Ùrst 20{ 30 nm depth, i ndep endentl y on the chem i cal com p ositi on. Thi s
pi cture resembl es the typi cal b ehavi our of the S - curves for m etal s, wi th surf ace
p ositro n-tra ppi ng sta tes. Note tha t, even af ter the shortest (3 h 20 mi n) trea tm ent
ti m es, the sampl es show a surf ace conducti vi ty al ready 6 orders of magni tude
hi gher tha n the as-obta i ned gl asses.
In the l im i t of zero i mpl anta ti on energy the S -pa ra meter of al l studi ed
sam pl es show the sam e (wi thi n the erro r ba r) S - para m eter of about 0.515, i ndep endentl y on the reducti on pro cedure. Thi s coul d b e rel ated to the form ati on of positro ni um on the surf ace. W e ha ve al so m oni to red the V -pa ra meter
(p eak- to -val l ey) ra ti o chara cteri sti c of the 3 À Û decay. The V -pa ra meter fal l s
qui ckl y for i mpl anta ti on energi es fro m 50 eV to 1 keV, by a facto r of two for
Bi - glasses and by a facto r of four for Pb- gl asses.
4.4. Int er medi ate l ayers
As far as the Bi sam pl e reduced for 3 h 20 m i n and the Pb sam pl e reduced
for 21 h show a m ono to ni c dependence of the S -pa ra meter b etween 20 nm and the
500 nm depth, the Bi sam pl es reduced for 25 h and 91 h show a mi ni mum of the
S -pa ra meter at ab out 40 nm depth. The rea son for such b ehavi uo r i s no t clear.
One can hyp othesi ze a parti al Ùll i ng of the defect sites by hydro gen ato ms i n thi s
reg ion. However, in order to veri fy thi s hyp othesi s, addi ti onal measurem ents on
sam pl es degassed in vacuum are pl anned.
472
D. Pl i szka et al .
Ac kn owl ed gm en t s
Thi s wo rk wa s supported i n pa rt by the Com mi ttee for Scienti Ùc Research
(Po l and), g rant no. 7 TO8 D 027 19 and INFM (Ita l y) p ost- do c gra nt (W .D .).
R ef er en ces
[1] A .M. T hen, C .G. Pantano, J . N on-C r yst. Soli ds 120 , 178 (1990).
[2 ] K . T rzebiatow ski, A . Witkow ska, M. C hybicki, Po li sh Cerami c B ull eti n 19, 157
(1998).
[3 ] A . Zecca, M. Bettonte, J. Paridaens, G.P. K arw asz, R. S. Brusa, Mea s. Sci . T echnol. 9, 409 (1998).
[4] R. S. Brusa, G.P. K arw asz, N . T iengo, A . Zecca, F. Corni, G. O tta viani , R. T onini,
Ph ys. R ev. B 61, 10154 (2000).
[5] P. A shok a-K umar, K .G. Lynn, D. O. W elch, J. A ppl. Ph y s. 76, 4935 (1994).
© Copyright 2026 Paperzz