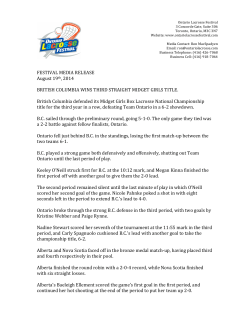
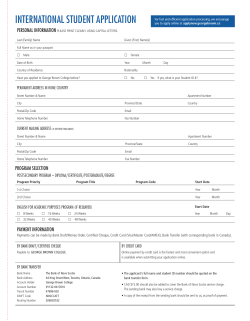
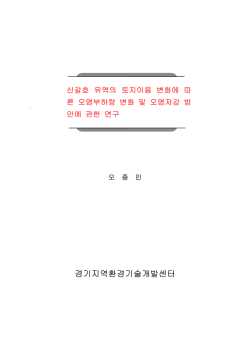
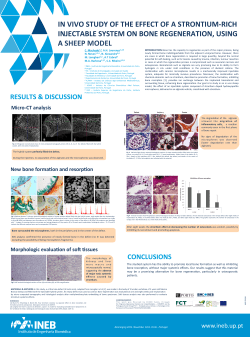
Leveraging Cl-H Mass Defect Plots for the Identification of Halogenated Organic Contaminants Jonathan D. Byer1, Mehran Alaee2, Karl Jobst3, Grazina Pacepavicius2, and Joe Binkley1 1LECO Corporation, St Joseph, MI, USA; 2Environment Canada, Burlington, ON, Canada; 3Ontario Ministry of the Environment, Etobicoke, Canada Results Introduction a a Time (s) Cl-H Mass Defect • Time-of-flight mass spectrometry (TOFMS) is unsurpassed for non-target analysis because full range mass spectra are acquired simultaneously with minimal mass bias at acquisition rates suitable for narrow gas chromatographic peaks. This provides a number of advantages, including the possibility of deconvolving chromatographic interferences using modern software, further enhancing the ability to isolate and identify a greater number of compounds. • Mass defect is the difference between the nominal and exact masses of a compound or its fragments1. • Halogenated compounds have characteristic mass defects and isotope patterns that make them readily distinguishable from most other compound classes2,3. • Mass defect (Cl-H) can be calculated according to the following equations, where the IUPAC mass is the observed mass and the scaling factor for chlorine substituted for hydrogen equals 34/33.960479: 613.59943 PCTs Dieldrin and DDT breakdown products methoxy nonachlorodiphenyl ether PCDEs / PCHBs Fenclorim HCB Fenclorim Caliper - sample "LO No PFTBA", 937.693 s - ( 1172.32 s + 936.321 s ), Height (Abundance) 600 400 355.06977 50 75 125 100 150 175 224 200 225 1650 1660 XIC(457.7369±0.0005) XIC(507.7293±0.0005) 1670 XIC(459.7348±0.0005) XIC(509.7282±0.0005) 1680 1690 XIC(461.7311±0.0005) XIC(511.7238±0.0005) 459.73479 b 100 0 M/Z 100 200 300 400 500 c 510 Cl Cl 459 Cl Cl Cl Cl 50 O O 100 117 130 Cl Cl 500 600 700 800 Figure 1: (a) Total ion chromatogram and (b) combined mass spectrum of a pooled eel sample from Lake Ontario, Canada. The combined mass spectrum was generated by expanding the caliper over the entire chromatographic run, which was dominated by ions corresponding to siloxanes and hydrocarbons. More than 900 peaks were identified using high resolution deconvolution in the ChromaTOF-HRT software. 0 240 220 200 180 160 140 120 (wr10) Benzene, pentachloro(2,3,4,5-tetrachloro-6-methoxyphenoxy)- 260 613.59872 390.81026 236.84047 250.85602 260.87273 271.80917 426.76896 255.77592 272.84052 350 400 280 300 320 340 360 380 166 49 60 71 95 107 400 437 420 440 380 Cl Cl Cl Cl Cl 238 460 480 500 273 Cl 131 4 343 201 212 200 220 261 240 260 Mass Accuracy Mass Defect Mass Formula (ppm) (Da) 375.7508 C8Cl8 1.288 -0.2492 377.7475 C8Cl7[37]Cl 0.434 -0.2525 379.7445 C8Cl6[37]Cl2 0.224 -0.2555 381.7408 C8Cl5[37]Cl3 -1.524 -0.2592 383.7384 C8Cl4[37]Cl4 -0.151 -0.2616 280 300 SMD (Cl-H) 0.18195 0.18098 0.18024 0.17891 0.17878 320 340 360 380 Scaled Mass (Cl-H) RDBE 376.182 5 378.181 5 380.1802 5 382.1789 5 384.1788 5 400 5 A number of legacy contaminants such as polychlorinated biphenyls (PCBs), polybrominated diphenyl ethers (PBDEs), polychlorinated diphenyl ethers (PCDEs), dieldrin, mirex, hexachlorobenzene (HCB) and other pesticides, as well as a number of previously unknown compounds were tentively identified in the pooled sample. Many breakdown products and metabolites were also detected such as DDD, DDE, and methoxy nonachlorodiphenyl ether. Cl-H mass defect plots are a useful tool for filtering through complex data for the identification of halogenated contaminants. This technique functions as a screening tool for the identification of unknowns, and in the future, may be used as a form of fingerprinting to compare samples. References 229 215 395 0 300 Conclusions 439.78861 394.77248 217.86667 167.37599 125.35249 138.27276 103.07529 43.09827 55.14926 69.20698 82.07315 300 3 Figure 6: Workflow for the identification of compounds using Cl-H mass defect plot. (1) Select and display masses of interest on chromatogram; (2) select peak; (3) deconvoluted mass spectrum; (4) compare to NIST or other library database; (5) verify correct chemical formula with accurate mass data. 1700 509.72816 1640 Cl 400 84 153 104 M/Z 200 429.08863 281.05100 295.10317 207.03230 221.08423 147.06545 71.08542 83.08545 111.11677 43.05426 2500 250 308 40 60 80 100 120 140 160 180 (mainlib) Benzene, pentachloro(trichloroethenyl)- a 2250 200 150 118 N 100 300 100 50 Figure 3: Extracted ion chromatograms, mass spectrum, and library spectrum of fenclorim, a herbicide safener used to protect crops against damage caused by pretilachlor. It is typically used on . rice, so its occurrence in Lake Ontario fish was unexpected. b 200 300 379.74447 Cl 165 100 400 0 200 400 M/Z 500 N Cl 1300 XIC(342.7778±0.0005) 342.77783 100 189 400 500 200 600 M/Z Cl 600 600 300 700 154 800 1250 307.80963 Cl 1000 0 XIC(309.8066±0.0005) XIC(379.7445±0.0005) 1200 0 Library Hit - Similarity: 784 - Library: mainlib - Fenclorim, Abundance 950 960 XIC(189.0212±0.0005) XIC(223.9903±0.0005) 1150 100 153.04438 57.14363 100.21894 105.34317 800 223.99016 1100 Caliper - sample "LO No PFTBA", 1108.97 s - ( 1113.31 s + 1105.9 s ), Height (Counts) 200 1000 700 400 XIC(307.8096±0.0005) XIC(344.7756±0.0005) 650 189.02118 1050 237.87193 550 1000 191.83185 450 800 500 950 159.85981 m/z 350 250 940 420 400 380 340 360 Scaled m/z (Cl-H) 2 900 600 320 Chlorinated styrene fragments C8H 6-nCln•+ (n = 2 - 6) 1000 700 300 280 Caliper - sample "LO No PFTBA", 1662.69 s - ( 1666.61 s + 1658.03 s ), Height (Abundance) 800 202.87947 215.88724 0.12 Time (s) Time (s) 900 179.95666 0.14 a 2000 1 0.16 0 930 920 XIC(153.0446±0.0005) XIC(191.0185±0.0005) XIC(225.9877±0.0005) 600 0.18 Figure 2: (a) Cl-H mass defect plot of the raw mass spectral data for a pooled Lake Ontario eel sample. (b) A zoomed-in view of the Cl-H mass defect plot highlighting the region containing halogenated species. The colored points represent m/z values with elemental compositions including Cl and/or Br calculated with a mass accuracy <2 ppm. The masses displayed in b were filtered from a by mass defect, and also required at least two masses to occur within 1.9965 ±0.0005 Da or 1.9974 ±0.0005 Da, corresponding to the mass difference between 37Cl -35Cl and 81Br -79Br, respectively. Time (s) 500 0.20 C7H 3Br3Cl+ 200 • A total of 10 large freshwater eels were collected from eastern Lake Ontario, Canada in 2008. • Sample extracts were pooled for instrumental analysis on a LECO Pegasus GC-HRT, high resolution TOFMS. • Extracts were injected (1 µL) using an Agilent 7693 autosampler attached to a 7890 GC fitted with a multi-mode inlet operated in solvent vent mode. • A Restek Rxi-guard column (5 m x 0.25 mm) with a Rxi-5MS (30 m x 0.25 mm x 0.25 µm) was used for chromatographic separation. • The oven program was initially 90oC (held for 2.4 min) then ramped to 320oC at 8.5oC/min (held for 15 min). • The HRT was operated in EI mode with filament energy of 36 eV, a mass range from m/z 35 to 850, and an acquisition rate of 6 spectra/s. • Data were processed using ChromaTOF-HRT® software, which included peak finding with mass spectral deconvolution. 400 0.22 127.88753 0.05 150 LECO Pegasus® GC-HRT 300 C5H 6-nCln•+ (n = 4 - 6) C5H 5-nCln+ (n = 3 - 5) Analysis Cl 0.24 Hepta/Octachlorostyrene C10H 6-nCln•+ (n = 3 - 5) 0.1 1:1 DCM:Hexane (v/v) Gel Permeation Chromatography Cl 200 95.91560 101.09589 Clean-up Cl 0.26 Photomirex Nonachlor Chlordane Mirex C8H 5Br3•+ PCB fragments Cl 0.28 PCBs 0.15 Cl Caliper - sample "LO No PFTBA", 310 s to 2653.16 s PBDEs 0.2 Cl Br3 65.93924 Cl-H Mass Defect DDE 0.25 Methylene chloride (DCM) c Standard Figure 5: (a) XIC of an unknown in Lake Ontario pooled eel sample and an analogue of Dechlorane 6043. (b) Mass spectrum of the unknown in the Lake Ontario pooled sample. (c) Mass spectrum of a Dec-604 analogue standard. 0.35 Extraction 362.74218 1000 900 800 700 600 500 400 300 200 100 0 M/Z m/z Siloxanes 0.3 1000 b C7H3Br3Cl+ C13H5Br3Cl6• + b Homogenization 1610 Normalized(XIC(339.7915±0.0005)) Lake Ontario Pooled Eel Normalized(XIC(339.7915±0.0005)) Dec 604 Standard Caliper - sample "Dec 604 Standard", 1577.83 s - ( 1581.83 s + 1573.83 s ), Height (Abundance) Methods 57.06989 1600 C5Cl5 + 0.4 1750 1590 unassigned In this study we used non-target analysis in the form of Cl-H mass defect plots, to identify halogenated contaminants in eels (Anguillia rostrata) from Lake Ontario, Canada. 1500 TIC 1580 Lake Ontario Pooled Eel Cl-H Mass Defect = Cl-H Scaled Mass – Nominal Cl-H Scaled Mass 1250 1570 C8H5Br3 • + Cl-H Scaled Mass = IUPAC Mass × Scaling Factor Time- (s) 1000 Caliper sample "LO500 No PFTBA",750 Height (Abundance) 1560 520 Figure 4: (a) Extracted ion chromatgrams (XIC) for the six most abundant ions, as well as (b) the mass spectrum of a peak discovered from points on the mass defect plot, and (c) Wiley 10 library mass spectrum of 6-methoxynonachlorodiphenyl ether. The accurate mass data and the library hit suggest that the unknown compound is a methoxynonachlorodiphenyl ether. 1. Sleno L. (2012); J Mass Spectrom. 47(2): 226-36 2. Taguchi VY, Nieckarz RJ, Clement RE, Krolik S, Williams R. (2010); JASMS. 21(11): 1918-21 3. Jobst KJ, Shen L, Reiner EJ, Taguchi VY, Helm PA, McCrindle R, Backus S. (2013); Anal Bioanal Chem. 405: 3289-97 4. Byer JD, Lebeuf M, Alaee M, Brown RS, Trottier S, Backus S, Keir M, Couillard CM, Casselman J, Hodson PV. (2013); Chemosphere. 90(5): 1719-28 Contact Information: [email protected]
© Copyright 2026 Paperzz