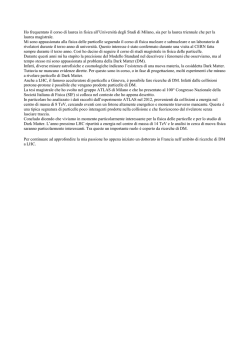
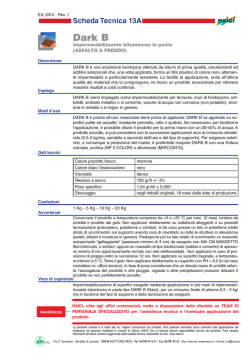
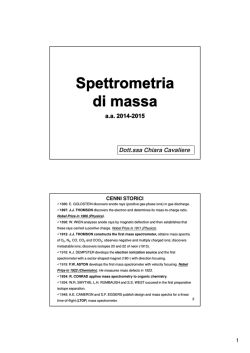
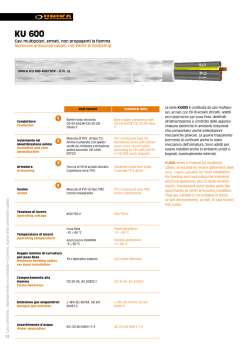
Universidad Autónoma de Madrid
Facultad de Ciencias
Departamento de Fı́sica Teórica
Sapienza Università di Roma
Facoltà di Scienze Matematiche Fisiche e Naturali
Dipartimento di Fisica
The ΛCDM model at small scales:
Milky Way’s satellites and
the cusp-core crisis
By
Arianna Di Cintio
A Thesis submitted for the degree of Doctor of
Philosophy in Astrophysics
Supervisor
Prof. Alexander Knebe (Universidad Autónoma de Madrid)
Co-Supervisor
Prof. Alessandro Melchiorri (Sapienza Università di Roma)
July 21, 2014
To my sister Lorenza, my brother Guido,
my mum Elena and my dad Massimo.
Contents
List of Figures
vi
List of Tables
viii
RESUMEN Y CONCLUSIONES
1
RIASSUNTO E CONCLUSIONI
8
1 Introduction
17
2 Simulations
23
2.1
2.2
2.3
CLUES simulation . . . . . . . . . . . . . . . . . . . . . . .
23
2.1.1
Initial conditions and Local Group selection . . . . .
23
2.1.2
Star formation and feedback . . . . . . . . . . . . . .
28
2.1.3
Cold versus Warm Dark Matter CLUES . . . . . . .
29
2.1.4
Previous results with CLUES . . . . . . . . . . . . .
29
MaGICC simulation . . . . . . . . . . . . . . . . . . . . . .
30
2.2.1
Initial conditions from MUGS simulations . . . . . .
31
2.2.2
Star formation and feedback . . . . . . . . . . . . . .
32
2.2.3
Early stellar feedback . . . . . . . . . . . . . . . . . .
34
2.2.4
Previous results with MaGICC . . . . . . . . . . . .
35
AHF halo finder . . . . . . . . . . . . . . . . . . . . . . . . .
37
2.3.1
37
Haloes and subhaloes definition . . . . . . . . . . . .
iii
3 Massive, dense dark matter subhaloes of the Milky Way
39
3.1
Introduction . . . . . . . . . . . . . . . . . . . . . . . . . . .
39
3.2
Simulation details . . . . . . . . . . . . . . . . . . . . . . . .
41
3.3
Results . . . . . . . . . . . . . . . . . . . . . . . . . . . . . .
42
3.4
Conclusions . . . . . . . . . . . . . . . . . . . . . . . . . . .
47
4 Non-universal density profile of SPH subhaloes: implications for the Milky Way’s dSphs
49
4.1
Introduction . . . . . . . . . . . . . . . . . . . . . . . . . . .
50
4.2
Simulation details . . . . . . . . . . . . . . . . . . . . . . . .
52
4.3
The density profile of SPH and DM subhaloes . . . . . . . .
53
4.3.1
Theoretical Models . . . . . . . . . . . . . . . . . . .
53
4.3.2
Application to Subhaloes . . . . . . . . . . . . . . . .
55
4.4
Shape parameter – subhalo mass relation . . . . . . . . . . .
58
4.5
New observational constraints for the satellite galaxies of the
Milky Way . . . . . . . . . . . . . . . . . . . . . . . . . . . .
62
Conclusion and discussion . . . . . . . . . . . . . . . . . . .
67
4.6
5 Scale-free mass estimators applied to the Local Group
71
5.1
Introduction . . . . . . . . . . . . . . . . . . . . . . . . . . .
72
5.2
Simulation details . . . . . . . . . . . . . . . . . . . . . . . .
74
5.3
Scale-free mass estimators . . . . . . . . . . . . . . . . . . .
75
5.3.1
Theory of mass estimators . . . . . . . . . . . . . . .
77
5.3.2
Dependence of the mass estimators on the parameters 80
5.4
5.5
Application to the CLUES simulation . . . . . . . . . . . . .
84
5.4.1
Obtaining the parameters α, β and γ . . . . . . . . .
84
5.4.2
Results for the simulated MW and M31
. . . . . . .
87
5.4.3
Exploring the influence of the MW and M31 on each
other . . . . . . . . . . . . . . . . . . . . . . . . . . .
94
Summary & Conclusions . . . . . . . . . . . . . . . . . . . .
98
6 Warm dark matter Local Group simulations
103
6.1
Introduction . . . . . . . . . . . . . . . . . . . . . . . . . . . 103
6.2
Results . . . . . . . . . . . . . . . . . . . . . . . . . . . . . . 104
6.3
Summary and Discussion . . . . . . . . . . . . . . . . . . . . 111
7 Abundance Matching in the Local Group
115
7.1
Introduction . . . . . . . . . . . . . . . . . . . . . . . . . . . 116
7.2
Local Group Simulations . . . . . . . . . . . . . . . . . . . . 117
7.3
Results . . . . . . . . . . . . . . . . . . . . . . . . . . . . . . 119
7.4
Conclusions . . . . . . . . . . . . . . . . . . . . . . . . . . . 123
7.5
Discussion . . . . . . . . . . . . . . . . . . . . . . . . . . . . 124
8 Cusp and cores in galaxies: the dependence of dark matter
profiles on the stellar-to-halo mass ratio
127
8.1
Introduction . . . . . . . . . . . . . . . . . . . . . . . . . . . 128
8.2
Simulations . . . . . . . . . . . . . . . . . . . . . . . . . . . 130
8.2.1
8.3
8.4
Star Formation and Feedback . . . . . . . . . . . . . 132
Results . . . . . . . . . . . . . . . . . . . . . . . . . . . . . . 132
8.3.1
Inner slope as a funcion of halo mass . . . . . . . . . 134
8.3.2
Inner slope as a funcion of stellar-to-halo mass . . . . 137
8.3.3
Core creation . . . . . . . . . . . . . . . . . . . . . . 139
8.3.4
Predictions for observed galaxies
. . . . . . . . . . . 140
Conclusions . . . . . . . . . . . . . . . . . . . . . . . . . . . 143
9 Influence of galaxy formation on dark matter haloes: a mass
dependent density profile
147
9.1
Introduction . . . . . . . . . . . . . . . . . . . . . . . . . . . 148
9.2
Simulations . . . . . . . . . . . . . . . . . . . . . . . . . . . 150
9.3
Results . . . . . . . . . . . . . . . . . . . . . . . . . . . . . . 152
9.3.1
α, β, γ profile . . . . . . . . . . . . . . . . . . . . . . 152
9.3.2
Constraining the halo profile via M? /Mhalo
. . . . . 152
9.3.3
Checking the α, β, γ constraints . . . . . . . . . . . . 155
9.3.4
Modeling rotation curves . . . . . . . . . . . . . . . . 155
9.3.5
Constraining the concentration parameter . . . . . . 157
9.4
Conclusions . . . . . . . . . . . . . . . . . . . . . . . . . . . 160
9.5
Recipe to derive a mass dependent density profile . . . . . . 163
10 Conclusion
165
Index
171
Bibliography
171
List of Figures
2.1
Dark matter distribution in CLUES . . . . . . . . . . . . . .
25
2.2
Gas distribution around the CLUES Local Group. . . . . . .
27
2.3
CDM and WDM power spectrum used in CLUES . . . . . .
30
2.4
Scaling relations of MaGICC galaxies . . . . . . . . . . . . .
35
2.5
Face-on and edge-on images of a MaGICC galaxy . . . . . .
36
3.1
Vmax -Rmax relation of SPH and DM subhaloes, WMAP3 . . .
43
3.2
Vmax -Rmax relation of DM subhaloes, WMAP5 . . . . . . . .
44
3.3
Rotation curves of pairs of DM and SPH subhaloes . . . . .
46
4.1
Residual of density profiles fit of SPH subhaloes . . . . . . .
55
4.2
Einasto shape parameter vs SPH and DM subhaloes masses
56
4.3
Variation of shape parameter due to mass loss . . . . . . . .
60
4.4
Vmax -Rmax of SPH subhaloes, new Einasto constraints . . . .
65
4.5
Vmax vs mass for SPH subhaloes . . . . . . . . . . . . . . . .
67
5.1
Error in mass estimation due to velocity anisotropy β
. . .
81
5.2
Histogram of 1000 realization of estimated MW mass . . . .
89
5.3
Histogram of 1000 realization of estimated M31 mass . . . .
89
5.4
Radial distribution r3−γ of observed MW satellites . . . . . .
90
5.5
Estimated MW mass using subhaloes according to γ . . . . .
91
5.6
Performance of mass estimator for different γ
94
6.1
Cold vs Warm dark matter in the CLUES LG . . . . . . . . 105
vii
. . . . . . . .
6.2
Massive subhaloes in WDM CLUES . . . . . . . . . . . . . . 106
6.3
Evolution of distances and mass accretion history in WDM . 108
6.4
Internal properties of MW, M31 and M33 in WDM CLUES . 110
6.5
Gas distribution around the WDM LG . . . . . . . . . . . . 112
7.1
Mass function of CLUES DM haloes . . . . . . . . . . . . . 118
7.2
Stellar-to-halo mass relation for Local Group galaxies . . . . 120
7.3
Stellar mass function of observed LG galaxies . . . . . . . . 122
8.1
Contracted vs expanded dark matter density profiles . . . . 133
8.2
M? -Mhalo relation of several SPH galaxies . . . . . . . . . . . 135
8.3
Inner slope of DM profile vs M? -Mhalo for SPH galaxies . . . 136
8.4
M? -Mhalo relation color coded with predicted inner slope . . 139
8.5
Evolution of gas flows of contracted and expanded galaxies . 141
8.6
DM inner slope as a function of galaxy rotation velocity . . . 142
9.1
Inner and outer slope of fitted DM profile vs M? /Mhalo . . . 153
9.2
Mass dependent dark matter profile for SPH galaxies . . . . 156
9.3
Velocity curves modeled with a mass dependent profile . . . 158
9.4
Ratio between concentration in SPH and DM only run . . . 159
List of Tables
4.1
Fit performance of different models on subhaloes profiles . .
53
5.1
Properties of MW and M31 in CLUES WMAP5 . . . . . . .
76
5.2
Mass profile fit results for MW and M31 . . . . . . . . . . .
86
5.3
Mean value of estimated mass for MW and M31 . . . . . . .
88
5.4
Properties of observed MW satellites . . . . . . . . . . . . .
92
5.5
Mass estimation using facing or non-facing satellites . . . . .
95
5.6
Mass estimation using renegade satellites . . . . . . . . . . .
97
6.1
Properties of the main galaxies in CDM and WDM CLUES
111
8.1
MaGICC galaxies parameter . . . . . . . . . . . . . . . . . . 131
8.2
Parametrization of DM inner slope vs M? -Mhalo . . . . . . . 138
9.1
Properties of MaGICC SPH galaxies . . . . . . . . . . . . . 151
ix
Resumen y conclusiones
El modelo de materia oscura frı́a con constante cosmológica Λ, llamado
ΛCDM, es el actual modelo cosmológico favorecido en el contexto de la
formación de galaxias: formulado hace más de treinta años (White & Rees
1978), está basado en la suposición de que el universo está compuesto por
un ∼ 68% de energı́a oscura, por un ∼ 27% de materia oscura , y sólo
por un ∼ 5% de materia ordinaria (Planck Collaboration et al. 2013). Las
partı́culas de la materia oscura frı́a, al tener una masa mayor del keV, no
amortiguan las pequeñas fluctuaciones y pueden explicar satisfactoriamente
las propiedades observacionales de las galaxias, como la gran cantidad de
energı́a en pequeñas escalas indicadas por la función de correlación a dos
puntos (Peebles 1980). La necesidad de una componente de materia oscura
frı́a se desprende también de una serie de limitaciones observacionales, tales
como, entre otras, la curva de rotación de las galaxias (Rubin et al. 1980)
y la observación en weak lensing de colisiones entre cúmulos de galaxias
(Clowe et al. 2006).
Una consecuencia directa del hecho de que la materia oscura es frı́a,
es decir, que sus partı́culas son non-relativistas al tiempo de la igualdad
materia-radiación, es que la formación de estructuras avanza en manera
jerárquica ascendente, o bottom-up, desde las galaxias mas pequeñas hasta
las mas grandes (Blumenthal et al. 1984). De hecho, en ΛCDM las pequeñas
perturbaciones en el campo de densidad primordial pueden crecer y expandirse mediante la inestabilidad gravitacional, para luego fusionarse entre
sı́ para crear estructuras más grandes, tales como los cúmulos y los grupos
de galaxias, que vemos hoy. Las fluctuaciones primordiales de la densidad se
pueden medir directamente del fondo cósmico de microondas (CMB), que es
la radiación térmica remanente del Big Bang: el espectro de potencia de las
anisotropı́as de temperatura en CMB, de hecho, refleja dichas fluctuaciones,
o contraste, en la densidad de la materia en el Universo primordial (Smoot
et al. 1992; Spergel et al. 2003; Planck Collaboration et al. 2013). Estas
perturbaciones colapsarán para formar los - ası́ llamados - halos de materia
oscura, que son la base de la formación de todas las galaxias futuras, en
un proceso altamente no lineal que puede ser descrito sólo mediante el uso
1
de simulaciones numéricas, tales como las simulaciones de N-cuerpos del
campo de densidad cósmica (Springel 2005).
Dada una distribución de partı́culas inicialmente imperturbada, y teniendo en cuenta el espectro de potencia primordial como condición inicial,
podemos seguir la evolución y el colapso gravitacional de las partı́culas de
materia oscura no colisionales desde alto redshift hasta z=0, poner galaxias
en los halos de materia oscura usando modelos semianalı́ticos (Monaco et
al. 2014; Benson 2011), y comparar el resultado final con la distribución observada y las propiedades de las galaxias, por ejemplo usando la 2dF Galaxy
Redshift Survey (Cross et al. 2001). Aunque las simulaciones de materia
oscura hayan reproducido con éxito varias caracterı́sticas del universo, tanto
en grandes escalas, por ejemplo en las simulaciones Millenium-XXL y MultiDark (Angulo et al. 2012; Riebe et al. 2013) como en escalas galácticas, por
ejemplo en las galaxias del Grupo Local similares a la Via Lactea (Gottlöber
et al. 2010; Springel et al. 2008; Brook et al. 2012a), todavı́a hay discrepancias entre las propiedades observadas de las galaxias enanas y galaxias
satélites con la predicción del modelo ΛCDM. En estas escalas, de hecho, el
modelo se complica por la fı́sica bariónica que es importante en la dinámica
de formación de las galaxias . En particular, los principales problemas que
todavı́a afectan al paradigma ΛCDM a pequeña escala son:
• el problema de los satélites ausentes, o missing satellite problem
• el problema too big to fail
• el problema core/cusp
El missing satellite problem (Klypin et al. 1999a) es la discrepancia entre
el número observado de galaxias satélite alrededor de la Vı́a Láctea y de
la galaxia de Andrómeda y el número de subhalos en las simulaciones de
N-cuerpos, el último siendo algunos órdenes de magnitud más alto que el
anterior. Dentro del Grupo Local se observan solo ∼ 40 galaxias satélite
con M? > 106.5 M (McConnachie 2012; Brook et al. 2014), en comparación
con los ∼ 1000 subhalos producidos en las simulaciones de materia oscura
sin colisiones (Moore et al. 1999). Sin tener en cuenta los lı́mites actuales de
detección de las galaxias satélite menos brillante (Tollerud et al. 2008), una
solución a este problema requiere la identificación de un mecanismo capaz
de inhibir la formación de estrellas por debajo de una cierta masa del halo de
materia oscura: la reionización en el universo primordial, que ocurre entre
z=10-6, parece ser un buen candidato, ya que provoca el calentamiento del
gas y evita su colapso en halos pequeños (Bullock et al. 2000; Benson et
al. 2002; Somerville 2002). Por lo tanto, los halos de materia oscura menos
masivos no forman galaxias visibles y permanecen desprovistos de estrellas.
2
Otro aspecto del mismo problema es el too big to fail problem (TBTF),
recientemente mostrado por (Boylan-Kolchin et al. 2011, 2012; GarrisonKimmel et al. 2014) y que se puede resumir en la siguiente manera: la
cinemática de las galaxias enanas esferoidales (dShps) observadas en la
Vı́a Láctea y en Andrómeda no coincide con la cinemática de los subhalos
obtenidos en las simulaciones de N-cuerpos. La dispersión de la velocidad
estelar observada al radio de media-luminosidad (half-light radius) de la
mayorı́a de las dSphs es menos de 20 km/s (McConnachie 2012; Collins et
al. 2014; Tollerud et al. 2014), lo cual pondrı́a estas galaxias en pequeños
halos, dejando oscuros los subhalos más masivos encontrado en las simulaciones; o, en otras palabras, los subhalos más masivos en las simulaciones
de N-cuerpos son demasiado densos para poder explicar la cinemática de
las galaxias satélites observadas en el Grupo Local.
Dado que la Vı́a Láctea y la galaxia de Andrómeda no parecen ser casos especiales en este sentido (Strigari & Wechsler 2012), no hay actualmente un modelo de formación de galaxias que pueda fácilmente explicar
estos resultados, a menos que se acepte que la formación de las galaxias
sea estocástica por debajo de una cierta escala de masa de los halos. Una
solución podrı́a ser la reducción de la densidad central de los subhalos a
través de mecanismos de fı́sica bariónica tales como fugas de gas causadas
por explosiones de supernovae (Governato et al. 2010; Pontzen & Governato
2012): este mecanismo hace que el perfil de densidad de la materia oscura
en la parte central del halo sea mucho más plano del perfil comúnmente
utilizado, el NFW (Navarro et al. 1996b). Aunque este escenario podrı́a
funcionar para las galaxias enanas más brillantes, como Fornax con su luminosidad de L ∼ 2 · 107 L , no está claro cómo las enanas menos brillantes,
hallándose entre los objetos con el mayor contenido de materia oscura en el
universo, podrı́a desarrollar suficiente energı́a para crear una distribución
plana (cored ) en un halo cuya densidad inicial central es una cúspide (perfil
cuspy o NFW) (Garrison-Kimmel et al. 2013). Además, estos resultados
dependen en gran medida del tipo de feedback estelar introducido en las
simulaciones: simulaciones hidrodinámicas que no incluyen las fugas de gas
impulsivas conducirán inevitablemente a una contracción adiabática de la
parte central de los subhalos (Blumenthal et al. 1984; Gnedin et al. 2004),
provocada por el colapso de gas frı́o hacia el centro, dando un resultado aún
peor, como se muestra en (Di Cintio et al. 2011).
Algunos estudios han demostrado, sin embargo, que la combinación de
los procesos bariónicos junto con una evolución posterior de los subhalos,
teniendo en cuenta los efectos de las fuerzas de marea (tidal stripping),
podrı́a resolver el problema (Zolotov et al. 2012; Arraki et al. 2014). Al
describir el perfil de densidad de la materia oscura en los subhalos con un
modelo de tipo Einasto (Einasto 1965), en lugar de NFW, se podrı́a mejorar
3
el problema (Di Cintio et al. 2013; Vera-Ciro et al. 2013), ya que este modelo
permite describir diferentes perfiles causados por la pérdida de material en
las zonas exteriores de los subhalos por efectos de mareas (Peñarrubia et al.
2010). Por otro lado, suponiendo que la Vı́a Láctea tenga una masa inferior
a 1012 M , también ayuda a reducir el número de subhalos masivos que se
encuentran en las simulaciones (Wang et al. 2012; Vera-Ciro et al. 2013; Di
Cintio et al. 2013). Otras posibilidades serian de invocar diferentes tipos
de materia oscura, como la materia oscura auto-interactiva (Vogelsberger et
al. 2012) o la materia oscura templada (warm dark matter, WDM) (Lovell
et al. 2012) (véase, sin embargo, Schneider et al. 2014).
Por último, unido al problema TBTF, es la discrepancia cusp/core (de
Blok 2010), es decir, el hecho de que las observaciones de las galaxias muestran que el perfil de densidad de la materia oscura es cored, o plano, hacia
el centro, en desacuerdo con las simulaciones de N-cuerpos que en lugar establecen que los perfiles de densidad de materia oscura están bien descritos
por un modelo con una cúspide central, modelo cuspy o NFW (Navarro et
al. 1996b). La cúspide central de ese perfil, ρDM ∼ r−1 , está en tensión con
las observaciones de las galaxias espirales y de las galaxias enanas: modelos
detallados, basados en las curvas de rotación de estas galaxias, sugieren un
perfil de densidad de la materia oscura de tipo cored, ρDM ∼ const (Salucci
& Burkert 2000; Simon et al. 2005; de Blok et al. 2008; Kuzio de Naray et
al. 2008a; Oh et al. 2011a). También se observa un core central entre las
enanas esferoidales menos brillantes alrededor de la Vı́a Láctea (Walker &
Peñarrubia 2011).
En los últimos años se ha ido afirmando cada vez más la idea de que
esta inconsistencia cusp/core se deriva del haber descuidado los efectos de
los bariones en las simulaciones numéricas de las galaxias. Muchos estudios
han demostrado que los bariones pueden influir en la distribución de la
materia oscura en las galaxias (es Tissera & Dominguez-Tenreiro 1998). El
enfriamiento del gas en el centro de una galaxia, debido a la contracción
adiabática, consolida las cúspides centrales y exacerba la diferencia entre
las observaciones y los perfiles teóricos (es Blumenthal et al. 1986; Gnedin
et al. 2004). De hecho, para conciliar las relaciones de escala observadas
en las galaxias, los halos de materia oscura deben ser más bien expandidos
(Dutton et al. 2007, 2013). Los bariones pueden causar una expansión de
las zonas centrales de los halos a través de dos mecanismos principales (ver
Pontzen & Governato 2014 para una reseña reciente): por salidas rápida
de gas, producidas por feedback estelar o por los núcleos galácticos activos
(AGN) (Navarro et al. 1996a; Mo & Mao 2004; Read & Gilmore 2005;
Mashchenko et al. 2006; Duffy et al. 2010; Pontzen & Governato 2012;
Martizzi et al. 2013), o por fricción dinámica (El-Zant et al. 2001; Tonini
et al. 2006; Romano-Dı́az et al. 2008; Del Popolo 2009, 2010; Goerdt et al.
4
2010; Cole et al. 2011).
Si por un lado la fricción dinámica es eficaz en la expansión de halos
muy masivos como lo que hay en los grupos de galaxias, por otro lado el
feedback estelar es más eficaz en expandir halos de baja masa (Governato
et al. 2010). El gas se enfrı́a en el centro de la galaxia, donde va a formar las
estrellas que luego irán explotando como supernovae, provocando repetidos
derrames de material. Estas fugas impulsivas son capaces de mover bastante masa de gas para que la densidad central del halo disminuya y se
vaya creando un core donde originalmente habı́a una cúspide, gracias a la
respuesta de la materia oscura a los cambios en el potencial gravitacional.
Peñarrubia et al. (2012) ha calculado la energı́a necesaria para la transformación de un perfil de densidad desde cusp a core, en función de la masa
del halo. Esta transformación puede ser permanente si las salidas de gas
son suficientemente rápidas (Pontzen & Governato 2012).
En recientes simulaciones de galaxias enanas (Governato et al. 2010;
Zolotov et al. 2012; Teyssier et al. 2013) y de galaxias más masivas, como
por ejemplo la Vı́a Láctea (Macciò et al. 2012), se ha mostrado que los
halos de materia oscura se expanden, dependiendo del tipo de feedback
estelar. Governato et al. (2012) mostró que sólo las galaxias simuladas
con masa estelar mayor que ∼ 107 M son capaces de desarrollar la energı́a
suficiente para expandir sus halos. Estos autores también han demostrado
que la pendiente del perfil de la materia oscura en el centro de la galaxia,
γ en ρ ∝ r−γ , disminuye al aumentar la masa estelar, en consecuencia del
aumento de la energı́a disponible en explosión de supenovae. Un aumento de
la masa estelar puede, sin embargo, hacer más profundo el pozo de potencial
en la región central del halo: hemos demostrado en Di Cintio et al. (2014b)
que, por encima de una cierta masa del halo, el potencial gravitacional es tan
profundo que crea una contraposición eficiente al proceso de aplanamiento.
En Di Cintio et al. (2014b) hemos propuesto que γ depende de la relación
entre la masa de las estrellas y la masa del halo de materia oscura, relación
−4
que va a ser diferente para diferentes galaxias. Por M? /Mhalo <
∼ 10 no
hay suficiente energı́a proveniente de supernovae para cambiar de manera
eficiente la distribución de la materia oscura, y el halo mantiene el perfil
original del tipo NFW, con γ ∼ -1. Para valores más altos de M? /Mhalo , γ
aumenta, hasta un máximo de γ ∼ 0 (galaxias con densidad central cored )
por M? /Mhalo ∼ 3 − 5 × 10⁻³ . La relación empı́rica entre la masa estelar de
las galaxias y la masa del halo de materia oscura en el que residen (Moster et
al. 2010; Guo et al. 2010) implica que este valor corresponde a M? ≈ 108.5 M
y Mhalo ≈ 1011 M . En halos de masa mayor, el proceso de fuga de gas es
cada vez más ineficaz en aplanar la densidad interna de la materia oscura,
que vuelve a ser cuspy .
5
Mediante un conjunto de galaxias simuladas hidrodinámicamente, que
cubren una amplia gama de masas y que incluyen el feedback estelar de
supernovae, de los vientos estelares y de las estrellas jóvenes y masivas,
hemos mostrado en Di Cintio et al. (2014a) cómo es posible obtener un
perfil que describe de manera eficiente la distribución de la materia oscura
en las galaxias simuladas, desde las galaxias enanas hasta las espirales como
la Vı́a Láctea .
En la primera parte de esta tesis, me concentraré en el problema TBTF,
utilizando un Grupo Local de galaxias simuladas en el proyecto CLUES1 ,
una simulación cosmológica de N-cuerpos presentada en Gottlöber et al.
(2010), en la cual la dinámica del gas es descrita por el método de Lagrange
Smoothed-Particles Hydrodynamics (SPH).
Los Capı́tulos 3 y 4 estarán dedicados al análisis de las galaxias simuladas en CLUES, correspondientes a la Vı́a Láctea y Andrómeda y a sus
satélites. Mostraré cómo la inclusión de bariones en las simulaciones de
N-cuerpos provoca un doble efecto con respecto a los subhalos: mientras
que los satélites con una gran fracción bariónica sufren una contracción
adiabática de sus halos, agravando ası́ el problema TBTF, los subhalos que
han perdido todo sus gas a z=0 sufrirán una disminución de Vmax , el pico
de sus curva de rotación, hasta ser compatibles con las galaxias satélite
observadas en la Vı́a Láctea. Veremos también cómo es posible describir
el perfil de densidad de los subhalos con un modelo Einasto que, al tener
un parámetro libre mas que el clásico modelo NFW, es capaz de capturar
en manera mejor la distribución de la materia oscura en los subhalos: utilizando este perfil se pueden conciliar las observaciones de las dSphs y las
simulaciones de los subhalos.
El número de satélites masivos que se encuentran dentro del radio virial
de una galaxia depende de manera clara de la masa misma de la galaxia,
por esta razón en el Capı́tulo 5 presentaré un método para estimar la masa
de las galaxias y aplicaré este método a las galaxias simuladas en CLUES
(Di Cintio et al. 2012).
En el Capı́tulo 6 analizaré el problema TBTF usando simulaciones de
WDM, es decir, de materia oscura templada con partı́culas de masa ∼ 1
keV, y mostraré que aunque la WDM reduce el número de las estructuras
presentes a pequeñas escalas, no es, sin embargo, suficiente para explicar la
discrepancia con las observaciones. Presentaré también las principales diferencias de un grupo de galaxias simuladas en un entorno ΛCDM o ΛWDM.
En el Capı́tulo 7, me centraré en la técnica de abundance matching en
el Grupo Local. El uso de la función de masa de halos derivadas de simula1
http://www.clues-project.org/
6
ciones del Grupo Local, como las simulaciones CLUES, permite ampliar la
relación entre la masa estelar y la masa de los halos de materia oscura hasta
las galaxias más débiles y menos brillantes, como las dSphs . Esta relación
indica que la mayorı́a de las galaxias del Grupo Local esta contenida en
halos de materia oscura de masa > 1010 M : para conciliar los datos observacionales con esta predicción se debe asumir que algunas de estas galaxias
tienen un core central, o sea que su halo de materia oscura es expandido.
La expansión de los halos de materia oscura y el problema cusp/core
serán el tema central de la segunda parte de la tesis, en la cual utilizaré
las simulaciones hidrodinámicas pertenecientes al proyecto MAGICC2 , que
incluyen un modelo de feedback fı́sicamente motivado. Estas galaxias reproducen de manera excelente la relación entre la masa estelar y la masa del
halo a z=0 ası́ como en redshift mas altos (Kannan et al. 2013), y una serie
de propiedades observacionales y relaciones de escala (Brook et al. 2012b;
Stinson et al. 2013).
En los Capı́tulos 8 y 9 describiré cómo la transformación cusp/core es
totalmente dependiente de la relación M? /Mhalo de cada galaxia, y como tal
predicción se puede utilizar para hacer comparaciones con observaciones.
Derivaré, además, un perfil de densidad que puede reproducir la materia
oscura cuya distribución sea de tipo cusp ası́ como de tipo core, y que es
apropiado para describir las galaxias enanas y las galaxias espirales tipo Vı́a
Láctea. Este perfil está totalmente vinculado a la eficiencia de formación
estelar en cada galaxia, M? /Mhalo a z=0, y representa un mejoramiento
significativo sobre el perfil clásico NFW, que, siendo derivado a partir de
simulaciones de N-cuerpos, no considera el impacto de la fı́sica bariónica.
La descripción completa de las simulaciones utilizadas en esta tesis será
presentada en el Capitulo 2, y las conclusiones y posibilidad futuras en el
Capitulo 10.
2
http://www.star.uclan.ac.uk/∼cbb/magicc.html
7
8
Riassunto e conclusioni
Il modello di materia oscura fredda con costante cosmologica Λ, cosiddetto ΛCDM, è l’attuale modello cosmologico favorito nell’ambito di formazione di galassie: formulato più di trenta anni fa (White & Rees 1978), è
basato sull’assunzione che l’Universo sia composto per il ∼ 68% da energia
oscura, per il ∼ 27% da materia oscura e solo per il ∼ 5% da materia ordinaria (Planck Collaboration et al. 2013). Le particelle di materia oscura
fredda, avendo una massa più grande del keV, non riescono a smorzare le
piccole fluttuazioni e possono quindi spiegare in maniera soddisfacente le
proprietà osservative delle galassie, come la grande quantità di energia su
piccole scale indicata dalla funzione correlazione a due punti (Peebles 1980).
La necessità di una componente di materia oscura fredda è evidente anche
da una serie di vincoli osservativi quali, tra gli altri, la curva di rotazione
delle galassie (Rubin et al. 1980) e l’osservazione in weak lensing di collisioni
tra ammassi (Clowe et al. 2006).
Una conseguenza diretta del fatto che la materia oscura sia fredda,
ovvero che le sue particelle fossero non relativistiche all’epoca dell’eguaglianza
materia-radiazione, è che la formazione di strutture proceda in maniera gerarchica bottom-up, dal basso verso l’alto (Blumenthal et al. 1984). In ΛCDM
piccole perturbazioni nel campo di densità primordiale possono crescere ed
espandersi via instabilità gravitazionali e poi fondersi tra di loro per creare le
strutture molto più grandi, quali ammassi e gruppi di galassie, che osserviamo oggi. Le fluttuazioni primordiali in densità possono essere misurate
direttamente dalla radiazione cosmica di fondo (CMB), che è la radiazione
termica rimanente del Big Bang: lo spettro di potenza delle anisotropie in
temperatura della CMB, infatti, riflette tali fluttuazioni, o grado di contrasto, nel campo di densità di materia dell’Universo primordiale (Smoot et
al. 1992; Spergel et al. 2003; Planck Collaboration et al. 2013). Queste perturbazioni inizieranno a collassare per formare i cosiddetti aloni di materia
oscura, che sono alla base della formazione di tutte le galassie future, in un
processo altamente non lineare che può essere studiato solo utilizzando simulazioni numeriche come simulazioni a N corpi del campo di densità cosmico
(Springel 2005).
9
Data una distribuzione inizialmente imperturbata di particelle, e tenendo
conto dello spettro di potenza primordiale come condizione iniziale, si può
descrivere l’evoluzione ed il seguente collasso gravitazionale della materia
oscura non collisionale da alti redshift fino a z=0, assegnare le galassie a
tali aloni di materia oscura utilizzando modelli semianalitici (Monaco et al.
2014; Benson 2011), e confrontare il risultato finale con la distribuzione e le
proprietà osservative delle galassie, ad esempio utilizzando la 2dF Galaxy
Redshift Survey (Cross et al. 2001). Sebbene le simulazioni di materia
oscura abbiano riprodotto con successo diverse caratteristiche dell’Universo
sia a grandi scale (e.g., la Millenium-XXL ed il MultiDark run in Angulo
et al. 2012; Riebe et al. 2013) che a scale galattiche (e.g., il Gruppo Locale
e le galassie simili alla Via Lattea come in Gottlöber et al. 2010; Springel
et al. 2008; Brook et al. 2012a), esistono ancora delle discordanze tra la
previsione del modello ΛCDM e le proprietà osservative di galassie nane e
galassie satelliti. A tali scale, infatti, il modello è complicato dalla fisica
barionica che è dinamicamente rilevante nella formazione di strutture. In
particolare, le principali questioni che tuttora gravano sul paradigma ΛCDM
a piccole scale sono :
• il problema dei satelliti mancanti, o missing satellite problem
• il problema too big to fail
• il problema core/cusp
Il problema dei missing satellite (Klypin et al. 1999a) è la discrepanza
tra il numero di galassie satellite osservate intorno alla nostra Via Lattea
e alla galassia di Andromeda ed il numero di subaloni di materia oscura
trovati in simulazioni ad N corpi, quest’ultimo essendo alcuni ordini di
grandezza maggiore del precedente. All’interno del Gruppo Locale si osservano soltanto ∼ 40 galassie satellite con M? > 106.5 M (McConnachie
2012; Brook et al. 2014), contro i ∼ 1000 subaloni prodotti in simulazioni
non collisionali (Moore et al. 1999). Trascurando gli attuali limiti di rilevabilità delle galassie satellite meno luminose (Tollerud et al. 2008), una
soluzione a questo problema richiede di individuare un meccanismo in grado
di inibire la formazione di stelle al di sotto di una certa massa dell’alone di
materia oscura: la reionizzazione nell’universo primordiale, che avviene a
z=10-6, sembra essere un buon candidato, dal momento che riscalda il gas
e ne previene il collasso in piccoli aloni (Bullock et al. 2000; Benson et al.
2002; Somerville 2002). Pertanto gli aloni di materia oscura meno massivi
non formeranno una galassia visibile e resteranno privi di stelle.
Un altro aspetto del problema è il cosiddetto problema too big to fail
(TBTF), recentemente evidenziato da Boylan-Kolchin et al. (2011, 2012);
10
Garrison-Kimmel et al. (2014), e riassunto come segue: la cinematica delle
galassie nane sferoidali (dShps) osservate nella Via Lattea ed in Andromeda
non coincide con la cinematica dei subaloni prevista da simulazioni ad
N corpi. La dispersione di velocità stellare osservata al raggio di mezzaluminosità, half-light radius, della maggior parte delle dSphs è inferiore a
20 km/s (McConnachie 2012; Collins et al. 2014; Tollerud et al. 2014), fatto
che porrebbe tali galassie in piccoli aloni, lasciando oscuri i più massicci
subaloni trovati nelle simulazioni; o, in altre parole, i subaloni più massicci in simulazioni N corpi sono troppo densi per poter ospitare molte delle
galassie satelliti osservate nel Gruppo Locale.
Dal momento che la Via Lattea e la galassia di Andromeda non sembrano essere casi particolari in questo senso (Strigari & Wechsler 2012),
non c’è attualmente un modello di formazione di galassie che possa spiegare
facilmente questi risultati, a meno che non si accetti che la formazione di
galassie sia stocastica al di sotto di una certa scala di massa. Una soluzione
potrebbe essere quella di ridurre la densità centrale dei subaloni attraverso
meccanismi di fisica barionica come ad esempio fuoriuscite di gas causate
da esplosioni di supernovae (Governato et al. 2010; Pontzen & Governato
2012): tale meccanismo fa sı̀ che il profilo di densità della materia oscura,
nella parte centrale dell’alone, sia molto più piatto del comunemente utilizzato profilo NFW (Navarro et al. 1996b). Se da un lato questo scenario
potrebbe funzionare per le galassie nane più brillanti, come Fornax con
la sua luminosità di L ∼ 2 · 107 L , non è chiaro come le nane con una
minore luminosità, essendo tra gli oggetti con il più alto contenuto di materia oscura nell’universo, possano sviluppare l’energia sufficiente a creare
una distribuzione piatta (cored ) in un alone la cui densità centrale iniziale è
invece una cuspide (cuspy, profilo NFW) (Garrison-Kimmel et al. 2013). Inoltre questi risultati sono fortemente dipendenti dal tipo di feedback stellare
introdotto nelle simulazioni: simulazioni idrodinamiche che non includono
fuoriuscite impulsive di gas porteranno inevitabilmente ad una contrazione
adiabatica della parte centrale dei subaloni (Blumenthal et al. 1984; Gnedin
et al. 2004), causata dal collasso di gas freddo verso il centro, provocando
un quadro ancora peggiore, come dimostrato in Di Cintio et al. (2011).
Alcuni studi hanno mostrato, tuttavia, che la combinazione di processi
barionici ed una successiva evoluzione dei subaloni, tenendo conto degli
effetti delle forze mareali (tidal stripping), potrebbe risolvere il problema
(Zolotov et al. 2012; Arraki et al. 2014). Descrivere il profilo di densità
della materia oscura nei subaloni con un modello tipo Einasto (Einasto
1965), piuttosto che NFW, può alleviare il problema (Di Cintio et al. 2013;
Vera-Ciro et al. 2013), visto che tale modello consente di descrivere differenti
profili causati dalla perdita di materiale nelle zone esterne del subalone per
effetti mareali (Peñarrubia et al. 2010). D’altra parte, assumere una massa
11
minore per la Via Lattea aiuta a ridurre il numero di subaloni massivi
(Wang et al. 2012; Vera-Ciro et al. 2013; Di Cintio et al. 2013). Altre
possibilità invocano differenti tipi di materia oscura, dalla materia oscura
auto-interagente (Vogelsberger et al. 2012) alla materia oscura tiepida, o
warm dark matter WDM (Lovell et al. 2012) (vedi, tuttavia, Schneider et
al. (2014)).
Infine, collegata al problema TBTF, è la discrepanza cusp/core (de Blok
2010), cioè il fatto che le osservazioni di galassie mostrano che il profilo
di densità dei sottostanti aloni di materia oscura è cored, piatto verso il
centro, in disaccordo con le simulazioni a N corpi che invece prevedono che
tali profili di densità di materia oscura siano ben descritti da un modello con
una cuspide centrale, cuspy, come il modello NFW (Navarro et al. 1996b).
La cuspide centrale di tale profilo, ρdm ∼ r−1 , è in tensione con osservazioni
di galassie sia nane che a spirale, per le quali modelli dettagliati di massa
basati sulle curve di rotazione suggeriscono un profilo di densità centrale
della materia oscura di tipo cored, ρdm ∼ const (Salucci & Burkert 2000;
Simon et al. 2005; de Blok et al. 2008; Kuzio de Naray et al. 2008a; Oh
et al. 2011a). Galassie con un core centrale sono state osservate anche tra
le meno brillanti nane sferoidali che circondano la Via Lattea (Walker &
Peñarrubia 2011).
Negli ultimi anni si è sempre più andata affermando l’idea che tale incoerenza cusp/core derivi dall’aver trascurato gli effetti dei barioni nelle
simulazioni numeriche di galassie. Molti studi hanno dimostrato come i
barioni possano influenzare la distribuzione di materia oscura nelle galassie
(e.g. Tissera & Dominguez-Tenreiro 1998). Il raffreddamento del gas al
centro di una galassia causa contrazione adiabatica, il cui effetto consolida
le cuspidi centrali e aggrava il divario tra profili teorici e osservazioni (e.g.
Blumenthal et al. 1986; Gnedin et al. 2004). Per riconciliare le relazioni di
scala delle galassie osservate, servirebbero piuttosto aloni di materia oscura
espansi (Dutton et al. 2007, 2013). I barioni possono causare un’espansione
degli aloni attraverso due meccanismi principali (vedi Pontzen & Governato 2014 per una rassegna recente): per fuoriuscite di gas prodotte da
feedback stellare o da nuclei galattici attivi (AGN) (Navarro et al. 1996a;
Mo & Mao 2004; Read & Gilmore 2005; Mashchenko et al. 2006; Duffy et
al. 2010; Pontzen & Governato 2012; Martizzi et al. 2013) o per attrito dinamico (El-Zant et al. 2001; Tonini et al. 2006; Romano-Dı́az et al. 2008;
Del Popolo 2009, 2010; Goerdt et al. 2010; Cole et al. 2011).
Mentre l’attrito dinamico è efficace nell’espandere aloni molto massivi
nei quali si trovano ammassi di galassie, il feedback stellare è più efficace
nell’espandere aloni di piccola massa (Governato et al. 2010). Il gas, raffreddandosi al centro della galassia, andrà a formare le stelle che, esplodendo
12
come supernovae, provocheranno poi ripetute fuoriuscite di materiale o outflows. Tali outflows sono in grado a muovere abbastanza massa di gas da
riuscire a creare un nucleo piatto di densità centrale in un alone oscuro
originariamente cuspy, grazie alla risposta della materia oscura alle variazioni del potenziale gravitazionale. Peñarrubia et al. (2012) ha calcolato
l’energia necessaria per avere la trasformazione cusp/core di un profilo di
densità in funzione della massa dell’alone. Tale trasformazione può essere
permanente se gli outflows sono sufficientemente rapidi (Pontzen & Governato 2012). Simulazioni di galassie nane (Governato et al. 2010; Zolotov
et al. 2012; Teyssier et al. 2013) e di galassie più massive tipo Via Lattea
(Macciò et al. 2012) hanno prodotto aloni di materia oscura espansi, a seconda dell’implementazione del feedback stellare. Governato et al. (2012) ha
mostrato che solo galassie simulate con massa stellare superiore a ∼ 107 M
riescono a sviluppare l’energia sufficiente per espandere i loro aloni. Questi
autori hanno inoltre dimostrato che la pendenza del profilo della materia
oscura verso il centro della galassia, γ in ρ ∝ r−γ , si riduce con l’aumento
della massa stellare, conseguentemente all’aumento di energia disponibile
dall’esplosione di supenovae. Un aumento della massa stellare può tuttavia
rendere più profonda la buca di potenziale nella regione centrale dell’alone:
abbiamo mostrato in Di Cintio et al. (2014b) che, al di sopra di una certa
massa dell’alone, una tale buca di potenziale si oppone al processo di appiattimento.
In Di Cintio et al. (2014b) abbiamo proposto che γ dipenda dal rapporto tra la massa di stelle e la massa dell’alone di materia oscura, rap−4
porto che sarà differente per galassie diverse. Per M? /Mhalo <
∼ 10 non c’è
abbastanza energia da supernovae in grado di cambiare in modo efficiente
la distribuzione di materia oscura, e l’alone manterrà il profilo originale
di tipo NFW, con γ ∼ −1. Per valori più elevati di M? /Mhalo , γ aumenterà, fino a raggiungere un massimo di γ ∼ 0 (galassie più cored ) per
M? /Mhalo ∼ 3 − 5 × 10⁻³ . La relazione empirica tra la massa stellare delle
galassie e la massa dell’alone di materia oscura in cui risiedono (Moster et al.
2010; Guo et al. 2010) implica che tale valore corrisponda a M? ≈ 108.5 M
e Mhalo ≈ 1011 M . In aloni di massa superiore, il processo di fuoriuscita
di gas diventerà sempre più inefficace ad appiattire la densità interna di
materia oscura, che tornerà ad essere cuspy.
Utilizzando un insieme di galassie simulate idrodinamicamente, che coprono un intervallo di massa ampio ed includono feedback stellare da supernovae, venti stellari e stelle giovani e massicce, abbiamo ulteriormente
mostrano in Di Cintio et al. (2014a) di come sia possibile ricavare un profilo
che descriva in modo efficiente la distribuzione di materia oscura all’interno
delle galassie simulate, dalle nane alle galassie a spirale tipo Via Lattea.
13
Nella prima parte di questa tesi mi concentrerò sul problema TBTF, utilizzando un Gruppo Locale simulato nell’ambito del progetto CLUES3 , una
simulazione cosmologica ad N corpi presentata in Gottlöber et al. (2010),
in cui la dinamica del gas è descritta con il metodo lagrangiano SmoothedParticles Hydrodynamics (SPH).
I Capitoli 3 e 4 saranno dedicati all’analisi delle galassie simulate in
CLUES, corrispondenti alla Via Lattea e ad Andromeda, e dei loro satelliti. Mostrerò come l’inclusione dei barioni nelle simulazioni ad N corpi
causi un duplice effetto per quanto riguarda i subaloni: mentre i satelliti
con una grande frazione barionica subiranno una contrazione adiabatica del
proprio alone, peggiorando cosı̀ il problema TBTF, i subaloni che avranno
perso tutto il loro gas a z=0 subiranno una diminuzione in Vmax , il picco
della loro curva di rotazione, risultando compatibili con le galassie satellite
osservate nella Via Lattea. Farò inoltre vedere di come sia possibile descrivere il profilo di densità dei subaloni con un modello Einasto che, avendo
un parametro in più rispetto al classico modello NFW, riesce a catturare
meglio la distribuzione di materia oscura all’interno dei subaloni: utilizzando tale profilo è possibile riconciliare osservazioni di dSphs e simulazioni
di subaloni.
Poiché il numero di satelliti massivi che si trovano all’interno del raggio
viriale di una galassia dipende in maniera evidente dalla massa stessa di
tale galassia, presenterò nel Capitolo 5 un metodo per stimare le masse
delle galassie ed applicherò tale metodo alle galassie simulate in CLUES
(Di Cintio et al. 2012).
Nel Capitolo 6 affronterò il problema TBTF utilizzando simulazioni
di WDM, ossia materia oscura tiepida con particelle di massa ∼1 keV,
mostrando che sebbene la WDM riduca il numero di strutture presenti a
piccole scale, non è tuttavia sufficiente per spiegare le discrepanze con le osservazioni. Presenterò inoltre le differenze principali di un gruppo di galassie
simulate in un contesto ΛCDM o ΛWDM.
Nel Capitolo 7 mi focalizzerò sulla tecnica di abundance matching nel
Gruppo Locale. Utilizzando la funzione di massa degli aloni derivata da
simulazioni del Gruppo Locale, quali le simulazioni CLUES, è possibile estendere la relazione tra massa stellare e massa degli aloni di materia oscura
fino alle galassie più deboli e meno luminose, come le dSphs. Tale relazione
indica che la maggior parte delle galassie del Gruppo Locale è contenuta in
aloni di materia oscura di massa > 1010 M : per riconciliare i dati osservativi con tale previsione bisogna assumere che alcune di tali galassie abbiano
un core, ovvero che il loro alone di materia oscura sia espanso.
3
http://www.clues-project.org/
14
L’espansione degli aloni di materia oscura ed il problema cusp/core
saranno al centro della seconda parte della tesi, in cui utilizzerò le simulazioni idrodinamiche appartenenti al progetto MaGICC4 , che includono
modelli di feedback fisicamente motivati. Queste galassie riproducono eccellentemente la relazione tra massa stellare e massa dell’alone sia a z=0
che a più alti redshift (Kannan et al. 2013), nonché una serie di proprietà
osservative e relazioni di scala (Brook et al. 2012b; Stinson et al. 2013).
Nei Capitoli 8 e 9 descriverò come la trasformazione cusp/core dipenda
interamente dal rapporto M? /Mhalo di ogni galassia, e come tale previsione
possa essere utilizzata per fare confronti con i dati osservativi. Deriverò,
inoltre, un profilo di densità in grado di riprodurre distribuzioni di materia
oscura sia di tipo core che di tipo cusp, di modo che tale profilo risulti appropriato per descrivere galassie nane cosı̀ come galassie a spirale tipo Via
Lattea. Tale profilo è completamente vincolato all’efficienza di formazione
stellare all’interno di ogni galassia, M? /Mhalo a z=0, e rappresenta un notevole miglioramento rispetto al classico profilo NFW, che, essendo derivato da
simulazioni ad N corpi, trascura la fisica barionica.
La descrizione completa delle simulazioni utilizzate in questa tesi sarà
data nel Capitolo 2, mentre il Capitolo 10 sarà dedicato alle conclusioni e
prospettive future.
4
http://www.star.uclan.ac.uk/∼cbb/magicc.html
15
16
Chapter 1
Introduction
The Λ Cold Dark Matter (ΛCDM) model is the current cosmological
paradigm of galaxy formation: formulated more than 30 years ago (White
& Rees 1978), it is based on the assumption that the Universe is composed
by a ∼ 68% of dark energy, a ∼ 27% of dark matter and by only a ∼ 5%
of ordinary matter (Planck Collaboration et al. 2013). Cold dark matter
particles, having a mass larger than the keV scale, do not damp small
fluctuations by free streaming, and can satisfactorily explain the observed
properties of galaxies, such as the large amount of power on small scales as
indicated by the galaxies’ two point correlation function (Peebles 1980). The
need for dark matter is also evident from a series of observational constraints
like, amongst other things, the rotation curves of galaxies (Rubin et al. 1980)
and the weak lensing observation of a cluster merger (Clowe et al. 2006).
A direct consequence of the dark matter being cold, which means that
its particles were not relativistic at the epoch of matter-radiation equality, is that structure formation proceed in a bottom-up hierarchical fashion
(Blumenthal et al. 1984). In ΛCDM, small perturbations in the primordial
density field can grow via gravitational instabilities, and then merge with
each other to create the much bigger structures, like clusters and groups
of galaxies, that we observe today. The primordial density perturbations
can be measured directly from the cosmic microwave background (CMB)
radiation, which is the relic thermal radiation of the Big Bang: the power
spectrum of CMB temperature anisotropies, in fact, reflects the small perturbations, or degree of contrast, in the matter density field of the early
universe (Smoot et al. 1992; Spergel et al. 2003; Planck Collaboration et al.
2013). Such perturbations will start collapsing to form the so-called dark
matter haloes, which are the main seeds of all future galaxies, in a process which is highly non-linear and can only be modeled by using numerical
methods, such as N-body simulations of the cosmic density field (Springel
17
2005).
Given some initially unperturbed distribution of particles, and taking
into account the primordial power spectrum as initial condition, one can
model the evolution and gravitational collapse of collisionless, dark matter
only particles from high redshift to z=0, populate dark matter haloes with
galaxies by using semi-analytic models (Monaco et al. 2014; Benson 2011),
and compare the final result with the observed distribution and properties
of galaxies, like the 2dF Galaxy Redshift Survey (Cross et al. 2001). While
dark matter only simulations have successfully reproduced several features
of the Universe at both large (e.g. the Millenium-XXL and MultiDark runs
as in Angulo et al. 2012; Riebe et al. 2013) and galactic scales (e.g. the Local
Group and Milky Way type galaxies as in Gottlöber et al. 2010; Springel
et al. 2008; Brook et al. 2012a), there are still inconsistencies between the
prediction of the ΛCDM model and the observed properties of dwarfs and
satellite galaxies. Indeed on such scales the model is complicated by the
dynamically relevant baryonic physics involved in galaxy formation. In
particular, the main issues that still affect the ΛCDM paradigm at small
scales are:
• the missing satellite problem
• the too big to fail problem
• the core/cusp problem
The missing satellite problem (Klypin et al. 1999a) is the discrepancy
between the number of observed satellite galaxies around our own Milky
Way and Andromeda galaxy and the number of simulated subhaloes found
in N-body simulations, the latter being orders of magnitudes bigger than
the former. Within the Local Group only ∼ 40 bright satellites are observed with M? > 106.5 M (McConnachie 2012; Brook et al. 2014), against
the ∼ 1000 produced by collisionless simulations (Moore et al. 1999). Apart
from current detection limits (Tollerud et al. 2008), a solution to this problem requires to identify a mechanism able to inhibit star formation below a
certain halo mass: reionization in the early universe happening at z=10-6
seems to be a good candidate, since it heats up the gas and prevent its collapse into small haloes (Bullock et al. 2000; Benson et al. 2002; Somerville
2002). Therefore the smallest haloes will never form a visible galaxy, remaining devoid of stars.
Another aspect of the issue is the so-called too big to fail (TBTF) problem, recently highlighted by Boylan-Kolchin et al. (2011, 2012); GarrisonKimmel et al. (2014), and summarized as follow: the kinematics of observed
18
CHAPTER 1. INTRODUCTION
dwarf spheroidals (dShps) of the Milky Way and Andromeda galaxies do
not coincide with the expected kinematic of subhaloes derived from N-body
simulations. The observed stellar velocity dispersion at half-light radius of
most dSphs is lower than 20 km/s (McConnachie 2012; Collins et al. 2014;
Tollerud et al. 2014), fact that would place such galaxies into small haloes,
leaving dark the most massive subhaloes found in simulations; or, in other
words, the most massive subhaloes in N-body simulations are too dense to
host the observed satellite galaxies in the Local Group.
Since the Milky Way and Andromeda galaxies do not seem to be outlier
in this sense (Strigari & Wechsler 2012), no current model of galaxy formation can easily accommodate these results, unless one accepts that galaxy
formation is stochastic below a certain mass scale. A solution would be to
reduce the central densities of subhaloes by means of baryonic mechanisms
such as supernovae driven gas outflows (Governato et al. 2010; Pontzen
& Governato 2012) which will lead to an inner density profile for dark
matter much shallower than the commonly assumed NFW (Navarro et al.
1996b). This scenario would work for the brightest dwarfs, like Fornax with
its L ∼ 2 · 107 L , but it is not clear how the fainter dwarfs, which are
amongst the most dark matter dominated objects in the Universe, could
develop the energy sufficient to create a shallow cored -like distribution in
an initially cuspy, NFW dark matter profile (Garrison-Kimmel et al. 2013).
Moreover, these results are strongly feedback dependent: hydrodynamical
simulations which do not include impulsive gas outflows will inevitably lead
to an adiabatic contraction (Blumenthal et al. 1984; Gnedin et al. 2004) of
the subhaloes as gas cools to its center, causing an even worse picture as we
showed in Di Cintio et al. (2011).
It has been argued, however, that the combination of baryonic processes
together with a subsequent evolution of the subhaloes, taking into account
tidal stripping, could solve the problem (Zolotov et al. 2012; Arraki et al.
2014). Describing the subhaloes with an Einasto profile (Einasto 1965),
allowing for a range of possible shape parameters as a consequence of tidal
stripping (Peñarrubia et al. 2010), would solve the issue (Di Cintio et al.
2013; Vera-Ciro et al. 2013). Reducing the Milky Way’s mass could also
help in lowering the number of massive subhaloes that fail at forming stars
(Wang et al. 2012; Vera-Ciro et al. 2013; Di Cintio et al. 2013). Other
possibilities invoke self-interacting dark matter (Vogelsberger et al. 2012)
or warm dark matter, WDM (Lovell et al. 2012) (see, however, Schneider
et al. 2014).
Finally, also connected to the TBTF problem, is the cusp/core discrepancy (de Blok 2010), namely the fact that observations of real galaxies
find cored profiles for the underlying dark matter density, in disagreement
19
with N-body simulations which, instead, predict that over several orders
of magnitude in radius, the density profiles of dark matter haloes are well
described by a cuspy, NFW model (Navarro et al. 1996b). The central cusp,
ρdm ∼ r−1 , of such model is in tension with observations of disc and dwarf
galaxies in which detailed mass modeling using rotation curves suggests a
flatter, ρdm ∼ const, dark matter density profile (Salucci & Burkert 2000;
Simon et al. 2005; de Blok et al. 2008; Kuzio de Naray et al. 2008a; Oh et
al. 2011a). Cored galaxies are also found within the fainter, dark matter
dominated dwarf spheroidal galaxies surrounding the Milky Way (Walker
& Peñarrubia 2011).
In the last few years it has been increasingly accepted the picture in
which such inconsistency arises from having neglected the effects of baryons
in simulations, which are determinant on small, galactic scales. Many studies have shown how baryons can affect the dark matter (e.g. Tissera &
Dominguez-Tenreiro 1998). Gas cooling to the center of a galaxy causes adiabatic contraction (e.g. Blumenthal et al. 1986; Gnedin et al. 2004), whose
effect strengthens cusps and exacerbates the mismatch between theoretical
profiles and observations. Rather, expanded haloes are required to reconcile
observed scaling relations of both early and late-type galaxies (Dutton et
al. 2007, 2013). Baryons can expand haloes through two main mechanisms
(see Pontzen & Governato 2014 for a recent review): gas outflows driven by
stellar or AGN feedback (Navarro et al. 1996a; Mo & Mao 2004; Read &
Gilmore 2005; Mashchenko et al. 2006; Duffy et al. 2010; Pontzen & Governato 2012; Martizzi et al. 2013) or dynamical friction (El-Zant et al. 2001;
Tonini et al. 2006; Romano-Dı́az et al. 2008; Del Popolo 2009, 2010; Goerdt
et al. 2010; Cole et al. 2011).
While dynamical friction is effective at expanding high mass haloes hosting galaxy clusters, stellar feedback is more effective at expanding low mass
haloes (Governato et al. 2010). Gas cools to the galaxy centre where it forms
stars that, exploding as supernovae, will drive repeated energetic outflows.
Such outflows move enough gas mass to create a core in an originally cuspy
dark halo, due to the dark matter response to the adjusted gravitational
potential. Peñarrubia et al. (2012) calculated the energy required to flatten
a density profile as a function of halo mass. The cusp/core change can be
made permanent if the outflows are sufficiently rapid (Pontzen & Governato
2012). Simulations from dwarf galaxies (Governato et al. 2010; Zolotov et
al. 2012; Teyssier et al. 2013) to Milky Way mass (Macciò et al. 2012) have
produced dark matter halo expansion depending on the implementation of
stellar feedback. Governato et al. (2012) showed that only simulated galaxies with stellar masses higher than ∼ 107 M expand their haloes. They
also showed that the inner dark matter profile slope, γ in ρ ∝ r−γ , flattens
with increasing stellar mass, resulting from the increase of available energy
20
CHAPTER 1. INTRODUCTION
from supernovae. An increase in stellar mass may, however, also deepen
the potential well in the central region of the halo: indeed, we showed in
Di Cintio et al. (2014b) that above a certain halo mass such a deepened
potential well opposes the flattening process.
In Di Cintio et al. (2014b) we propose that γ depends on the stellar−4
to-halo mass ratio of galaxies. At M? /Mhalo <
∼ 10 there is not enough
supernova energy to efficiently change the dark matter distribution, and
the halo retains the original NFW profile, γ ∼ −1. At higher M? /Mhalo ,
γ increases, with the maximum γ ∼ 0 (most cored galaxies) found when
M? /Mhalo ∼3 − 5 × 10⁻³ . The empirical relation between the stellar and
halo mass of galaxies (Moster et al. 2010; Guo et al. 2010) implies that this
corresponds to M? ≈108.5 M and Mhalo ≈1011 M . In higher mass haloes,
the outflow process becomes ineffective at flattening the inner dark matter
density and the haloes have increasingly cuspy profiles.
Using a suite of hydrodynamically simulated galaxies, which cover a
broad mass range and include stellar feedback from supernovae, stellar
winds and young, massive stars, we further show in Di Cintio et al. (2014a)
how it is possible to derive a profile that efficiently describes the distribution of dark matter within the simulated galaxies, from dwarfs to Milky
Way mass.
In the first part of this thesis I am going to focus on the TBTF problem, using the Local Group drawn from the CLUES1 project, a fully Nbody+SPH simulation described in (Gottlöber et al. 2010), in which the
gas dynamic is followed by means of the Smoothed-Particles Hydrodynamics technique.
Chapter 3 and 4 will be devoted to the analysis of the Milky Way and
Andromeda galaxies and of their satellites, as derived from both the dark
matter only and the baryonic run of CLUES. I will show how the inclusion
of baryons in the simulations leads to a twofold effect for what concerns
subhaloes: while satellites with a large baryon fraction will experience an
adiabatic contraction of their haloes, thus worsening the TBTF problem,
those subhaloes with a smaller baryon fraction will undergo a decrease in
Vmax , the peak of their rotation curves, resulting in a kinematic compatible
with the one of the observed dSphs. I will also show how it is possible
to describe the density profile of these subhaloes with an Einasto model
that, having one more free parameter than the usual NFW one, it is able to
capture in a more appropriate way the distribution of dark matter within
such subhaloes: using this profile it is possible to reconcile observations and
simulations.
1
http://www.clues-project.org/
21
Since the number of massive satellites within the virial radius of a host
galaxy is strongly dependent on the mass of the galaxy itself, I will show in
Chapter 5 a method to estimate such mass, and I will apply this method to
the simulated galaxies in CLUES (Di Cintio et al. 2012).
In Chapter 6 I will explore the TBTF problem using WDM simulations,
with a dark matter particle mass of ∼1 keV, showing that, although WDM
is able to reduce the number of structures at small scales, it is still not
sufficient to explain the discrepancy with observations. I will also present
the main differences between a group of galaxies simulated within a ΛCDM
and a ΛWDM context.
In Chapter 7 I will focus on the abundance matching technique in the
Local Group. Using the halo mass function derived from Local Group simulations, like the CLUES ones, it is possible to extend the relation between
stellar mass and halo mass down to the faintest galaxies, like the dSphs.
This relation indicates that the vast majority of the Local Group galaxies
live into dark matter haloes whose mass is bigger than > 1010 M : to reconcile observational data with such a prediction one has to assume that some
of these galaxies have a central dark matter core, i.e. their halo is expanded.
The expansion of dark matter haloes and the cusp/core problem will be
at the center of the second part of my thesis, in which I will use the hydrodynamical simulations from the MaGICC2 project, that include a physical
motivated feedback model. These galaxies provide an excellent match to
the stellar-to-halo mass relation both at z=0 and at higher redshift (Kannan et al. 2013), as well as to a range of present observed galaxy properties
and scaling relations (Brook et al. 2012b; Stinson et al. 2013).
In Chapter 8 and 9 I will describe how the cusp/core transformation depends solely on the M? /Mhalo ratio of each galaxy, and how such prediction
can be used to make comparison with observational data. Moreover, I will
derive a density profile able to reproduce a cored as well as a cuspy dark
matter distribution in galaxies, so that it is appropriate to describe both
dwarfs and spiral galaxies. This profile is completely constrained by the
integrated star formation efficiency within each galaxy, M? /Mhalo at z=0,
and it represents a notable improvement with respect to the usual NFW
profile, which, being derived from N-body simulations, does not take into
account baryonic physics.
The complete description of the simulations used in this thesis will be
given in Chapter 2, while Chapter 10 will be devoted to the conclusions and
the future prospective.
2
http://www.star.uclan.ac.uk/∼cbb/magicc.html
22
Chapter 2
Simulations
In this section we present the cosmological, numerical simulations of
galaxy formation used in this thesis. The first set of simulation, used in
the studies presented in Chapters from 3 to 7, are part of the CLUES1
project. The other set of simulation, used in Chapter 8 and 9, belong to
the MaGICC2 project.
2.1
CLUES simulation
The Local Group (LG) of Galaxies and its environment is the most well
observed region of the Universe. Only in this unique environment we can
study structure formation on scales as small as that of very low mass dwarf
galaxies, resulting in the so-called near-field cosmology.
The Constrained Local UniversE Simulations, CLUES project (Gottlöber
et al. 2010), are a series of constrained cosmological numerical simulations
whose primary goal is to reproduce the observed large scale structures in the
Local Universe, such as the local cosmic web, the Local Supercluster, the
Virgo cluster, the Coma cluster, the Great Attractor and the Perseus-Pisces
supercluster.
2.1.1
Initial conditions and Local Group selection
Initial conditions based on observational data of the nearby Universe
have been used as constraints, in such a way that the resulting simulations closely reproduce the observed Local Universe on scales larger than
1
2
http://www.clues-project.org
http://www.star.uclan.ac.uk/∼cbb/magicc.html
23
2.1. CLUES SIMULATION
≈5 h−1 Mpc (Klypin et al. 2003), while the structures at smaller scales are
hardly affected by the constrained initial conditions, being essentially random. The CLUES project enable to simulate structures at megaparsec and
sub-megaparsec scale within the correct environment. The Local Group and
its galaxies, particularly Milky Way-type objects and associated satellites,
can then be studied within a preferential environment defined by the position and velocity relative to a Virgo-like cluster. Such simulations therefore
serve as the ideal tool for comparing the predictions of theoretical models of galaxy formation, provided that such galaxies are embedded in the
“correct” environment determined by observations.
The technique known as constrained realizations consists in the implementation of the Hoffman-Ribak algorithm (Hoffman & Ribak 1991), which
is used to generate the initial conditions as constrained realizations of Gaussian random fields from observational data. Different observational data are
used to set up the initial conditions. The first set is composed of radial velocities of galaxies drawn from the Mark III Catalog of Galaxy Peculiar Velocities (Willick et al. 1997), the surface brightness fluctuation (SBF) survey
of galaxy distances (Tonry et al. 2001) and the Karachentsev (Karachentsev
et al. 2004) catalog of neighboring galaxies. Peculiar velocities are less affected by non-linear effects and are used as constraints as if they were linear
quantities. The other constraints are obtained from the catalog of nearby
X-ray selected clusters of galaxies (Reiprich & Böhringer 2002): given the
virial parameters of a cluster and assuming the spherical top-hat model one
can derive the linear overdensity of the cluster, which is then imposed on
the mass scale of the cluster itself as a constraint.
As already explained, since these data only constrain scales larger than
a very few Mpc, it is necessary to perform a series of different realizations
in order to obtain one which contains a LG candidate with the correct
properties, such as two main haloes resembling Milky Way and Andromeda
galaxy, with proper position relative to each-other, correct masses , negative
radial velocity, etc. More than 200 realizations of low resolution simulations,
with 2563 particle, were performed and evolved since the starting redshift
z=50 until present time z=0 and the one with the most suitable Local
Group-like object was chosen for follow up, high resolution re-simulations.
To find a LG candidate we first identify in the constrained simulation the
Virgo cluster. Then we search for an object which closely resembles the
Local Group and which is in the right direction and distance to Virgo.
High resolution extension of the low resolution constrained realizations
were then obtained by creating an unconstrained realization at the desired
resolution, FFT-transforming it to k-space and substituting the unconstrained low k modes with the constrained ones. The resulting simulation
24
CHAPTER 2. SIMULATIONS
Figure 2.1: Dark matter distribution within the CLUES Local Universe. Credit:
CLUES collaboration.
is thus composed of unconstrained high k modes (small scales) and fully
constrained low k modes (large scales). Using this technique, we are able
to both accurately constrains the super-LG scales while artificially selecting
sub-LG scales as those most resembling the real LG.
We used the MPI treePM N-body + SPH code Gadget2, developed by
Springel (2005), to simulate the evolution of a cosmological box with side
length of Lbox = 64h−1 Mpc. As mentioned above the region of interest
around the LG has been resimulated using high resolution. We used a
full resolution of 40963 effective particles within a sphere of just 2h−1 Mpc
centered on the LG, with a dark matter particle mass of mDM = 2.95 ×
105 h−1 M . Exterior to the high resolution LG, the simulation box is filled
with lower resolution (higher mass) particles. Fig. 2.1 shows the large scale
dark matter density distribution of the Local Universe simulation, with a
circle showing the position of our Local Group, and a smaller panel showing
the detailed structure of the simulated Local Group.
25
2.1. CLUES SIMULATION
Within the CDM scenario, we used two sets of cosmological parameters,
according to a WMAP3 (Spergel et al. 2007) and a WMAP5 (Komatsu et
al. 2009) cosmologies. The WMAP3 parameters are Ωm = 0.24, Ωb = 0.042,
ΩΛ = 0.76, a normalization of σ8 = 0.73 and a slope of the power spectrum
of n = 0.95. The WMAP5 parameters are Ωm = 0.279, Ωb = 0.046, ΩΛ =
0.721, a normalization of σ8 = 0.817 and a slope of the power spectrum of
n = 0.96.
We use the same set of initial conditions to run two simulations, a DM
only, pure N-body run and a SPH run which includes gas dynamics, cooling,
star formation and supernovae feedback as in Springel & Hernquist (2003).
Gas particles are included in the initial conditions by replacing each high
resolution dark matter particle by an equal mass, gas-dark matter particle
pair with a with a mass ratio of roughly 1:5. The dynamics of gas particles
are then determined by using the lagrangian method of Smoothed Particle
Hydrodynamics, built into Gadget2. The gravitational softening length is
= 0.1h−1 kpc in both the DM only and the SPH run.
Within this environment we identified haloes and subhaloes using the
AMIGA halo finder, AHF, better described in Section 2.3. The main haloes
identified in the CLUES simulations formally correspond to the Milky Way
and the Andromeda galaxy, whose main properties will be fully described
in the next chapters of this thesis.
In Fig.2.2 we show the gas distribution within the Local Group around
the three main galaxies representing the Milky Way (MW), Andromeda
(M31) and the Triangulum galaxy (M33). The size of the plot is about
2h−1 Mpc across, viewed from a distance of 3.3h−1 Mpc. Within the three
smaller panels we show the gas disks of such galaxies as seen from a distance
of 250h−1 kpc, the size of the plot being about 50h−1 kpc. The M31 and
MW disks are smaller than the disk of M33 due to major mergers which
these objects had recently (∼ z=0.6). The spiral features of the MW are
clearly visible. Dark colors indicate low density of the gas and bright colors
high density regions. The colors and density range are adjusted such that
the faint structures and filaments connecting the three main galaxies, and
the spiral arm features of the gas disks become visible.
To summarize, we have at our disposal a DM-only and a corresponding SPH simulation of a zoomed-in region of 2h−1 Mpc around the LG,
performed within the concordance CDM model using two different sets of
cosmological parameters, based on WMAP3 and WMAP5 results.
26
CHAPTER 2. SIMULATIONS
Figure 2.2: The gas distribution in the simulated CDM Local Group, for a
WMAP3 cosmology. Smaller panels represent MW, M31 and M33. Credit: A.
Khalatyan, using PMViewer http://pmviewer.sourceforge.net.
27
2.1. CLUES SIMULATION
2.1.2
Star formation and feedback
In the SPH run we use the star formation and feedback rules of Springel
& Hernquist (2003).
The interstellar medium (ISM) is modeled as a two phase medium composed of hot ambient gas and cold gas clouds in pressure equilibrium. The
thermodynamic properties of the gas are computed in the presence of a uniform but evolving ultra-violet cosmic background generated from QSOs and
AGNs and switched on at z=6 (Haardt & Madau 1996). Cooling rates are
calculated from a mixture of a primordial plasma composition. No metal
dependent cooling is assumed (this is slightly inconsistent as gas particles
are metal enriched due to supernovae explosions). We assume that cold gas
cloud formation by thermal instability, star formation, the evaporation of
gas clouds, and the heating of ambient gas by supernova driven winds all
occur at the same instant. Each star formation event injects energy and
metals into the ISM instantaneously.
We treat star formation stochastically, in order to reproduce the KennicutSchmidt law for spiral galaxies (Kennicutt, 1983, 1998). The first time a
gas particle undergoes star formation, we create a star particle of half the
gas particle’s mass, reducing the gas particle’s mass appropriately. The second episode of star formation results in the gas particle converting all its
remaining mass into a star particle. Thus all star particles (first and second
generations) have the same mass of mSTAR = 2.21 × 10⁴ h−1 M while gas
particles have either their full original mass of mGAS = 4.42 × 10⁴ h−1 M ,
or half their original mass.
We assume kinetic feedback in the form of strong winds driven by SNe
explosions using the stochastic approach developed by Springel & Hernquist
(2003). All SPH particles in the vicinity of the star forming regions participate in the wind in a probabilistic way that is proportional to the star
formation rate and the amount of supernova energy released by massive
stars. We assume that a fraction of stars will explode as Supernovae. A
fraction of this energy is then used to energize, kick, particles in the high
density regions surrounding sites of star formation. This kinetic feedback
removes low angular momentum gas from the center of DM haloes, thus
allowing the formation of extended gaseous disk by preventing the so-called
“overcooling problem”. This mechanism has been tested and found it to be
crucial in the production of stable disks containing both gas and stars.
Each star is given the metallicity of the gas particle that spawned it.
We calculate a luminosity by using the stellar population synthesis model
STARDUST (see Devriendt et al. (1999) and references therein). This
model computes the spectral energy distribution from the far-UV to the
28
CHAPTER 2. SIMULATIONS
radio, for an instantaneous starburst of a given mass, age and metallicity.
The stellar contribution to the total flux is calculated assuming a Kennicutt
initial mass function (Kennicutt 1998).
2.1.3
Cold versus Warm Dark Matter CLUES
In addition to these simulations, and for the WMAP3 case, we also
performed a DM+SPH run assuming a warm dark matter (WDM) scenario,
specifically using a particle with mW DM = 1 keV.
Within the WDM model initial perturbations below a certain mass can
not collapse and the smallest structures to form out of gravitational instabilities are fairly large. This happens because the temperature of the DM
particle at decoupling, specifically, whether it was relativistic or not, can
cause the DM particle to escape from and erase the underlying density fluctuation. Particles with a keV mass (WDM) would become non-relativistic
much later than particles with GeV-TeV mass (CDM), therefore having a
bigger free-streaming length: in fact, WDM particles have a free-streaming
length similar to a protogalaxy, and they are able to inhibit the formation
of small structures by gravitational collapse.
In Fig. 2.3 we show the linear matter power spectrum used to set up
initial conditions for the CDM and WDM models with particle mass of ∼1
keV, as a function of wavenumber . The k interval actually used to generate
the realizations of the initial conditions is also shown, from k = 2π/B to
k = N 1/3 π/B where B = 64h−1 Mpc and N = 40963 . The initial conditions
are generated by rescaling the CDM power spectrum and fitting it with an
approximation to the transfer function representative of the free streaming
effect of WDM particles (Viel et al. 2005). The free-streaming length of
such a WDM particle is 0.35h−1 Mpc, which corresponds to a filtering mass
of 1.1 × 10¹⁰ h−1 M (Bode et al. 2001): the WDM power spectrum, shown
in Fig. 2.3, thus contains a sharp cut-off at the corresponding wavelength
k free-streaming length. Smaller WDM particle masses would result in a
greater suppression of the power spectrum on small scales (large k).
A comparison of the properties of MW, M31 and M33 alongside CDM
and WDM simulations will be presented in Chapter 6.
2.1.4
Previous results with CLUES
The CLUES simulations have already been extensively used to study
details of the Local Group of galaxies. Some of the results based on CLUES
include the study of radial distribution (Libeskind et al. 2010) and radial
29
2.2. MAGICC SIMULATION
100
10
1
0.1
0.01
0.001
0.1
1
10
100
k (h / Mpc )
Figure 2.3: Cold (black) and warm (red) dark matter power spectrum. Credit:
CLUES collaboration.
alignment of substructures (Knebe et al. 2010), the preferential infall of
satellite galaxies (Libeskind et al. 2011b), the luminosities of backsplash
galaxies (Knebe et al. 2011c,b), the differences between the stellar and DM
halo (Libeskind et al. 2011a), the assembly properties of the Local Group
(Forero-Romero et al. 2011), the the Milky Way and Andromeda progenitors
visible as Lyman Alpha emitters (Dayal & Libeskind 2012) and the large
scale structures’ formation using a catalog of peculiar velocities (Sorce et
al. 2014).
More recent studies using the CLUES simulations will be discussed
through this thesis.
2.2
MaGICC simulation
The Making Galaxies in a Cosmological Context (MaGICC) project
(Stinson et al. 2013; Brook et al. 2012b) is a series of numerical hydrodynamical simulation of isolated galaxies, devoted to reproduce the main
observational features of galaxies spamming a wide range of masses, from
dwarf size to Milky Way-like objects, i.e. low, medium and high mass galaxies.
Previous generation of hydrodynamical simulations have failed at repro30
CHAPTER 2. SIMULATIONS
ducing the main properties of galaxies, such as the stellar mass versus halo
mass relation and the angular momentum of spirals. These issues are often
referred as overcooling problem and the angular momentum catastrophe.
The main goal of the MaGICC simulations is to produce realistic galaxies, which lie on the M? /Mhalo relation (Guo et al. 2010; Moster et al. 2010),
by use of physically motivated recipes for star formation and feedback.
2.2.1
Initial conditions from MUGS simulations
The initial conditions for the galaxies are taken from the McMaster
Unbiased Galaxy Simulations (mugs), which is described in Stinson et al.
2010. mugs is a sample of 16 zoomed-in regions where ∼L? galaxies form
in a cosmological volume 68 Mpc on a side. mugs used a ΛCDM cosmology
with H0 = 73 km s−1 Mpc−1 , Ωm = 0.24, ΩΛ = 0.76, Ωbary = 0.04 and
σ8 = 0.76 (WMAP3, Spergel et al. 2007).
Initially, galaxies are selected from a cosmological cube of 68 Mpc on a
side containing 2563 dark matter particles evolved to z=0. Some specific
region of such a cosmological volume are then selected in order to be resimulated with higher resolution, while the surrounding volume provides the
large scale density waves and impart tidal torques on the region of interest
(Quinn & Binney 1992). The regions chosen for higher resolution are the
ones with a mass between 5×10¹¹ M and 2×10¹² M which evolved at least
2.7 Mpc away from any halo more massive than 5 × 10¹¹ M . Out of the
36,193 haloes found with friends-of-friends, 761 were in the right mass range,
and 276 of those were sufficiently isolated. From this sample, 9 haloes are
randomly selected regardless of spin parameter or merger history. Finally,
particles within 5Rvir of each group’s center at z=0 were traced to their
positions in the initial conditions, and the central region was filled with a
regular grid of particles to achieve an effective resolution of 20483 at the
center. Surrounding the non-spherical central region is a spherical region
with a radius 1.2 times the maximum radius of the central region. This
immediately surrounding region is populated with particles for an effective
resolution of 5123 . Outside this are three spherical regions equally spread
in radius with effective resolutions of 2563 , 1283 , and 643 . The outskirts
of the 68 Mpc cube are filled at an effective resolution of 323 . Each of
these regions contains progressively more massive particles corresponding
to the reduced resolution. In the high resolution region, dark matter particles have a mass of 1.1 × 10⁶ M . The regular grids of particles in each
region were perturbed using the Zel’dovich approximation with subsampled
force resolutions matching the particle resolutions. This dark matter-only
configuration was evolved to z=0.
31
2.2. MAGICC SIMULATION
The initial conditions of the medium and low mass galaxies are scaled
down variants of such high mass ones, so that rather than residing in a
68 Mpc cube, they lie within a cube with 34 Mpc sides (medium) or 17
Mpc sides (low mass). This rescaling allows us to compare galaxies with
exactly the same merger histories at three different masses. Differences in
the underlying power spectrum that result from this rescaling are minor
(Springel et al. 2008; Maccio’ et al. 2008; Kannan et al. 2012). This assures
us than any result derived from such sample will not be driven by the specific
merger history. These DM-only runs exhibit a wide range of concentrations,
from those typical of the L? to dwarf galaxies.
In addition to the collisionless, dark matter-only simulations we performed hydrodynamical, SPH simulations for each initial condition. Within
the 68 Mpc box the gas particles have an initial mass of 2.2 × 10⁵ M , while
stars form with a mass of 6.3 × 10⁴ M .
Each particle uses a gravitational softening length of 312.5 pc. Our
galaxies were simulated using Gasoline (Wadsley et al. 2004), a fully parallel, gravitational N-body + smoothed particle hydrodynamics (SPH) code.
Cooling via hydrogen, helium, and various metal-lines in a uniform ultraviolet ionizing background is included as described in Shen et al. (2010).
2.2.2
Star formation and feedback
The hydrodynamical simulations use the stochastic star formation recipe
described in Stinson et al. (2006), in such a way that, on average, they
reproduce the empirical Kennicut-Schmidt Law (Schmidt 1959; Kennicutt
1998).
Gas is eligible to form stars when it reaches temperatures below T=15000
K and it is denser than n > nth . Two different density thresholds are used
for star formation, nth =0.1 and 9.3 cm−3 , which is the maximum density at
which gravitational instabilities can be resolved (32mgas /3 ) . Gas denser
than nth is then converted to stars in a probabilistic manner according to
the Kennicut-Schmidt law:
∆M?
mgas
= c?
∆t
tdyn
(2.1)
where ∆M? is the mass of the stars formed in ∆t, the time between star
formation events (0.8 Myr in these simulations), mgas is the mass of the gas
particle, tdyn is the gas particle’s dynamical time, and c? is the fraction of
gas that will be converted into stars during tdyn . c? is ultimately the free
32
CHAPTER 2. SIMULATIONS
parameter that sets the balance of the baryon cycle off cooling gas, star
formation, and gas heating. In the fiducial runs c? = 0.17.
Stars feed energy back into surrounding gas. In hydrodynamical simulations, two methods are commonly used to model stellar feedback. One is
kinetic feedback, which consists in adding velocity kicks to gas particles to
remove them from the inner regions of galaxy disks (Springel & Hernquist
2003). The other method is thermal feedback, in which stars simply heat
the gas particles around them and allow the adiabatic work of the particles
to push other gas out of the way (Stinson et al. 2006).
Type II Supernovae (SNII) prevent more gas from collapsing, effectively
regulating star formation in our simulations because of their ability to heat
volumes of the interstellar medium near the site of star formation (Silk 2003)
Since the blastwave shocks of SNII convert the kinetic energy of ejecta into
thermal energy on scales smaller than our simulations resolve, feedback in
our simulations is purely thermal. The number of supernovae produced by
a star particle depends on the initial mass function of the stars that form,
and in our simulations we use two different IMF, a Kroupa IMF (Kroupa et
al. 1993) and a Chabrier one (Chabrier 2003). The Chabrier IMF produces
two times more type SNII per mass of stars born.
Supernova feedback is implemented using the Stinson et al. (2006) blastwave formalism, depositing ESN ×1051 erg into the surrounding ISM at the
end of the lifetime of stars more massive than 8 M . The blastwave solution, based on Chevalier (1974) and McKee & Ostriker (1977), provides the
maximum radius to which the blastwave explosion will extend as well as the
maximum time that the blastwave will keep the surrounding gas hot. Since
stars form in dense regions, the cooling times of the gas are short and the
gas will quickly radiate away all the supernova energy due to the efficient
cooling (Katz 1992). For this reason, cooling is disabled for particles inside
0.32 −0.16 −0.20
a blast region of size R = 101.74 E51
n0 P04 pc and for the length of
0.32 0.34 −0.70
time t = 106.85 E51
n0 P04 yr. Here, E51 = 1051 erg, n0 is the ambient
hydrogen density, and P04 = 10−4 P0 k −1 , where P0 is the ambient pressure
and k is the Boltzmann constant. Both n0 and P0 are calculated using the
SPH kernel for the gas particles surrounding the star.
Metals are ejected from Type II supernovae (SNeII), Type Ia supernovae
(SNeIa), and the stellar winds driven from asymptotic giant branch (AGB)
stars, and distributed to the nearest gas particles using the smoothing kernel (Stinson et al. 2006). The metals can diffuse between gas particles as
described in (Shen et al. 2010).
33
2.2. MAGICC SIMULATION
2.2.3
Early stellar feedback
In addition to the common supernovae feedback, radiation energy from
massive stars is also considered in order to provide a more complete model
of stellar feedback.
The energy from high mass stars is introduced immediately after stars
form based on how much star light is radiated.
Such energy could be considered using a kinetic scheme where the radiation pressure drives winds out of massive star clusters (Hopkins et al.
2011). However a kinetic implementation of feedback requires many particles to represent a molecular cloud, resolution that we do not have within
the MaGICC simulations, in which only one or a few particles represent a
molecular cloud. Therefore the isotropic thermal pressure is used.
During the 4.5 Myr after stars form and before the first supernova explodes, such thermal feedback from young, massive stars is implemented
using a fraction, esf , of the total luminosity emitted by the stars. The
luminosity of stars is modelled with a simple fit of the mass-luminosity
relationship observed in binary systems (Torres 2010):
L
=
L
(
(M/M )4 , M < 10 M
100 (M/M )2 , M > 10 M
(2.2)
Typically, this model corresponds to the emission of 2 × 1050 erg per M of
the entire stellar population over the ∼4.5 Myr between a star’s formation
and the commencement of SNeII in the region. These photons do not couple
efficiently with the surrounding ISM (Freyer et al. 2006). To mimic this
highly inefficient energy coupling, we inject esf of the energy as thermal
energy in the surrounding gas.
Such thermal energy injection is highly inefficient at the spatial and
temporal resolution of cosmological simulations (Katz 1992; Kay et al.
2002), as the characteristic cooling timescales in the star forming regions
are lower than the dynamical time. Since massive young stars radiate a
large amount of energy cooling is not turned off: after heating the gas
to T > 106 K, the gas rapidly cools down to 104 K, which creates a lower
density medium. Though the dynamical effect is minimal, early stellar feedback effectively halts star formation in the region immediately surrounding
a recently formed star, providing pressure support and increasing gas temperatures above the star formation threshold to decrease star formation.
Using esf = 10% limits star formation to the amount prescribed by the
stellar-to-halo mass relationship.
34
CHAPTER 2. SIMULATIONS
Figure 2.4: Scaling relations of the simulated galaxies superimposed on observational data from Courteau et al. (2007). From top left to bottom right: the
stellar mass against total mass; the rotational velocity against luminosity in the
I-band (the Tully-Fisher relation); the disc scale-length against luminosity; the
disc scale-length against rotational velocity. Credit: Brook et al. (2012b)
2.2.4
Previous results with MaGICC
It has been shown in Brook et al. (2012b) that the MaGICC simulations
are able to reproduce a variety of scaling relations of galaxies spanning a
wide range in masses. We show such scaling relations in Fig. 2.4, where the
fiducial runs are shown as yellow diamonds, the low resolution runs as green
diamonds and the low feedback run as a red triangle. The low feedback
case was run with a star formation threshold of 1 cm−3 , a Kroupa et al.
(1993) IMF, 0.4×1051 erg deposited per supernova explosion and without
early stellar feedback. It is evident how this low feedback model, which
is comparable to most of the feedback implementations currently in the
literature (Scannapieco et al. 2012), is not sufficient to reproduce properties
of observed galaxies.
The fiducial feedback, instead, includes a Chabrier (2003) IMF, a 1×1051
35
2.2. MAGICC SIMULATION
Figure 2.5: Face-on and edge-on images of the fiducial galaxy at z=0 in 8 different
bands. The images are 50 kpc on a side and were obtained using the radiative
transfer code GRASIL (Domı́nguez-Tenreiro et al. 2014), which includes a careful
modelling of the dust component of the interstellar medium. Credit: Aura Obreja
& Rosa Domı́nguez-Tenreiro.
erg from SNe, a nth = 9.3cm−3 and 10% of early stellar feedback: it provides
a perfect match to several galaxy properties. In Fig. 2.5 a galaxy of M? =
2.3 × 10¹⁰ M is shown, run with such fiducial feedback. The recent transfer
code GRASIL (Domı́nguez-Tenreiro et al. 2014) has been used for this image.
The MaGICC simulations, firstly run in the 2012, have been extensively used in the past two years to produce a number of studies, amongst
which: the baryon cycle within galaxies (Brook et al. 2013b), the lowest
metallicity stars in the LMC (Brook et al. 2013a), the effect of dark energy on galaxy formation (Penzo et al. 2014), the statistical properties of
high-redshift galaxies (Kannan et al. 2012), the effects of warm dark matter
in hydrodynamical simulations (Herpich et al. 2014) and the fundamental
metallicity relation of galaxies (Obreja et al. 2014).
Other results coming from the MaGICC simulations will be discussed
through this thesis.
36
CHAPTER 2. SIMULATIONS
2.3
AHF halo finder
In order to identify haloes and subhaloes in our simulation, both the
CLUES and MaGICC ones, we have run the MPI+OpenMP hybrid halo
finder AHF3 described in detail in Knollmann & Knebe (2009). AHF is an
improvement of the MHF halo finder (Gill et al. 2004a), which locates local
overdensities in an adaptively smoothed density field as prospective halo
centers. We would like to stress that our halo finding algorithm automatically identifies haloes, sub-haloes, sub-subhaloes, etc. and it can reliably
recover substructures containing at least 30 particles (Knebe et al. 2011a).
As each pair of simulations, N-body and SPH, starts with the same initial conditions (apart from the baryons) we can match individual haloes
and subhaloes in the DM only simulation with a “sister” halo (subhalo) in
the SPH run (see Libeskind et al. 2010). In fact, this cross identification
pairs subclumps at z=0 that originated from the same overdensity in the
initial conditions. The AHF MergerTree package is used to identify corresponding objects in the same simulation at different redshifts. We follow
each halo (either host or subhalo) identified at redshift z=0 backwards in
time, identifying as the main progenitor the halo that both shares the most
particles with the present halo and is closest in mass. Subhaloes will be
followed correctly along their orbits within the environment of their respective host until the point where they either are tidally destroyed or directly
merge with the host. For more details on the mode of operation and actual
functionality we though refer the reader to the code description paper by
Knollmann & Knebe (2009), while an in-depth comparison to other halo
finding techniques can be found in Knebe et al. (2011a) and Onions et al.
(2012).
2.3.1
Haloes and subhaloes definition
The virial mass of each halo is defined as the mass of a sphere containing
∆ times the critical matter density of the Universe ρcrit = 3H 2 /8πG at
z=0. Typical choices of ∆ are ∆200 = 200 or ∆vir = 18π 2 + 82x − 39x2 at
z=0 (Bryan & Norman 1998), where x = Ωm − 1 depends on the selected
cosmology. The corresponding halo mass will thus be defined as:
4
M = πR3 ∆ρcrit
3
(2.3)
where M and R indicate M200 and R200 or Mvir and Rvir , according to
the overdensity criterion.
3
AMIGA halo finder, to be downloaded freely from http://www.popia.ft.uam.es/AMIGA
37
2.3. AHF HALO FINDER
Subhaloes are defined as haloes which lie within the virial radius of a
more massive halo, the so-called host halo. As subhaloes are embedded
within the density of their respective host halo, their own density profile
usually shows a characteristic upturn at a radius rt < rvir , where rvir would
be their actual virial radius if they were found in isolation: we therefore
calculate subhaloes properties using particles within such radius rt .
38
Chapter 3
Massive, dense dark matter
subhaloes of the Milky Way
Using Constrained Local UniversE Simulations (CLUES) of the formation of the Local Group in a cosmological context we investigate the recently
highlighted problem that the majority of the most massive dark subhaloes
of the Milky Way are too dense to host any of its bright satellites (BoylanKolchin et al. 2011). In particular, we examine the influence of baryonic
processes and find that they leave a twofold effect on the relation between
the peak of the rotation curve and its position (Vmax and Rmax ). Satellites
with a large baryon fraction experience adiabatic contraction thus decreasing Rmax while leaving Vmax more or less unchanged. Subhaloes with smaller
baryon fractions undergo a decrease in Vmax possibly due to outflows of material. Furthermore, the situation of finding subhaloes in simulations that
lie outside the confidence interval for possible hosts of the bright MW dwarf
spheroidals, appears to be far more prominent in cosmologies with a high
σ8 normalisation and depends on the mass of the host. We conclude that
the problem cannot be simply solved by including baryonic processes and
hence demands further investigations.
3.1
Introduction
The Λ Cold Dark Matter (ΛCDM) model, first explored more than two
decades ago (Davis et al. 1985), has been very successful in explaining a
multitude of observations at cosmological scales, such as anisotropies of
Cosmic Microwave Background radiation (CMB) Jarosik & et al. (e.g. 2011)
and galaxy clustering on large scales (e.g. Cole & et al. 2005). However, on
smaller, galactic scales the tests of the ΛCDM model are complicated by
39
3.1. INTRODUCTION
the baryonic physics involved in galaxy formation. Therefore, testing the
currently accepted concordance model at these scales is necessary in order
to not only understand the nature of dark matter but also the accuracy of
the model itself.
The validity of the ΛCDM model on galactic scales is still being questioned due to the discrepancy between the number of observed satellites and
the number of predicted dark matter subhaloes. High resolution simulations
of galactic-size haloes resolve a substantial number of substructures within
the virial radius, as first pointed out by Klypin et al. (1999a) and Moore et
al. (1999), and recently reviewed by Kravtsov (2010) and Bullock (2010).
The most popular interpretation of this so-called ”Missing Satellite Problem” requires that the smallest dark matter haloes are inefficient at forming
stars (e.g. Bullock 2010; Kravtsov 2010). Mechanisms such as early reionization of the intergalactic medium and supernovae feedback have been invoked
to identify the halo mass scale where the galaxy formation starts to be inefficient (Bullock et al. 2000; Somerville 2002; Benson et al. 2002), partially
solving the problem. Furthermore, the detection of satellites is most certainly biased because of current detection limits (Tollerud et al. 2008; Walsh
et al. 2009).
There is yet another aspect of the satellite population that needs to be
addressed: the mismatch between the predicted and inferred distribution of
Vmax values at the high-Vmax end as recently highlighted by Boylan-Kolchin
et al. (2011), where Vmax measures the peak of the rotation curve of subhaloes. Using the Aquarius simulations (Springel et al. 2008) and the Via
Lactea II simulation (Diemand et al. 2008) they found that the majority of
the most massive subhaloes (i.e. the high-Vmax objects) of the Milky Way
are too dense to host any of its bright satellites.
There are a number of ways in which this discrepancy may be resolved:
the subhalo mass function of the Milky Way could be a statistical anomaly
with respect to the ΛCDM expectations (Liu et al. 2010; Guo et al. 2011),
or the fundamental assumption that the luminosities of the satellites are
not monotonically related to the mass of the subhaloes does not hold true.
In response to the claims by Boylan-Kolchin et al. (2011), Lovell et al.
(2012) explored the possibility that warm rather than cold dark matter
can provide a better match to the inferred distribution of satellite circular
velocities. With a power spectrum suppressed at masses below ∼ 1010 M
(corresponding to a warmon mass of 2 keV), they found that a warm dark
matter model naturally produces haloes that are less concentrated than
their cold dark matter counterparts. The attempt to explain the evolution
of small scale structures in the local universe with a ΛWDM model was
40
CHAPTER 3. MASSIVE, DENSE DARK MATTER SUBHALOES OF THE
MILKY WAY
already presented in Tikhonov et al. (2009). However, this is only one
possible solution to the problem.
Baryonic processes will most certainly also affect the dark matter distribution. Blumenthal et al. (1986) showed that dissipative baryons will
lead directly to the adiabatic contraction of the halo increasing its central
density, thus being a critical ingredient to determine subhalo properties.
However, the possibility that the influence of baryons will lead to a flattening of the dark matter central density cusp (through dynamical friction
of infalling substructures composed of dark matter and baryons) has, for
instance, been suggested by El-Zant et al. (2001) and further studied in
Romano-Dı́az et al. (2008). Another way in which the haloes’ density can
be reduced is through sudden mass outflows that can alter substantially the
central structure, as suggested by Navarro et al. (1996a). In a recent work
of Parry et al. (2012) this last scenario has been tested by following the
evolution of one simulated satellite, with promising results. The same authors though also showed that the inclusion of baryons in simulations does
not seem to have any correlation with the increase or decrease of the dark
matter central density.
In this work we directly address the issue of the Vmax problem in ΛCDM
simulations by comparing two identical simulations with each other: one
that is solely based upon dark matter physics and another incorporating all
the relevant baryonic physics. These simulations form part of the CLUES
project1 , in which the initial conditions are set by imposing constraints
derived from observational data of the Local Group. The main feature of
using constrained simulations is that it provides a numerical environment
that closely matches our actual neighborhood.
3.2
Simulation details
In this work we use high resolution, constrained simulations of the Local
Group run with a WMAP3 cosmology, with a dark matter particle mass
of mDM = 2.1 × 10⁵ h−1 M . For this particular study we further use a
gas dynamical SPH simulation started with the same initial conditions,
in which we additionally follow the feedback and star formation rules of
Springel & Hernquist (2003). The gas particle mass in this case is mgas =
4.42 × 10⁴ h−1 M and the star particle is mstar = 2.21 × 10⁴ h−1 M .
The simulations are fully described in Section 2.1 Note that the results presented through the study will only refer to the specific SF/feedback
1
http://www.clues-project.org
41
3.3. RESULTS
model of Springel & Hernquist (2003): other formalisms might lead to different conclusions, and we hope to address this issue in the future.
In addition we also have at our disposal a dark matter only CLUES
simulation based upon the WMAP5 cosmology (Komatsu et al. 2009) whose
details have been presented already in Section 2.1 and Section 5.2; here it
suffices to know that this simulation has the same formal resolution as the
WMAP3 one, and it has also been re-simulated within a sphere of 2h−1 Mpc
radius, i.e. the primary difference between the two simulations is merely
the cosmology.
3.3
Results
In order to most closely match the results presented by Boylan-Kolchin
et al. (2011) and not to be contaminated by numerical effects we limited
the subhaloes used throughout the study to those within 300kpc from their
respective host and more massive than Msub > 2 · 108 M h−1 . We further
stack the data for the two most massive hosts representing our MW and
M31 galaxies.
In Fig. 3.1 we show the relation between Rmax and Vmax for the WMAP3
simulation alongside the 1σ confidence region of the known Milky Way
satellites, assuming that the mass density profile of the subhaloes containing
the nine observed dwarf spheroidal follows a NFW profile (Navarro et al.
1996b): the two solid lines in Fig. 3.1 (and 3.2) thus limit the area consistent
with the observed half-light radii and masses of these dwarfs, based on the
work of Wolf et al. (2010). The diamonds represent the subhaloes in the
dark matter only simulation while the crosses are the satellite galaxies in
the SPH run. The lines connect the sister haloes, i.e. those objects that
could be cross-identified in the two simulations. Please note that not all
subhaloes could be cross-identified and hence only a certain number of them
are connected by arrows. The results for the WMAP5 (dark matter only)
data are presented separately in Fig. 3.2.
The results of these plots are quite interesting. First of all we notice
that massive subhaloes (i.e. high-Vmax objects) appear to be outside the
observational range only in the case of the WMAP5 cosmology. This is
thus in agreement with the findings of Boylan-Kolchin et al. (2011) whose
Fig.2 shows both the Aquarius and Via Lactea II simulation data combined.
The latter run used a σ8 = 0.74 which is close to our WMAP3 value. Note
that for this simulation the subhaloes are found only marginally outside the
observational confidence interval. However, note that the actual Vmax values
for the subhaloes depend on the host mass and Vmax,host , respectively (cf.
42
CHAPTER 3. MASSIVE, DENSE DARK MATTER SUBHALOES OF THE
MILKY WAY
Figure 3.1: The relation between the peak of the rotation curve Vmax and its
position Rmax for the WMAP3 simulations: the diamonds are DM only subhaloes,
the cross represent baryonic SPH subhaloes. The two solid lines delimite the 1σ
confidence interval of the observed bright Milky Way dwarf spheroidal galaxies,
as in Boylan-Kolchin et al. (2011). The arrows connect the DM-SPH sister pairs
found following the matching haloes procedure of Libeskind et al. (2010).
43
3.3. RESULTS
Figure 3.2: The same as Fig. 3.1 but for the WMAP5 (dark matter only) simulation.
44
CHAPTER 3. MASSIVE, DENSE DARK MATTER SUBHALOES OF THE
MILKY WAY
Reed et al. 2005; Diemand et al. 2007; Springel et al. 2008). Therefore, in order to better compare the WMAP5 to the WMAP3 simulation, we scaled the
W M5
W M3
W M5
(not
/Vmax,host
, by the ratio Vmax,host
subhaloes’ maximum velocities, Vmax,sub
presented here) where the respective values are Vmax,MW = 131, Vmax,M31 =
128 for WMAP3, and Vmax,MW = 178, Vmax,M31 = 194 for WMAP5 (all in
km/s). We find that this re-normalization leads to a ≈ 30% decrease of
W M5
the Vmax,sub
values, bringing them into agreement with the WMAP3 results.
In that respect, the two dark matter only simulations are in fact not too
different!
More importantly, we see in Fig. 3.1 that the inclusion of baryonic
physics does not solve the problem of the massive and highly concentrated
dark matter subhaloes. On the contrary subhaloes with baryons appear to
be down-shifted in the Rmax -Vmax plane with respect to their dark matter
counterpart, sometimes even entering the regime outside the observational
constraints only in the SPH run. However, we also find that the lower-Vmax
objects seem to be shifted in the direction anticipated by Boylan-Kolchin
et al. (2011), i.e. to the upper left of the plot. There appear to be two
competing effects moving subhaloes in the Rmax -Vmax plane.
The six SPH (sister) subhaloes that are outside the confidential range
have a smaller Rmax than their DM only companion: the addition of baryons
causes a contraction of the halo. This effect is also visible for three SPH
(sister) subhalo inside the observational area and is readily explained by
the physical phenomenon of adiabatic contraction (Blumenthal et al. 1986;
Gnedin et al. 2004). We confirm that the baryon fraction fb = Ωb /Ωm of
those subhaloes moving downwards is higher than for the subhaloes shifted
to the upper left. On average, the baryon fraction of the nine (sister) SPH
subhaloes, whose Rmax is reduced with respect to their DM counterpart, is
fb /fb,cosmic ∼ 0.314, while the mean fb of the SPH subhaloes inside the 1σ
area whose Rmax increases is fb /fb,cosmic ∼ 0.006, i.e. substantially smaller.
The subhaloes with high fb experience adiabatic contraction and the majority of these objects are the ones with the initial highest Rmax – Vmax
pairs.
To confirm this last point, we used the CONTRA code (Gnedin et al. 2004)
to calculate the adiabtic contraction of a dark matter halo in response to
condensation of baryons. Using our numerical data as input parameters, we
found that adiabatic contraction is actually efficient only for those subhaloes
with sufficiently high fb , as expected: the amount of the Rmax reduction
computed this way perfectly matches the observed shifts in Fig. 3.1.
Instead, for the lower Vmax sister subhaloes (with substantially smaller
baryon fractions) the baryonic matter has the capability to lower the maximum velocity of the rotation curves, while increasing Rmax . This has already
45
3.3. RESULTS
Figure 3.3: Rotation curves of ten sister pairs of massive subhaloes. In each panel
the velocity profile of a pair of DM and SPH subhaloes is presented. The actual
values of Vmax -Rmax are plotted as asterisks.
been claimed in previous works and may be due to different mechanisms.
In particular, we like to highlight the mass outflow model of Navarro et
al. (1996a): immediate expulsion of a large fraction of baryonic material
during star formation could be the cause of the creation of a central dark
matter core, which will move the peak of the rotation curve to larger radii.
This model has been successfully tested by Parry et al. (2012) who followed
the formation history of a single stellar dominated satellite, which undergoes the sequence of events predicted by Navarro et al. (1996a). Another
possible explanation to end up with less concentrated density profiles, is
through the mechanism described by Mashchenko et al. (2006). A random
bulk motion of gas, driven by stellar feedback, results in a flattening of
the central DM cusps, thus leading to DM densities smaller than predicted
by pure DM cosmological models. But why is it that those objects with
low baryon fractions are the ones that require the aforementioned mechanisms? Is it that the gas expulsion has already occurred, thereby lowering
the baryon fraction? Possibly the baryon fraction is only low at redshift
z = 0 because of mass losses during the subhaloes history? Lately, Nickerson et al. (2011) explored the effect of several baryon loss mechanisms on
subhaloes in SPH simulation of a Milky Way like galaxy, too: they found
that for the subhaloes which ended up having (or having had) stars but no
gas the most efficient mechanism of baryons removal is exactly the stellar
feedback (Dekel & Silk 1986). Finally, we note that the adiabatic contraction (following Gnedin et al. (2004)) is ineffective for these subhaloes. We
will address all these issue of the temporal evolution, mass loss and baryon
influence in greater detail in a companion study in Chapter 5.
We close this Section with a detailed look at the rotation curves of the
sister haloes in Fig. 3.3. In each plot the two sister objects are presented;
the solid and dashed lines represent the circular velocity of the DM sub46
CHAPTER 3. MASSIVE, DENSE DARK MATTER SUBHALOES OF THE
MILKY WAY
haloes in the dark matter only simulation and of the (sister) SPH subhalo,
respectively. The asterisks show the Vmax -Rmax pairs used in Fig. 3.1. We
thus observe adiabatic contraction at work: the first three objects (which
happen to have high baryon fraction) in that plot clearly show the centrally peaked total matter distribution in the SPH run. The plot further
indicates that our measurements of the rotation curve and its peak are not
contaminated by numerical artifacts (e.g. mis-identified halo centre, etc.).
3.4
Conclusions
In this work we explored the possibility that baryonic processes may
solve the recently presented problem of ”the puzzling darkness of Milky
Way subhaloes” (Boylan-Kolchin et al. 2011). To this extent, we used dark
matter only as well as full hydrodynamical simulations of cosmic structure
in the context of the CLUES project. We used cosmological parameters
determined from both the WMAP3 and WMAP5 data.
Our conclusions are twofold and can be summarized as follows:
• We find that when baryonic physics is included, following the feedback
and star formation prescriptions of Springel & Hernquist (2003), the
problem of having too dense massive subhaloes is not solved. Instead,
gasdynamical simulations pose new questions regarding which mechanisms are responsible for the lowering of Rmax in those subhaloes (while
Vmax remains more or less constant). Adiabatic contraction seems to be
a reasonable explanation, as shown using the modified adiabatic contraction model of Gnedin et al. (2004): this process is effective only
for some subhaloes, specifically, for those with a high baryon fraction.
For the SPH subhaloes with lower baryon fractions at redshift z = 0,
instead, we observe a general increase of Rmax with respect to their
DM counterpart, thus meaning that other effects are at work, e.g. the
model proposed by Navarro et al. (1996a) in which a rapid expulsion
of baryonic mass during star formation causes a reduction of the halo
concentration, as well as naturally explaining the low baryon fraction
of these objects.
• While in the WMAP5 DM only case we find dark matter subhaloes
outside the confidence area (calculated following the prescription given
in Boylan-Kolchin et al. (2011)) in the WMAP3 cosmology we only
have one massive subhalo outside this observational range. Since the
Via Lactea II and Aquarius simulations presented in Boylan-Kolchin et
al. (2011) are similar cases, we conclude that the cosmology certainly
47
3.4. CONCLUSIONS
has an influence, too: the higher σ8 of the WMAP5 scenario eventually led to higher host masses which – according to our test – are
the most likely reason for the higher number of excessively centrally
concentrated substructures. Note that the latest data from WMAP7
favours σ8 = 0.807, a value between the WMAP3 and WMAP5 results:
this could mean that the problem is worse than in WMAP3, but not
as pronounced as in the WMAP5 case.
An issue neither touched upon by us nor other authors is the adequacy
of using NFW profiles when calculating the confidence interval for possible hosts of the bright MW dwarf spheroidals. It is obvious that tidal
effects will lead to severe modifications of the original NFW density profile
subhaloes had upon infall into their host (Kazantzidis et al. 2004). They
therefore leave an impact upon internal and kinematical properties, respectively (Lokas et al. 2010, 2011), which should be taken into account when
using observed half-light radii R1/2 and their corresponding masses M1/2 to
define the confidence interval. Further, Romano-Dı́az et al. (2008) showed
that adiabatic contraction makes the dark matter profile almost isothermal.
However, the relevance is questionable as material will primarily be stripped
from the outer regions: Peñarrubia et al. (2008) state that dSphs embedded in NFW haloes are very resilient to tidal effects until they are nearly
destroyed. This is supported by Navarro et al. (2010) who found that the
NFW shape holds reasonably well even for subhaloes. To roughly gauge the
problem, we fitted our (SPH) subhaloes to a NFW profile, and observed
that while some of them are well fitted, there are still objects whose density
profile cannot be approximated by the simple NFW functional form. Taking
all these considerations into account suggests that the NFW profile used to
calculate the allowed region is likely not the best choice. We leave this to a
companion study, presented in Chapter 5.
The interpretation of the results presented here clearly demands a closer
investigation of the evolutionary tracks of the satellites, the actual influence of the SF and feedback model as well as an improved calculation of
the observational confidence level, verifying the applicability of the NFW
approach. We highlight here that simply the inclusion of baryonic physics
does not solve the problem; it rather poses new challenges to be explored
and studied in greater detail.
48
Chapter 4
Non-universal density profile of
SPH subhaloes: implications
for the Milky Way’s dSphs
We use dark matter only and full hydrodynamical Constrained Local
UniversE Simulations (CLUES) of the formation of the Local Group to
study the density profile of subhaloes of the simulated Milky Way and
Andromeda galaxies. We show that the Einasto model provides the best
description of the subhaloes’ density profile, as opposed to the more commonly used NFW profile or any generalisation of it. We further find that the
Einasto shape parameter nE is strongly correlated with the total subhalo
mass, pointing towards the notion of a non-universality of the subhaloes’
density profile. We observe that the effect of mass loss due to tidal stripping,
in both the dark matter only and the hydrodynamical run, is the reduction
of the shape parameter nE between the infall and the present time. Assuming now that the dSphs of our Galaxy follow the Einasto profile and
using the maximum and minimum values of nE from our hydrodynamical
simulation as a gauge, we can improve the observational constraints on the
Rmax -Vmax pairs obtained for the brightest satellite galaxies of the Milky
Way. When considering only the subhaloes with −13.2 <
∼ MV <
∼ −8.8, i.e.
the range of luminosity of the classical dwarfs, we find that all our simulated objects are consistent with the observed dSphs if their haloes follow
the Einasto model with 1.6 <
∼ nE <
∼ 5.3. The numerically motivated Einasto
profile for the observed dSphs will alleviate the recently presented ”massive
failures” problem.
49
4.1. INTRODUCTION
4.1
Introduction
While the predictions of the current Λ Cold Dark Matter (ΛCDM) model
have been widely confirmed at cosmological scales, there are still a number
of discrepancies between theory and observations at galactic and subgalactic scales: one example is the well-known ”missing satellite problem”, first
pointed out by Klypin et al. (1999a) and Moore et al. (1999). The high
number of substructures resolved within the virial radius of galaxy-type objects in high resolution cosmological simulation mismatches the number of
observed satellite galaxies of our Milky Way (MW) and nearby galaxies.
To alleviate the problem one must invoke some mechanisms, such as early
reionization of the intergalactic medium and supernovae feedback (Bullock
et al. 2000; Somerville 2002; Benson et al. 2002), to suppress galaxy formation below a certain scale.
However, there is an inconsistency not only with the number, but also
about the kinematics of the observed MW’s dwarf spheroidals (dSphs) when
compared to the velocity profiles of the most massive subhaloes found in
dark matter simulations (Boylan-Kolchin et al. 2011). Assuming that these
subhaloes follow a Navarro et al. (1996b,NFW herafter) profile, they have
been found to be too dense to host the MW’s bright satellites. This is
directly related to the findings of Bovill & Ricotti (2011a,b), whose simulations showed an overabundance of bright dwarf satellites (LV > 104 Lsun )
with respect to the MW’s dSphs.
A number of studies tried to reconcile simulations with observations.
The possibility that the MW is a statistical outlier has been ruled out
by Strigari & Wechsler (2012), who used data from the Sloan Digital Sky
Survey to show that, down to the scale of Sagittarius dwarf, our Galaxy is
not anomalous in its number of classical satellites. Further, the analysis of
Boylan-Kolchin et al. (2012), independent from the choice of actual density
profile of the simulated subhaloes, demonstrates that supernova feedback is
unlikely to be an explanation for the low inferred densities of dSphs, due
to their small stellar masses. Different hypothesis for the nature of dark
matter can naturally lead to the formation of less concentrated subhaloes
in a warm dark matter scenario (Lovell et al. 2012) or in simulations of
self-interacting dark matter models (Vogelsberger et al. 2012), providing
an interesting alternative to the ΛCDM model. Moreover, the discrepancy
between observed and simulated satellite galaxies may reflect the fact that
the MW is less massive than is commonly thought: a total mass between
12
8·1011 <
∼ M/M <
∼ 10 has been argued in Vera-Ciro et al. (2013) and Wang
et al. (2012). However, lowering the mass of the MW still do not explain
why its dSphs (as well as many isolated dwarf galaxies), seem to live in
50
CHAPTER 4. NON-UNIVERSAL DENSITY PROFILE OF SPH
SUBHALOES: IMPLICATIONS FOR THE MILKY WAY’S DSPHS
haloes whose mass is smaller than the current expectation from abundance
matching models (Ferrero et al. 2012).
The inclusion of baryons in simulations has also been explored, and it
has been found either to have negligible effects on the dark matter density
of subhaloes (Parry et al. 2012) or to have a twofold effect on their density
profile (Di Cintio et al. 2011). In fact, recognizing that at galactic scales
baryonic processes are expected to play a crucial role, it has been investigated in Di Cintio et al. (2011) the effect of the inclusion of baryons in
SPH simulation within the CLUES project.1 These simulations are designed
and constrained, respectively, to reproduce as closely as possible the actual
observed Local Group with its two prime galaxies MW and Andromeda
(hereafter also referred to as M31) and hence serve as an ideal testbed for
investigating the dynamics and kinematics of the satellite populations of
the real MW and M31. In this previous study it has been found that,
while in some cases the baryons are able to lower the central density of subhaloes, through mechanisms such as gas outflows driven by star formation
and supernovae (Navarro et al. 1996a; Governato et al. 2012), there are still
substructures whose density is increased, as expected from the adiabatic
contraction model of Blumenthal et al. (1986).
The underlying assumption in many previous works is that the satellite
galaxies of the MW are embedded in subhaloes whose mass profile is described by the NFW model: it is still a matter of debate, however, if this
profile is the best choice in modeling the dSphs’ density.
On one hand, Walker & Peñarrubia (2011) constructed a method for
measuring the slope of the mass profiles within dSphs directly from stellar
spectroscopic data, independently from any dark matter halo model and
velocity anisotropy of the stellar tracers, and showed evidence for the profile
of the Fornax and Sculptor dSphs to be consistent with cores of constant
density within the central few-hundred parsecs of each galaxy, thus ruling
out a cuspy profile such as the NFW one. On the other hand, Wolf &
Bullock (2012) used a Jeans analysis to show that, even in the limiting
case of an isotropic velocity dispersion, not all of the dwarfs prefer to live
in halos that have constant density cores. It must be noticed, however,
that while the Walker & Peñarrubia (2011) method is insensitive to orbital
anisotropy and underlying halo potential, the Wolf & Bullock (2012) results
are dependent from these yet unknown quantities.
Regarding simulations, Di Cintio et al. (2011) pointed out that the NFW
profile may not be appropriate to describe the subhaloes’ density. While
computing the subhaloes’ circular velocities Boylan-Kolchin et al. (2012)
1
http://www.clues-project.org
51
4.2. SIMULATION DETAILS
used an Einasto profile to model the density distribution of subhaloes at
small radii, in order to correct for the effects of the force softening, and the
raw particle data at higher radii.
The three-parameter Einasto profile (Einasto 1965), indeed, has been
found to more accurately describe the halo density in dark matter only
simulations (e.g. Navarro et al. 2004; Merritt et al. 2006; Prada et al. 2006;
Gao et al. 2008; Hayashi & White 2008; Navarro et al. 2010; Ludlow et
al. 2011; Reed et al. 2011), reducing the residuals of the fits by 20% with
respect to the corresponding NFW models.
In this work we mainly focus on hydrodynamical simulations and, after
a brief explanation, in Section 4.2, of the CLUES project simulations, we
study the mass profile of substructures within the two main haloes of the
simulated Local Group, formally calling them Milky Way and M31. In Section 4.3 we focus on the quality of several analytical models in describing the
density profile of galactic subhaloes showing that, also in hydrodynamical
simulations, the Einasto profile provides the best description. In Section 4.4
we then show that the corresponding profile shape parameter nE scales with
the virial mass of the subhalo. We finally discuss the implications for the
mismatch between the kinematics of the observed MW’s dSphs and the
simulated substructures in Section 4.5, before concluding in Section 4.6.
4.2
Simulation details
We used the same set of CLUES simulations already described in Section 2.1 and Section 3.2 based upon a WMAP3 cosmology. There are two
runs available, one with dark matter only (DM run) and one hydrodynamical (labelled SPH run) in which we additionally follow the feedback and
star formation rules of Springel & Hernquist (2003), as well as a uniform
but evolving ultra-violet cosmic background (Haardt & Madau 1996).
The stellar population synthesis model STARDUST (see Devriendt et
al. 1999,and references therein for a detailed description) has been used to
derive luminosities from the stars formed in our simulation. This model
computes the spectral energy distribution from the far-UV to the radio, for
an instantaneous starburst of a given mass, age and metalicity. The stellar
contribution to the total flux is calculated assuming a Kennicutt initial mass
function (Kennicutt 1998).
All the subhaloes used in this particular study are selected in order to be
more massive than Msub > 2 × 10⁸ h−1 M , with a peak in the velocity curve
Vmax >
∼ 10km/s, and to lie within 300 kpc from each host’s center, the latter
being either the MW or M31. The masses of the SPH hosts, defined as the
52
CHAPTER 4. NON-UNIVERSAL DENSITY PROFILE OF SPH
SUBHALOES: IMPLICATIONS FOR THE MILKY WAY’S DSPHS
Table 4.1: Quality of the fits for several density profile models. The results for
SPH and DM subhaloes are listed, together with the mean value of the shape
parameter n, the inner slope γ and the outer slope β, respectively.
Profile
NFW
M99
(1, 3, γ)
(1, β, 1)
P&S
Einasto
∆2
0.043
0.030
0.014
0.014
0.013
0.011
SPH
shape
γ = 1.00
γ = 1.50
γ = 1.98
β = 3.80
nPS = 3.35
nE = 4.80
∆2
0.042
0.032
0.015
0.013
0.013
0.012
DM
shape
γ = 1.00
γ = 1.50
γ = 1.53
β = 4.40
nPS = 3.15
nE = 3.79
masses within a sphere containing ∆vir ' 390 times the cosmic mean matter
density, are MMW = 4.0×10¹¹ h−1 M and MM31 = 5.47×10¹¹ h−1 M . When
stacking the data from the two hosts together, we found a total of 56 SPH
and 66 DM subhaloes in this WMAP3 simulation. Note that our selection
criterion assures that within each host a subhalo contains a minimum of
1000 particles.
4.3
4.3.1
The density profile of SPH and DM subhaloes
Theoretical Models
While it is widely accepted that a Navarro et al. (1996b,NFW) profile
provides a good description of DM haloes, it has been already pointed out in
Di Cintio et al. (2011) that this universal profile may not be the best choice
when used to fit sub-halo densities. We will thus study different profiles
and apply them to our simulated substructures, with particular emphasis
on the density profile of subhaloes in hydrodynamical simulations.
A generalisation of the NFW profile is the
so-called (α, β, γ), or double power-law model:
Double-power law profiles
ρs
ρα,β,γ (r) = γ h
α i(β−γ)/α
r
1 + rrs
rs
(4.1)
where rs is the scale radius and ρs the scale density, characteristic of each
53
4.3. THE DENSITY PROFILE OF SPH AND DM SUBHALOES
halo and related to its formation time and mass (e.g. Prada et al. 2012;
Muñoz-Cuartas et al. 2011; Macciò et al. 2007; Bullock et al. 2001). It is a
five-parameter model in which the inner and outer region have logarithmic
slopes −γ and −β, respectively, and the α parameter regulates the sharpness
of the transition. The choice (α, β, γ) = (1, 3, 1) provides the NFW profile,
while (α, β, γ) = (1.5, 3, 1.5) gives the model presented in Moore et al.
(1999,M99 hereafter). Besides of the NFW and M99 profiles we will also
investigate the case of leaving the central slope as a free parameter, i.e. a
(1, 3, γ) model.
In addition to these double-power law profiles we test the
Einasto profile (Einasto 1965), identical in functional form to the 2D Sérsic
model (Sérsic 1963; Sérsic 1968), but used instead to fit a spacial mass
density:
Einasto profile
ρ−2
ρE (r) =
"
2n
e
r
r−2
1
n
(4.2)
#
−1
Here r−2 is the radius where the logarithmic slope of the density profile
equals -2 and n, also referred to as nE , is a parameter that describes the
shape of the density profile. r−2 is equivalent to the scale radius rs of a NFW
profile, and the density ρ−2 = ρ(r−2 ) is related to the NFW one through
ρ−2 = ρs /4. This profile gives a finite total mass and its logarithmic slope
decreases inwards more gradually than a NFW or M99 profile. When nE
is large, the inner profile is steep and the outer profile is shallow. Typical
values of nE found in dark matter only simulations for haloes more massive
than 1010 M are 4 <
∼n<
∼ 7.
Finally, following the study of Merritt et al.
(2006), we use the analytical approximation of the deprojected Sérsic law,
given in Prugniel & Simien (1997,P&S hereafter):
Prugniel–Simien profile
ρ−2
ρP&S (r) =
"
r
r−2
p
n(2−p)
e
r
r−2
1
n
#
(4.3)
−1
where n, or nP&S where appropriate, is again a parameter describing the
curvature of the density profile and the quantity p is a function of nP&S
chosen to maximize the agreement between the P&S model and the Sérsic
law. A good choice for p, when 0.6 <
∼ n <
∼ 10, is p = 1.0 − 0.6097/n +
54
CHAPTER 4. NON-UNIVERSAL DENSITY PROFILE OF SPH
SUBHALOES: IMPLICATIONS FOR THE MILKY WAY’S DSPHS
Figure 4.1: Residuals of the density profiles of all SPH subhaloes for each of the
fitted models. The mean goodness-of-fit ∆2 is indicated, providing the Einasto
model to be the best one. The radial dependence of the residuals is the same for
the DM only run, thus not shown here.
0.05463/n2 (Lima Neto et al. 1999), used in our fitting routine. We must
highlight that the shape parameter nE of the Einasto profile is not the same
as nP&S of the P&S model, although they follow the same functional form.
The Einasto profile, the P&S one and the modified NFW profile (1, 3, γ)
are all 3-parameters models.
4.3.2
Application to Subhaloes
We now apply all the above models to fit our subhaloes’ density profiles.2
The density profiles are given in radial bins logarithmically spaced from the
inner radius compliant with the convergence criterion of Power et al. (2003)
out to the subhaloes’ edge, defined as in Knollmann & Knebe (2009). The
number of bins varies from 7 for the least massive objects to 16 for the most
massive ones; by this we assure to minimize the Poissonian noise always
having at least 150 particles per bin, and a minimum of 1000 particles in
total in each subhalo. We verified that the convergence criterion as defined
in Power et al. (2003) is suitable also for subhaloes, and thus fully applicable
to our simulation. Specifically, we used a lower resolution, 20483 particles
DM-only run with three times higher softening length = 411 pc, to show
that the density profile of subhaloes converges for ∼ 4.8. This value is
always equal or less than the radius found using the Power et al. (2003)
criterion: all our trusted radii are thus fully converged according to the most
conservative criterion possible and are not affected by two-body relaxation
effects.
We define the goodness-of-fit as
2
We use the IDL routine MPFIT
55
4.3. THE DENSITY PROFILE OF SPH AND DM SUBHALOES
Figure 4.2: Correlation of the shape parameter nE with the subhaloes’ masses
in the DM only simulations, left panel, and SPH simulation, right panel. The
error bars associated to the shape parameter are indicated for nE , as provided
by the fitting routine. The 1σ statistical error committed in the evaluation of nE
is, on average, the 15% of the nE itself. The evident correlation between nE and
the subhaloes’ masses in the DM only as well as in the SPH run is attributed to
the dynamical effects of tidal stripping. The additions of baryons can ulteriorly
modify the density profile, specifically in its inner part.
∆2 =
1
Nbins
N
bins
X
(log10 ρsim,k − log10 ρfit,k )2 ,
(4.4)
k=1
whose average value over the total number of subhaloes ∆2 gives an indication of the fit performance.
The results are presented in Table 4.1 for a WMAP3 cosmology, where
we list the quality of fit values ∆2 alongside the mean value of the shape parameter nE , nP&S or the inner (outer) slope γ (β) in the case of considering
the double power-law models. A first consideration regards the differences
between the DM only and the SPH runs: we observe that the mean shape
parameters in the SPH run are systematically higher than in the DM counterpart, which implies a more cuspy central slope, indicating that the net
effect of the inclusion of baryons is a steepening of the subhaloes’ density.
Our results appear to be in agreement with the prescription of an adiabatic
contraction model (Blumenthal et al. 1986), as shown already in Di Cintio
et al. (2011) for the most massive and most luminous subhaloes. We must
remark that we are listing the average n over the total set of subhaloes:
there are cases, as discussed in Di Cintio et al. (2011), in which the SPH
subhaloes with the lowest baryon fraction, instead, undergo an expansion,
56
CHAPTER 4. NON-UNIVERSAL DENSITY PROFILE OF SPH
SUBHALOES: IMPLICATIONS FOR THE MILKY WAY’S DSPHS
therefore lowering their n. An higher shape parameter in the SPH run is
also indicative of a less steep outer profile with respect to the DM only
run, which means that tidal stripping effects are stronger on the DM only
substructure, as reported in Libeskind et al. (2010) (see discussion below).
We also notice that the mean shape parameter of the P&S profile, nP&S ,
is lower than the corresponding Einasto parameter, nE , in the same run:
this is expected, and found also in Merritt et al. (2005). A few words on
the steep central slopes γ found for the (1, 3, γ) model: this model imposes
the outer slope to be equal to 3, which is not the case for subhaloes where
the profile drops even faster (cf. Oh et al. 1995; Peñarrubia et al. 2009),
causing the fitting routine to provide high values of γ when trying to adjust
the density profile. Leaving the outer profile index β as a free parameter,
i.e. using a (α, β, γ) = (1, β, 1) model, we found indeed that on average the
outer slope of SPH subhaloes is β̄ = 3.8 while in the DM only case β̄ = 4.4.
This is in agreement with the average values obtained for the Einasto shape
parameter, which is higher in the SPH case with respect to the DM only
scenario: the higher nE found in the SPH subhaloes indicates a cuspy inner
profile, as expected if adiabatic contraction is acting on the central part of
the structures, but also an outer density profile less steep than in the DM
case, as confirmed by the (1, β, 1) model.
The outer profile of subhaloes in the CLUES gas-dynamical run is shallower
than in the pure dark matter case because of the influence of tidal stripping
whose effects, being present in both runs, are stronger in the DM case.
Tidal stripping, which mainly acts on the outer part of the density profile,
is able to remove more mass from a pure dark matter subhalo than an SPH
one, owing to the deepening of the potential in the latter case, as shown in
greater detail by Libeskind et al. (2010).
Finally, we also used the exponentially truncated profile, introduced by
Kazantzidis et al. (2004) to deal with the divergence of the cumulative mass
distribution of haloes as r → ∞, but we did not obtain improvements over
the Einasto or P&S profiles.
To further highlight the quality of the different models, in Fig. 4.1 we
present the residuals between the fits and the data for each subhalo in the
SPH simulation as a function of log(r/r−2 ) (the plots look akin for the DM
simulation and hence are omitted). Note that for the (1, 3, γ) model the
point where the logarithmic slope of the density profile equals −2 occurs at
a radius r−2 = (2 − γ)rs for γ < 2: thus, for a NFW profile r−2 = rs and
for a M99 profile r−2 = rs /2.
Neither the NFW, M99, or (1, 3, γ) profiles are well fitted over the whole
radial range: while the (1, 3, γ) with a steep central slope may describe the
data in the inner regions, it fails so in the outer parts. On the contrary, the
57
4.4. SHAPE PARAMETER – SUBHALO MASS RELATION
radial dependence of the residuals in the Einasto model is clearly minimized
with respects to all the other models, being consistent with zero at every
radial bin. The case could be made that the (1, 3, γ) model performs as
well as the Einasto model in the inner region of the density profile (which
is also the region of interest with respect to the observations of the MW’s
dSphs). In order to assess the degree to which these results are affected by
the choice of the radial range, we calculate the residuals, for every model,
for only the innermost bins with r < r−2 , and found that the Einasto is still
the best profile overall.
We conclude that the Einasto model outperforms all the other proposed
profiles in terms of quality of fit, giving, over the full radial range, an average
value of ∆2 = 0.011 in the SPH run and ∆2 = 0.012 in the DM only run.
We note that the the P&S model also provides good results, though not as
good as the Einasto model.
While it is somehow obvious that these 3-parameter models perform
better than the 2-parameter ones (such as the NFW or M99 model), we
are reassured by the fact that even after fixing the shape parameter nE
(nP&S ) of the Einasto (P&S) profile to its mean value, therefore reducing
the free parameters to two, we still obtain a mean goodness-of-fit which is
lower than any other 2-parameter model (the Einasto profile, for example,
provides ∆2 = 0.025 for the SPH run and ∆2 = 0.028 for the DM run).
Thus, the better performance of the Einasto profile is not just an artifact of
having one free parameter more. Furthermore, our results are in agreement
with those of other workers in the field (e.g. Springel et al. 2008).
In light of this we state that the need of a shape parameter n to fully
specify the mass profile of simulated DM and SPH subhaloes is an indication
of the non-universality of their density profiles, as will be highlighted in the
next section.
4.4
Shape parameter – subhalo mass relation
In Table 4.1 the average values of the Einasto shape parameter nE are
shown. However, this shape parameter varies from subhalo to subhalo,
spanning quite a large range 0.4 <
∼ nE <
∼ 10.4 in the SPH run (with a similar
spread in the DM model). This naturally raises the question of whether
this variation follows some rule or is random.
In Fig. 4.2, the fitted Einasto shape parameter nE is plotted against
subhalo mass for both the DM only run (left) and the SPH run (right). A
clear correlation is immediately visible. This result forms one of the main
58
CHAPTER 4. NON-UNIVERSAL DENSITY PROFILE OF SPH
SUBHALOES: IMPLICATIONS FOR THE MILKY WAY’S DSPHS
findings of this study: the Einasto shape parameter correlates directly with
subhalo mass. To quantify the nE -mass correlation, the Spearman rank
coefficient3 Sr (Kendall & Gibbons 1990) is calculated, yielding Sr = 0.70
for the SPH run, with a significance of practically zero confirming a strong
correlation: the most massive objects have a higher value of the shape
parameter, while less massive ones have smaller values. In other words,
low mass substructures are well fit by a inner density profile shallower than
a NFW one, with a steep outer slope, while the higher mass objects are
fit by a steep, cuspy-like inner profile. Convergence studies (wherein the
number of radial bins used for profile fitting is drastically increased) have
been performed in order to ascertain the applicability of an Einasto profile
to our subhaloes. These tests have revealed that our fitting procedure is
robust and not a result of the sampling. Similar results and Sr values are
found for the DM only run. One might argue that the subhalo’s mass may
be seen as a rather ill-defined quantity, and a better proxy for mass (e.g.
Knebe et al. 2011b) should be the peak of the rotation curve Vmax : when
replacing the mass on the x-axis of Fig. 4.2 with Vmax we actually do not
find any substantial change in the correlation, strongly confirming it.
Since Fig. 4.2 shows the same nE -mass relation for both the DM only and
the SPH run, we conclude that the mechanism responsible for this relation
must be dynamical and hence is likely to be tidal stripping. To determine
the influence of tidal stripping, the properties of subhaloes at infall time,
defined as the last time a subhalo crossed a sphere of physical radius 300kpc
from the host’s center 4 , have been examined.
At infall time the subhaloes’ density is well described by both an Einasto
and a NFW profile, as expected for field haloes. Using an Einasto profile,
we find that the more mass lost since zinfall , the lower the value of nE at
z = 0, as presented in Fig. 4.3 for the SPH case. There is thus an evident
correlation between the amount of stripped material and the reduction of
nE for each subhalo. Again, this relation is quantified by the Spearman rank
coefficient, Sr = 0.68, and showing the best curve fit, which has a unitary
angular coefficient, as a solid line in Fig. 4.3. A similar dependence is found
in the DM only run, thus not shown here, corroborating our findings that
tidal stripping is the main mechanism able to modify the density profile of
subhaloes.
Many authors (e.g. Kazantzidis et al. 2004; Springel et al. 2008; Hayashi
3
The Spearman rank coefficient is a non-parametric measure of correlation that assesses
how well an arbitrary monotonic function describes the relationship between two variables,
without making any other assumptions about the particular nature of the relationship between
the variables. The closer the coefficient is to 1 the stronger the correlation between the two
variables. We use the IDL routine R CORRELATE() to calculate it.
4
Using the first infall time provides similar results.
59
4.4. SHAPE PARAMETER – SUBHALO MASS RELATION
Figure 4.3: Reduction of the shape parameter nE as a function of the mass loss
between z = 0 and zinfall for the SPH subhaloes. A similar behavior is found in
the DM only run, thus not shown here. The best fit curve, which has unitary
slope, is shown as a solid line.
et al. 2003; Peñarrubia et al. 2010) have shown that tidal stripping acts
mainly to modify the outer region of a profile. Since a steepening of the
outer profile entails a reduction of nE exactly as observed in our simulations,
we therefore conclude that the lowering of the subhaloes’ shape parameter
between zinfall and z = 0 is primarily due to stripping effects. This finding
is indeed in agreement with the recent work of Vera-Ciro et al. (2013) who
show that very heavily stripped objects have on average smaller nE , because
of a steepening of the outer density profile. It is also worth noting that tidal
stripping has been shown by Hayashi et al. (2003) to not only affect the
subhaloes’ outer regions: as a substructure loses mass, the central density
will also decrease significantly (although the slope of the inner density profile
remains unchanged).
A word of caution is necessary at this point. The Einasto model’s shape
parameter nE describes simultaneously the slope of the inner and outer profile, in a single number. This can be both an advantage and a disadvantage.
Indeed for some subhaloes in our simulations the value of the scale radius
r−2 is close to the the innermost converged radius while the outer profile is
resolved with many radial bins. In these cases, if the outer profile steepens
yet the structure of the inner part remains unchanged, the Einasto fit would
return a lower value of nE due to the fitted profile being dominated by the
60
CHAPTER 4. NON-UNIVERSAL DENSITY PROFILE OF SPH
SUBHALOES: IMPLICATIONS FOR THE MILKY WAY’S DSPHS
steepened outer part. This is the case, for example, of heavily stripped objects (Mz=0 /Mzinf all ∼ 20%) in the DM only run, in which the inner cuspy
slope of the substructure is retained after infall, while the outer profile has
been steepened by tidal stripping, thus providing a small fitted nE value.
Care must be taken not to interpret these cases as becoming cored, in the
inner region, due to tidal stripping. That said even in these cases, Einasto
models provide accurate fits to the density profile – more accurate than any
of the other models as could be seen in Fig. 4.1 and Table 4.1.
While tidal stripping is the only relevant mechanism in the DM only run,
other effects such as baryonic feedback have to be taken into account in the
SPH case, since they can also contribute to changes in the density profile of
subhaloes (Zolotov et al. 2012; Brooks et al. 2013). Indeed, as opposed to the
DM only simulation, in the SPH run we observe in some subhaloes a change
to their inner structure (cf. Di Cintio et al. 2011). Since, as mentioned above,
tidal stripping does not change the inner slope of substructures, the only
mechanisms able to alter the density at small radii must have a baryonic
origin. Di Cintio et al. (2011) showed that the inclusion of baryons has a
twofold effect, increasing or decreasing its central density according to an
adiabatic contraction (Blumenthal et al. 1986) or outflows (Navarro et al.
1996a; Governato et al. 2012) model.
To shed more light onto the effects of baryons, a one to one comparison
of the density profiles of those subhaloes that can be cross-identified in the
DM and SPH run has been performed (as in Di Cintio et al. 2011). The
subhaloes which experienced an expansion in the SPH run, with respect to
their DM only partner, have lost all their gas at redshift zero, and they
do not show any sign of star formation between zinfall and z = 0. These
subhaloes have an inner density profile shallower than the corresponding
sister DM subhalo. On the other hand, those objects which have undergone
adiabatic contraction in the SPH run (cf. Di Cintio et al. 2011) still retain
some gas at z = 0 and their star formation appears to be on going even
after infall. These subhaloes have a high value of the shape parameter
nE , which is now well describing a steeper inner density profile caused by
adiabatic contraction. In any case, the fits are still dominated by the outer
profile, steepened by tidal stripping, where most of the bins lie and hence
higher resolution simulations are needed to verify the effective creation of a
core in objects with small nE values: the interplay of these two contrasting
effects, i.e. outflows vs adiabatic contraction, and a deep analysis of the
repercussions on the inner density profile of substructures in cosmological
simulations will be explored in detail in the future.
Some other important conclusions can now be drawn from Fig. 4.2.
Firstly, there is no evidence for any universal profile in simulated substruc61
4.5. NEW OBSERVATIONAL CONSTRAINTS FOR THE SATELLITE
GALAXIES OF THE MILKY WAY
tures. Secondly, we note that the majority of the subhaloes in both runs
tend to have a small nE , while only the most massive ones (mostly the
adiabatically contracted ones) have a high nE , as large as nE =10.4 in the
SPH run and nE =9.4 in the DM only one. This finding, as well as the
goodness of the Einasto profile, has been confirmed from an observational
point of view by the recent work of Del Popolo & Cardone (2012), who
used high quality rotation curves data of dwarf galaxies to show that the
preferred fitting function is given exactly by the Einasto model and that
the majority of the dwarfs tend to have shallow profiles (their Fig. 3). Our
mean shape parameter in the hydrodynamical run, nE = 4.8, as well as
their Einasto mean shape parameter, nE,D.P. = 3.05, are both lower than
the corresponding nE for dwarf size objects found in previous dark matter simulations (Merritt et al. 2005; Navarro et al. 2004). In that regards
we need to mentioned that previous results coming from such dark matter
only simulations, where cluster- and galaxy-sized haloes have been studied,
showed instead a decreasing of nE for increasing halo mass (Navarro et al.
2004; Merritt et al. 2005; Graham et al. 2006b; Prada et al. 2006; Gao et al.
2008; Hayashi & White 2008; Navarro et al. 2010). Our study indicates that
there is a turnover, such that the trend with mass is reversed for low mass
galaxies (at least satellites), with both SPH and DM simulations having
a positive correlation of nE with mass. The main difference between previous studies and this work is, besides the less massive objects considered
here, the fact that our objects are subhaloes, and thus obviously affected
by tidal stripping, as mentioned above. Finally it must be noticed that the
range of variation of the nE shape parameter found in our simulation is very
large, spanning the interval 0.4 <
∼ nE <
∼ 10.4 in the SPH case: remarkably
the same large range has also been found in Del Popolo & Cardone (2012),
with 0.29 < nE,D.P. < 9.1, as well as in the recent work of Vera-Ciro et al.
(2013), based on semi-analytical models of galaxy formation. Furthermore,
in the observational paper of Chemin et al. (2011), the authors used the
Einasto model to fit the rotation curves of the THINGS5 galaxies and show
that the shape parameter is near unity on average for intermediate and low
mass halos, while it increases for higher mass haloes, being correlated with
the halo virial mass as we find in this work.
4.5
New observational constraints for the satellite galaxies of the Milky Way
We now move to a practical application of our findings, only focusing
on the properties of SPH subhaloes, which are obviously closer to reality
5
http://www.mpia.de/THINGS/Overview.html
62
CHAPTER 4. NON-UNIVERSAL DENSITY PROFILE OF SPH
SUBHALOES: IMPLICATIONS FOR THE MILKY WAY’S DSPHS
than their DM only counterparts. In Boylan-Kolchin et al. (2011) the observational constraints, used to establish if subhaloes found in cosmological
simulations are possible hosts of the known Milky Way dwarf spheroidals,
were based on the assumption that the underlying dark matter halo of these
dSphs follows a NFW profile. Given our findings, however, it is clear that
since the Einasto model provides the best fit to the density profile of both
DM and SPH subhaloes, those observational constraints have to be modified.6 Note that in Eq.5-7, for clarity, we will omit the subscript E from the
Einasto shape parameter, simply referring to it as n. The circular velocity
of an Einasto profile follows
v 2 (r) ∝ γ(3n, x),
where
Z
(4.5)
x
γ(3n, x) =
e−t t3n−1 dt
(4.6)
0
is the lower incomplete gamma function and x = 2n(r/r−2 )1/n . To find the
radius Rmax at which dv(r)/dr = 0 we numerically solve,
γ(3n, 2n(
Rmax 1/n
Rmax 3 −2n( Rrmax
)1/n
−2
) ) = 23n n3n−1 (
)e
.
r−2
r−2
(4.7)
The relation between Rmax and r−2 , that we need in order to compute
the observational constraints, varies depending from the value of the shape
parameter nE (see, for example, Fig. 2 in Graham et al. 2006a). Given
the fact that the mass density profile of the faint dSphs is still uncertain
(e.g. Walker & Peñarrubia 2011; Wolf & Bullock 2012) we prefer to use the
conservative limits given by the highest and the lowest values of the shape
parameter nE as obtained from our hydrodynamical simulation. In the
SPH run the smallest nE = 0.4 corresponds to a relation Rmax = 1.447r−2 ,
while the largest nE = 10.4 gives Rmax = 2.348r−2 . Using these constraints,
i.e. the assumption of an Einasto model and the corresponding range of
nE -values, we computed the curves in the Vmax -Rmax plane for the nine
brightest classical dSphs of the MW, namely CvnI, Carina, Draco, Fornax,
Leo I, Leo II, Sextans, Sculptor and Ursa Minor, which all have MV <
∼ −8.8
(we excluded Sagittarius as in Boylan-Kolchin et al. (2011) since it is far
from dynamical equilibrium): these curves are constructed by normalizing
each dwarf to its observationally derived values of half-light mass, M1/2 , and
radius, r1/2 , from Wolf et al. (2010), who showed that any uncertainty on
6
Vera-Ciro et al. (2013) reached similar conclusions, using semi-analytical galaxy formation
models.
63
4.5. NEW OBSERVATIONAL CONSTRAINTS FOR THE SATELLITE
GALAXIES OF THE MILKY WAY
the stellar velocity dispersion anisotropy is minimized at this radius, leading
to accurate estimation of v(r1/2 ).
In the left panel of Fig. 4.4 we show the maximum circular velocity Vmax
and its corresponding radius Rmax for all the SPH subhaloes, within the
MW and M31 hosts, whose luminosity is at least as high as the Draco’s
one, i.e. MV <
∼ −8.8. With respect to Fig. 4.2 we excluded here objects
with a luminosity lower than Draco, but verified that the interval for the
shape parameter nE is still the same. In Fig. 4.5 we also show the numerically derived Vmax -mass relation for the SPH subhaloes, which is useful to
derive the range of masses associated to a specific value of Vmax . The grey
symbols in Fig. 4.4 correspond to the subhaloes that are brighter than Fornax, which is the brightest classical dwarf considered here to construct the
observational constraints having MV = −13.2, and the black circles indicate
all the remaining subhaloes with luminosity −13.2 <
∼ −8.8. We also
∼ MV <
plot the newly constrained observational limits, as solid lines, coming from
the assumption that the MW’s dSphs are embedded in haloes that follow the
Einasto profile with varying shape parameter nE between 0.4 <
∼ nE <
∼ 10.4,
and, as dashed lines, the previously used constraints coming from the NFW
model.
We observe that, while the employment of an Einasto profile leads to
a good agreement between observations and the SPH subhaloes,7 it still
appears to be not sufficient to explain the Rmax -Vmax pairs of the most
massive SPH subhaloes which still lie in the lower right part of the plane,
outside the constraints. Note that with a shape parameter varying between
0.4 <
∼ nE <
∼ 10.4 we have allowed the observational constraints to cover a
wider range, in the Rmax -Vmax plane, with respect to the NFW constraints,
but even this assumption is not enough to reconcile simulation and observation. However, those massive SPH objects, which we color-coded in grey,
appear to have a luminosity, MV <
∼ −13.2, not compatible with any of the
satellites used to derive the observational constraints.
We remind the reader that the data plotted in Fig. 4.4 refer to both the
MW and M31 galaxies: a total number of 14 subhaloes brighter than Fornax
is thus found within the two hosts (and only 11 if we relax the magnitude
cut from MV < −13.2 to MV < −14). For each host halo we therefore
have 5 to 7 objects brighter than the classical dwarfs used to compute
the observational constraints. Three of them may be associated with the
Large and Small Magellanic Clouds (LMC and SMC, respectively) and the
Sagittarius galaxy. In fact, objects with MV <
∼ −16.2 can be conservatively
considered as the analogous of the LMC and SMC: we should therefore
7
We find a complete agreement between observations and DM only subhaloes, which are
though not shown in the plot for clarity.
64
CHAPTER 4. NON-UNIVERSAL DENSITY PROFILE OF SPH
SUBHALOES: IMPLICATIONS FOR THE MILKY WAY’S DSPHS
Figure 4.4: Left panel, Vmax -Rmax pairs for the SPH subhaloes within the MW
and M31 hosts. The subhaloes have been color-coded by their luminosity: in black
the ones corresponding to the luminosity of the observed classical dSphs, in grey
the ones which are brighter than MV = −13.2. The 2σ observational constraints
for the MW’s dSphs are indicated as a solid line for the Einasto profile with
shape parameter 0.4 <
∼ nE <
∼ 10.4, obtained considering all the subhaloes with
MV <
−8.8,
and
as
dashed
line
for the NFW profile. Right panel, same criterion
∼
to color-code the subhaloes, although this time the 2σ observational constraints
for the MW’s dSphs are derived using an Einasto profile with shape parameter
1.6 <
∼ 5.3, obtained considering only the subhaloes with −13.2 <
∼ MV <
∼
∼ nE <
−8.8.
65
4.5. NEW OBSERVATIONAL CONSTRAINTS FOR THE SATELLITE
GALAXIES OF THE MILKY WAY
exclude these simulated subhaloes from the discussion.
With these associations there are, within each host, only two to four
subhaloes left with −16.2 <
∼ MV <
∼ −13.2 which do not have a counterpart
in the real universe: such a small sample, i.e. the ∼ 10% over the total
number of objects found within each halo in the SPH run, can be explained
as a statistical fluctuation due to our small number statistics. In the future,
to confirm this halo-to-halo variation in the subhaloes population, it will be
necessary to study many realization of a high resolution MW-like object.
In this work the luminosity function, averaged over the MW and M31 subhaloes, has been shown to be in agreement with the observational data of
Milky Way like galaxies (Strigari & Wechsler 2012), while slightly deviating
from the Milky Way itself in the interval −16 <
∼ MV <
∼ −13 (Knebe et al.
2011c) exactly because of these two to four overabundant objects in this
range. Moreover, we remind that our simulation also reproduces the luminosity vs velocity dispersion correlation observed for the satellite galaxies
of MW and M31 (Walker et al. 2009), as shown in Knebe et al. (2011c).
As an additional remark, we note that most of the brightest subhaloes in
our simulation are the ones that experienced adiabatic contraction, being
situated in the lower right part of the Vmax -Rmax plane at redshift z =
0, as studied and explained in Di Cintio et al. (2011). These subhaloes
are substantially different from the ones found in the work of Vera-Ciro
et al. (2013), who used dark matter only simulations with semi-analytical
galaxy formation models that do not show adiabatic contraction: their most
luminous, brightest objects are found in the upper-right of the Vmax -Rmax
plane, contrary to what we obtained in our hydrodynamical simulations.
We now proceed to again compute the shape parameter range based only
upon those subhaloes that satisfy the luminosity requirement, i.e. those objects whose MV is within the range of the observed dSphs luminosity. We
were therefore able to restrict the range, finding a shape parameter lying
within 1.6 <
∼ nE <
∼ 5.3, with a mean value nE = 3.2. In the right panel
of Fig. 4.4 we use the same black-grey colouring scheme for the SPH subhaloes as before, and we plot the observational limits based on the newly
constrained range for the shape parameter 1.6 <
∼ nE <
∼ 5.3. The result is a
perfect agreement between the expected Vmax -Rmax values of the observed
dSphs and the Vmax -Rmax pairs of the simulated subhaloes with corresponding luminosities.
We conclude that our findings, based upon self-consistent hydrodynamical simulations of a constrained Local Group in a cosmological context,
strongly supports the notion that the observed satellite galaxies of the Milky
Way are actually compatible with being embedded in dark matter haloes
whose density profiles show considerable differences, following an Einasto
66
CHAPTER 4. NON-UNIVERSAL DENSITY PROFILE OF SPH
SUBHALOES: IMPLICATIONS FOR THE MILKY WAY’S DSPHS
Figure 4.5: Correlation of the subhaloes maximum circular velocity with the
subhaloes’ masses in the SPH simulation.
model with 1.6 <
∼ nE <
∼ 5.3 and mean value nE = 3.2: the majority of
the dSphs may have an inner profile shallower than the previously assumed
NFW one while an outer profile steepened by tides.
4.6
Conclusion and discussion
Using a constrained simulation of the Local Group, performed within
the CLUES project, it has been shown that:
• the density profile of subhaloes in both dark matter only and hydrodynamical simulations is best approximated by an Einasto profile in
which the shape parameter nE is free to vary, and that
• there is a clear trend of growing nE with increasing subhaloes mass, in
both the dark matter only and hydrodynamical run.
The structural effect associated with tidal stripping is likely the main mechanism able to modify the subhaloes’ density profile: the effect of mass loss
due to tidal stripping is the reduction of the shape parameter nE between
the infall and the present time. A correlation between nE and the amount
of stripped material has also been argued in Vera-Ciro et al. (2013). Differences in the inner profile of subhaloes, between the pure DM and SPH run,
can instead be attributed to baryonic processes (Di Cintio et al. 2011): they
67
4.6. CONCLUSION AND DISCUSSION
result in adiabatic contraction of the dark matter halo when gas is retained
in the central regions and star formation is still on going after infall, and in
expansion when gas is removed from the dwarfs due to stellar feedback and
ram pressure stripping, with no signs of star formation after the subhalo
has entered the host’s halo. These baryonic effects, acting mainly on the
inner part of the density profile, do not modify the overall nE -mass relation
which is driven by tidal stripping also in the SPH case.
The majority of our SPH subhaloes have a small nE , as reported in the
right panel of Fig. 4.2: remarkably, Del Popolo & Cardone (2012) found
similarly small values of nE in observed dwarf galaxies, using high quality
rotation curves. Moreover, evidences of the fact that at least some of the
MW’s dSphs may have a shallow profile, compatible with a small nE , are
given in Walker & Peñarrubia (2011), who showed that the profiles of the
Fornax and Sculptor dSphs are consistent with cores of constant density at
a high confidence level. Nevertheless, the actual mass profile of the MW’s
dSphs is still uncertain: Wolf & Bullock (2012) claimed that, even with
an isotropic velocity dispersion, not all the dSphs prefer constant-density
cores and that, instead, some of them favor a cuspy inner profile. All these
findings do no longer support the notion of a universal subhalo mass profile;
subhaloes of differing mass cannot be rescaled to have self-similar profiles:
their mass (or so to speak size) matters.
In light of these results we revisited the Boylan-Kolchin et al. (2011) observational limits for possible hosts of the MW’s dSphs, assuming that the
latter are embedded in haloes that follow an Einasto profile, as opposed to
the earlier assumption of NFW profile, with variable shape parameter nE ,
and using the conservative limits 0.4 <
∼ nE <
∼ 10.4 provided by our hydrodynamical simulations. While using the Einasto profile is enough to completely
explain the maximum velocity of the most massive DM subhaloes, an issue
still remains with respect to the most massive SPH subhaloes: these objects
experienced adiabatic contraction (Di Cintio et al. 2011) and their Rmax Vmax pairs are still lying outside the expected observational constraints.
However, these subhaloes appear to be brighter than Fornax, which is the
brightest dSph used when constructing the observational constraints: thus,
they should not be considered in the comparison. Once the Large Magellanic Cloud, Small Magellanic Cloud and Sagittarius galaxy analogues are
removed, we still have two to four unaccounted objects per halo, whose
luminosity is higher than the luminosity of the classical dwarfs: we argue
that, being only 10% of the total set, they can be interpreted as a statistical
deviation.
Leaving only the SPH subhaloes with −13.2 <
∼ MV <
∼ −8.8, i.e. those in
agreement with the luminosity of the nine classical dSphs, we show that an
68
CHAPTER 4. NON-UNIVERSAL DENSITY PROFILE OF SPH
SUBHALOES: IMPLICATIONS FOR THE MILKY WAY’S DSPHS
Einasto profile with shape parameter 1.6 <
∼ nE <
∼ 5.3 provides an accurate
matching between simulations and observations, alleviating the ”massive
failures” problem first addressed in Boylan-Kolchin et al. (2011). The mean
value of the shape parameter for them is nE = 3.2, indicating that the
majority of the MW’s satellite galaxies are consistent with dark matter
haloes whose profile is an Einasto one, steepened outside by the effects of
tidal stripping and possibly shallower than the previously accepted NFW
towards the center.
We further note that our simulated host haloes masses are at the low
end of current observational estimates, and this may be one of the reason
for having only a few objects in the luminosity range −16 <
∼ MV <
∼ −13: Di
Cintio et al. (2011) suggested that the host halo mass is directly connected
to the number of massive subhaloes found in simulations, when comparing the results of dark matter only simulations based on a WMAP3 versus
WMAP5 cosmology, the latter showing a higher host halo mass and consequently a higher number of massive subhaloes. The dependence of the
number of ”too massive subhaloes” on halo mass has been further explored
and quantified by Wang et al. (2012). Boylan-Kolchin et al. (2011) extensively discussed the possibility that the reduction of the Milky Way mass
could solve the problem, and recently Vera-Ciro et al. (2013) suggested that
a Milky Way mass ∼ 8·1011 M provides a good match between observations
and semi-analytical galaxy formation models. In our simulations we have
slightly lower masses for the MW and M31, between 5.5 and 7.5 · 1011 M ,
these values being at the low end of mass estimates obtained using different
methods (Karachentsev & Kashibadze 2006; Watkins et al. 2010; Deason
et al. 2012b). According to the model of Wang et al. (2012), a MW mass
of MM W = 5.5 · 1011 M will give a 84% probability of finding only three
satellite galaxies with a circular velocity peak higher than Vmax > 30 km/s:
this is what we expect since, apart from the LMC, SMC and Sagittarius,
all the other classical dwarfs have been shown (e.g. Strigari et al. 2010) to
inhabit haloes with a maximum circular velocity below 30 km/s. However,
such a low mass for the Milky Way will reduce the probability that it hosts
two satellites as the LMC and SMC; that our galaxy system is rare, with
only ∼ 3.5% of the MW-like candidates having two satellites as bright as
the Magellanic Clouds, has been found observationally by studies using the
Sloan Digital Sky Survey (Liu et al. 2011; Guo et al. 2011; Lares et al. 2011;
Tollerud et al. 2011). We remark that, despite a lower Milky Way mass, subhalo density profiles should nevertheless be described by an Einasto model
in order to properly match the kinematic of the observed classical dSphs
with the subhaloes in hydrodynamical simulations. Finally, even assuming
a small mass for the Milky Way and an Einasto profile for its satellite galaxies, there is still a problem in assigning the correct halo masses to dwarf
69
4.6. CONCLUSION AND DISCUSSION
galaxies, as highlighted in Ferrero et al. (2012). These authors showed that
the MW’s dSphs, as well as many isolated dwarf galaxies with spatially
resolved rotation curves and stellar mass 106 < Mgal /M < 107 , seem to
live in haloes with M < 1010 M , which is at odds with the abundancematching prediction of Guo et al. (2010) and Moster et al. (2010): the
validity of ΛCDM at such scales is still disputable.
70
Chapter 5
Scale-free mass estimators
applied to the Local Group
The number of satellite galaxies found in numerical simulations within
the virial radius of their host halo is strongly dependent on the host halo
mass itself, as highlighted in Section 3.3 (Di Cintio et al. 2011). A halo
mass of about 5 − 8 · 1011 M for the Milky Way has the potential to solve
the TBTF problem, as discussed in Section 4.6 (Di Cintio et al. 2013). It
is fundamental therefore to have a good estimation of the mass of the host
galaxy, in this case our own Milky Way and Andromeda, in order to put
constraint on the expected number of bright substructures that one would
find.
In this chapter, we proceed in analyzing the performance of one particular mass estimator. We use the recently proposed scale-free mass estimators
(Watkins et al. 2010) to determine the masses of the Milky Way (MW) and
Andromeda (M31) galaxy in a dark matter only Constrained Local UniversE Simulation (CLUES). While these mass estimators work rather well
for isolated spherical host systems, we examine here their applicability to
a simulated binary system with a unique satellite population similar to the
observed satellites of MW and M31. We confirm that the scale-free estimators work also very well in our simulated Local Group galaxies with the
right number of satellites which follow the observed radial distribution. In
the isotropic case and under the assumption that the satellites are tracking the total gravitating mass, the power-law index of the radial satellite
distribution N (< r) ∝ r3−γ is directly related to the host’s mass profile
M (< r) ∝ r1−α as α = γ − 2. The use of this relation for any given γ leads
to highly accurate mass estimations which is a crucial point for observer,
since they do not know a priori the mass profile of the MW and M31 haloes.
We discuss possible bias in the mass estimators and conclude that the scale71
5.1. INTRODUCTION
free mass estimators can be satisfactorily applied to the real MW and M31
system.
5.1
Introduction
Although measurements of gas rotation curves are often precise enough
to constrain the inner most mass of galaxies like the Milky Way (MW)
and Andromeda (M31) (within a few tens of kpc), kinematics of a tracer
populations are needed to compute the mass within greater radii. These
tracers can either be globular clusters or planetary nebulae (e.g. Schuberth
et al. (2010);Woodley et al. (2010)), halo stars (Xue et al. 2008) or satellite
galaxies (e.g. Watkins et al. (2010)). Since the kinematics of these objects
are determined by the underlying host potential they allow for an estimate
of the enclosed mass within their respective distances from the center of the
host.
Kinematic data of galaxies in clusters have already been used to compute
the mass profiles and galaxy orbits in nearby clusters (Wojtak & Lokas
2010); moreover, the mass of four Milky Way dwarf spheroidals (dSphs)
satellites were constrained with high precision thanks to kinematic data sets
(Lokas 2009). Line-of-sight kinematic observations enable accurate mass
determinations at half-light radius for spherical galaxies such as the MW
dSphs (Wolf et al. 2010): at both larger and smaller radii however, the mass
estimation remains uncertain because of the unknown velocity anisotropy.
Regarding our own Galaxy, having position and proper motion data of
the MW’s satellite galaxies would allow one to satisfactorily apply the great
majority of kinematic mass estimators to the calculus of the Milky Way’s
mass, including the recently proposed “scale-free projected mass estimator”
(Watkins et al. 2010,hereafter W10).
In the very near future the knowledge of the full six-dimensional phasespace information for all objects, in the close Universe, brighter than G ≈ 20
mag, is going to be dramatically improved thanks to space missions, like
GAIA1 , whose goal is to create the largest and most precise three dimensional chart of the Milky Way by providing precise astrometric data like
positions, parallaxes, proper motions and radial velocity measurements for
about one billion stars in our Galaxy and throughout the Local Group (LG).
An et al. (2012) recently showed that new proper motions data with the
targeted GAIA accuracies will be able to outperform the presently existing
line-of-sight based mass estimators. But until the proper motions of these
1
http://www.gaia.esa.int
72
CHAPTER 5. SCALE-FREE MASS ESTIMATORS APPLIED TO THE
LOCAL GROUP
satellite galaxies become available, one needs to rely on assumptions and
simplifications.
One of the first estimators of the mass contained within the LG is based
on the “timing” argument of Kahn & Woltjer (1959). More accurate mass
estimators for spherical systems are based either on the virial theorem or on
the moments of projected mass, as first introduced by Bahcall & Tremaine
(1981). They assumed that only projected distances and line-of-sight velocity information were available, and demonstrated the goodness of the
projected mass estimator. The main advantages of such a projected mass
estimator over the virial theorem, neglecting the uncertainties in the eccentricity distribution, are that they are unbiased, their variance is known, and
they converge to the real mass with an error proportional to N −1/2 , where
N is the sample number. Moreover, the information from every tracer particle is equally weighted, contrary to what happens for the virial theorem
case.
Previous studies successfully used these mass estimator methods to “weigh”
M31; and more recently, W10 developed alternative forms of estimators that
can also be applied to the calculus of the MW’s mass: they rely on the assumption that both the host galaxy and its distribution of tracer objects
are spherically symmetric. What is still unclear however, is the shape of the
MW and M31 halo, with various authors in the literature disagreeing over
whether its triaxial (Law et al. 2009) or spherical (Koposov et al. 2010).
Deason et al. (2011) and Evans et al. (2011) have demonstrated the statistical validity of the W10 mass estimators using a set of 431 parent haloes
and 4864 associated satellite galaxies, taken from the GIMIC simulations
(Crain et al. 2009): under the assumption of having a host profile of the
type NFW (Navarro et al. 1996b), they found that the fraction of estimated
halo mass which lies within a factor of two of the true mass is about 80%.
In this work we aim to gauge the quality of the method introduced
in W10 by using the Local Group identified in the WMAP5 dark matter
only constrained cosmological simulation of the CLUES project, a numerical
laboratory for testing the applicability of such a method to the MW and
M31.
Observational data of the nearby Universe are used to constrain the initial conditions of the CLUES simulations. These constrained simulations,
in which the Local Group lies in the right cosmological environment, provide a complementary approach, with respect to cosmological simulations,
to make a comparison between numerical results and observations. Thus,
verifying the robustness of the W10 mass estimators in our unique simulated LG is an important test in addition to the more statistical methods
73
5.2. SIMULATION DETAILS
offered by cosmological simulations (Deason et al. 2011).
The idea is to verify whether these estimators can accurately be applied
to a system such as the one found in our LG and composed of the Milky
Way and the Andromeda galaxy. The arrangement and formation history
of this galactic binary system, according to our present state-of-the-art of
numerical simulations, is rather unique and involves preferential infall directions of their subhaloes (Libeskind et al. 2011b), a backsplash population
(Knebe et al. 2011c), and even renegade satellites (Knebe et al. 2011b),
i.e. satellites that change their affiliation from one of the two hosts to the
other. Furthermore, the MW and M31 satellites do in fact remember the
non-random nature of their infall after several orbits (Libeskind et al. 2012).
We also need to mention that – when comparing constrained against unconstrained simulations – only 1-3% of the Local Group candidates share
similar formation properties (Forero-Romero et al. 2011).
Moreover, the observed Milky Way satellites are found to be highly
anisotropical, lying within a thin disc which is inclined with respect to
the MW’s one, with a minor-to-major axis ratio c/a ≈ 0.3: this flattened
distribution is not compatible with the satellites to have been randomly
selected from an isotropic subset (Kroupa et al. 2005; Metz et al. 2007,
2008). Previous cosmological simulations showed anisotropy in the subhaloes population, with the brightest satellites distributed along disk-like
structures, consistently with the observed MW satellites (cf. Knebe et al.
2004; Libeskind et al. 2005; Zentner et al. 2005). This anisotropy, which
is also observed in our simulated subhaloes, may in principle cause a bias
in the application of the mass estimator, since the hypothesis of spherical
symmetry is broken.
We therefore raise (and answer) the question about the applicability of
scale-free mass estimators to such a special system as the Local Group.
5.2
Simulation details
The dark matter only simulation used here forms part of the Constrained
Local UniversE Simulations (CLUES) project described in Section 2.1. We
used the highest resolution run in a WMAP5 cosmology (Komatsu et al.
2009) in order to reach a resolution equivalent to 40963 particles within a
sphere of 2h−1 Mpc centered on the Local Group.
Within this environment we identified two main haloes, formally corresponding to the Milky Way and the Andromeda galaxy, whose main
properties are listed in Table 5.1, together with their corresponding actual observational properties. The virial mass of each halo is in units of
74
CHAPTER 5. SCALE-FREE MASS ESTIMATORS APPLIED TO THE
LOCAL GROUP
1012 M , while the virial radius and the distance between the two hosts,
listed as D, are in Mpc. Both these quantities are based upon the definition
3
) = ∆vir ρb where ρb is the cosmological background
M (< Rvir )/(4π/3Rvir
density and ∆vir = 354 for the considered cosmology and redshift z = 0.
The concentration is c2 = Rvir /r2 , where r2 denotes the ”scale radius” where
the product ρ(r)r2 reaches its maximum value. The two axis ratios b/a and
c/a are derived from the eigenvalues a > b > c of the moment of inertia
tensor, and the vertical-to-planar axis ratio is reported for M31. The α
parameter is the exponent corresponding to a scale-free host mass profile
M (r) ∝ r1−α , see Section 5.3.1 for more details. The observationally derived masses are based on the work of W10, and represent the estimates of
each galaxy mass assuming a virial radius of 300 kpc, using the observed
anisotropy parameter β and including satellites’ proper motions.
A complete summary of the characteristic of the subhaloes population
of the two main haloes, MW and M31, is shown in Table 5.1, together
with a comparison of the properties of their observed satellite galaxies. The
haloes and sub-haloes have been identified using the AHF halo finder, as
described in Section ahf. The rout and rin are the radius of the outermost
and innermost tracer, respectively, in Mpc (in the case of M31 we listed the
projected distances). The quantity Nsat represents the number of simulated
subhaloes (or observed satellite galaxies) within 0.3 Mpc from each host
center.
5.3
Scale-free mass estimators
Even though the mass estimators are derived under the assumption that
the respective distributions are scale-free, they have nevertheless been successfully applied to the observed MW and M31 (W10) where the hierarchical structure formation model supports the notion that the density profile
of dark matter haloes follows the functional form originally proposed by
Navarro et al. (1996b), i.e. the so-called NFW profile.
Xue et al. (2008) constrained the mass distribution of the MW’s dark
matter halo by analyzing the kinematic of thousands of blue horizontalbranch halo stars, finding a profile that is consistent with a combination of
a fixed disk and bulge model with a NFW dark matter halo. Seigar et al.
(2008) have derived new mass models for M31, and found that while a NFW
and an adiabatically contracted NFW profiles can both produce reasonable
fits to the observed rotation curve of M31, the pure NFW model requires
a halo concentration too high with respect to the range predicted by the
ΛCDM cosmology, and is therefore disfavoured. Thus, it is still debatable
75
5.3. SCALE-FREE MASS ESTIMATORS
Table 5.1: Main properties of the two haloes (representing the MW and M31
galaxy, respectively) considered in this work, and of their respective subhaloes
population. The virial mass of each halo is in units of 1012 M , while the virial
radius and the distance between the two hosts, D, are in Mpc. We listed the
observational inferred quantities of MW and M31, that refer to the work of: (a)
W10, (b) Law et al. (2009), (c) Banerjee & Jog (2008), (d) McConnachie et al.
(2005), (e) Mateo (1998), (f) Ibata et al. (2007), (g) Martin et al. (2008), (h)
Karachentsev et al. (2004).
property
Mvir
Rvir
c2
b/a
c/a
α
D
Nsat
rout
rmin
MW
M31
simulation
1.674 2.226
0.310 0.340
11.7
10.7
0.937 0.978
0.883 0.872
-0.034 -0.052
0.782
1205
1405
0.309 0.340
0.018 0.014
MW
M31
observed
2.7 ± 0.5(a)
1.5 ± 0.4(a)
(a)
0.300
0.300(a)
0.83(b)
0.4(c)
0.67(b)
0.785 ± 0.025(d)
24
21
0.250 ± 0.003(e)
0.270(f )
0.023 ± 0.002(g)
0.005(h)
76
CHAPTER 5. SCALE-FREE MASS ESTIMATORS APPLIED TO THE
LOCAL GROUP
whether the Milky Way and Andromeda galaxy haloes actually follow a
NFW profile.
In this Section we briefly introduce the scale-free mass estimators, which
are directly taken from W10: we refer the reader to their work for a derivation of the respective formulae.
5.3.1
Theory of mass estimators
Here we present the four relevant formulae and the three parameters
each formula depends on: we see that the mass estimator takes different
forms according to the available informations from the tracer populations.
Full Information Estimator (FIE)
In the optimum case that the full six-dimensional phase-space information is accessible, the mass estimator can be written as:
Ntracer
C 1 X
M (< rout ) =
vi2 riα ,
G N i=1
with C =
α + γ − 2β 1−α
rout
3 − 2β
(5.1)
(5.2)
Where v and r are the velocity and distance of each individual tracer particle, rout represents the radius of the outermost tracer, and G is the gravitational constant. The dimensional constant C is constructed out of three
additional parameters determined by the host potential (α), the tracer’s radial distribution (γ), and the tracer’s velocity anisotropy (β), more details
in Section 5.3.1 where these parameters are algebraically defined. Note that
we can only estimate the halo mass contained within the outer radius rout
set by the distance to the farthest tracer. The mass is then constructed as
an average of v 2 rα over the total number of tracer objects, Ntracer . We will
refer to Eq. (5.1) as the Full Information Estimator or simply FIE.
Radial Information Estimator (RIE)
In the case that only the radial velocity, with respect to the center of
the host galaxy, and the individual distances of the tracer population are
known, vr and r respectively, a different definition of the constant C must
be used:
77
5.3. SCALE-FREE MASS ESTIMATORS
Ntracer
C 1 X
M (< rout ) =
v 2 rα ,
G N i=1 r,i i
(5.3)
1−α
with C = (α + γ − 2β)rout
(5.4)
We shall call this the Radial Information Estimator, RIE: this case applies
to our own Milky Way. Since we do not have the proper motion of all of
its satellites, but just of 9 of them (see for instance Metz et al. (2008)), it
is safer to assume the RIE. It must be noticed that in absence of proper
motion vr may be calculated from vlos by using the statistical correction:
< vr2 >=
2
< vlos
>
1 − β sin2 φ
(5.5)
where φ is the angle between the vector from the galactic centre to the
satellite and the vector from the sun to the satellite. As we can see, this
correction further depends from the anisotropy parameter β. We will come
back to the proper placement of the observer and the relevance of this
correction, respectively, later on.
Line-of-Sight Information Estimator (LIE)
When using only projected line-of-sight velocities vlos and actual distances r for the tracer population, the mass estimator referred to as the
Line-of-sight Information Estimator, or LIE, and may be written as:
Ntracer
C 1 X
M (< rout ) =
v 2 rα ,
G N i=1 los,i i
with C =
3(α + γ − 2β) 1−α
rout
3 − 2β
(5.6)
(5.7)
This estimator must be used, for example, when calculating the mass of the
Andromeda galaxy.
Projected Information Estimator (PIE)
In the worst case scenario in which the only data available are both projected distances R and line-of-sight velocities vlos for the tracer population,
the corresponding estimator is:
78
CHAPTER 5. SCALE-FREE MASS ESTIMATORS APPLIED TO THE
LOCAL GROUP
Ntracer
C 1 X
M (< rout ) =
v 2 Rα ,
G N i=1 los,i i
with C =
α + γ − 2β 1−α
rout
Iα,β
(5.8)
(5.9)
where
Iα,β =
π 1/2 Γ( α2 + 1)
[α + 3 − β(α + 2)]
4Γ( α2 + 52 )
(5.10)
and Γ(x) is the gamma function. We will refer to this last equation as the
Projected Information Estimator, PIE.
The parameters α, β, and γ
The ever present constant C is composed of three parameters, describing
the host potential as well as particulars of the tracer population, under the
assumption that they both can be sufficiently described by scale-free models.
We further assume spherical symmetry for our tracer population.
The α parameter corresponds to a scale-free gravity field, which is equivalent to a host mass profile of the form:
M (r) ∝ r1−α
(5.11)
or, equivalently, to a mass density that scales as ρ ∝ r−(α+2) .
The β parameter is the Binney velocity anisotropy parameter (Binney
& Tremaine 1987), defined as:
β =1−
σt2
2σr2
(5.12)
in which σt2 and σr2 are the tangential and the radial velocity dispersions of
the tracer objects. β provides information about the orbital distribution of
our tracer population.
Lastly, the γ parameter represents the exponent of the power law describing the radial number density distribution n(r) of the tracer population:
79
5.3. SCALE-FREE MASS ESTIMATORS
n(r) ∝ r−γ .
(5.13)
These three parameters are fundamental in describing the geometry of
the system and, together with the kinematical information of the tracers,
allow us to compute an accurate estimator of the mass of a host halo.
It is thus absolutely essential that they are determined with the highest
possible accuracy. In reality however, this is not always possible: we are
often forced to make assumptions regarding the form of the underlying host
potential. Moreover, the number of the known satellites of both Milky Way
and Andromeda is only ∼ 25, making the determination of the γ parameter
relatively inaccurate. In addition, in the Milky Way’s case, only 7 of these
objects have accurately measured proper motions: with such a small sample
the velocity anisotropy β is widely unconstrained by data. In the next
Section 5.3.2 we will present the dependence of the mass estimator on each
of these parameters, computing – for a specific case – the error introduced
by uncertainty in α, β, and γ, respectively.
5.3.2
Dependence of the mass estimators on the parameters
Given the inherent inaccuracy in determining the three model parameters, we would like to gauge the sensitivity of the mass estimators to their
uncertainties, considering an adequate set of subhaloes covering a radial
range out to rout .
γ dependence
We aim to study the dependence of the mass estimator on the parameter
γ, which represents the exponent describing the radial distribution of the
satellites population. We therefore calculated the relative variation of the
estimated mass per variation in γ:
∆M
1
=
M ∆γ
α + γ − 2β
(5.14)
We note that Eq. (5.14) is valid for the four cases of FIE, RIE, LIE and
PIE, being independent from the radial distribution of satellites; it provides
a tool for calculating the expected uncertainty in the mass determination
given the expected errors in γ.
Assuming an isotropic distribution of orbits, i.e. β = 0, we focus on
the real case scenario in which the γ parameter is γ ∼
= 2 (as found in W10
80
CHAPTER 5. SCALE-FREE MASS ESTIMATORS APPLIED TO THE
LOCAL GROUP
Figure 5.1: Relative variation per unit parameter change of the mass estimated
as a function of the β parameter in the case of FIE/LIE (left panel) and RIE
(right panel) estimators. The fractional error in the mass estimation is larger for
the RIE estimator, used for MW, than for the FIE/LIE estimators, applicable to
M31. See full text for more details.
for the observed satellites of MW and M31): allowing for an uncertainty
of ∆γ/γ ∼ 25%, and recalling the typical value for α that is around 0.55
for a NFW host (e.g., W10), we see that the error in the estimated mass is
as high as ∆M/M ∼ 20%. This error will be even larger when considering
smaller value of γ and α, as well as for β > 0.
β dependence
Regarding the changes in the mass estimation due to the anisotropy parameter, we recall that this parameter is directly obtained from the velocities
of the tracer population, computing the tangential and the radial velocity
dispersion of each subhalo (as opposed to the α and γ parameter, which
are derived by assuming a power law distribution). The β average value
has been found to be β ∼ −0.3 and β ∼ −0.02 in our CLUES simulation,
for the full set of subhaloes of the MW and M31, respectively. While these
values of β indicate that we are close to the isotropic regime, i.e. β = 0, the
MW anisotropy parameter slightly favors tangential orbits, in agreement
with the measured proper motions of the known MW satellites. It is thus
essential to understand how the variation in the β parameter affects the
determination of the host mass. For the RIE estimator the corresponding
equation reads
81
5.3. SCALE-FREE MASS ESTIMATORS
∆M
M ∆β
=
RIE
−2
α + γ − 2β
(5.15)
whereas for the FIE and LIE cases it is
∆M
M ∆β
=
F IE,LIE
2
2
−
3 − 2β α + γ − 2β
(5.16)
finally, for the PIE scenario
∆M
M ∆β
=
P IE
α+2
2
−
.
α + 3 − β(α + 2) α + γ − 2β
(5.17)
In Fig. 5.1 we present the absolute value of the fractional mass variation
as a function of the β value for the FIE and LIE cases (left panel) and for
the RIE estimator (right panel). We do not plot the mass changes in the
PIE case, as it is practically identical to the FIE and LIE ones. As in the
previous section, considering the general case of having a NFW halo, with
values of β close to zero and γ = 2, which is the usual case for the hosts
considered here and elsewhere (e.g., W10), we find that the error due to
variations of ∆β = ±1 for the FIE, LIE and PIE estimators is actually
quite low and is below 10% for α = 0.55. Moreover, Evans et al. (2011)
found that for much of the radial regime covered by the tracer population,
any variation of the anisotropy parameter within its physical range leads
to the same estimator in the case of the PIE scenario. Thus, in the case
of an external galaxy whose dark matter halo follows a NFW profile with
α = 0.55 and 2 < γ < 3, we can assume to have a minor error due to β:
the major uncertainty in the mass estimation comes from the assumption
made on the α and γ parameters. This last statement is valid for the FIE,
LIE and the PIE estimator: it does not matter if we have real satellites
distances or projected ones, the biggest error on the mass does not come
from the anisotropy parameter.
The situation is however, completely different for the MW galaxy, for
which the RIE formula holds, i.e. we have radial information on the satellite
velocities. In this case, a variation of ∆β = ±1 could cause an error in the
mass estimation of around 80% if we have γ = 2 and α = 0.55. Therefore,
the β parameter is unfortunately the greatest concern in the calculus of the
mass of our own Galaxy. Please note that if we knew the three dimensional
velocities of the MW satellites as opposed to only the radial ones, we would
82
CHAPTER 5. SCALE-FREE MASS ESTIMATORS APPLIED TO THE
LOCAL GROUP
be dealing with Eq. (5.16), thus being in the regime in which the correct
evaluation of the β parameter will only have a subordinate influence.
We close by remarking that this discussion perfectly agrees with the
previous study of the influence of the β parameter on the mass estimation
as presented in W10.
α dependence
Finally, we computed the amount or error introduced by uncertainties
in the α parameter, which is directly connected to the potential of the host
halo. The fractional variation of the estimated mass, for the FIE estimator,
is:
∆M
M ∆α
F IE
1
− ln(rout ) +
=
α + γ − 2β
P
vi2 riα ln(ri )
iP
2 α
i vi ri
(5.18)
where the summation, as usual, is performed over the total number of tracers
Ntracer and rout is the radius of the outermost subhalo. Eq. (5.18) is formally
identical for the RIE and LIE case as well, after substituting the full velocity
v with the radial velocity vr or the line-of-sight vlos one, respectively.
When dealing with the PIE scenario, instead, the error can be calculated
through the following equation :
∆M
M ∆α
P IE
1
=
− ln(rout ) +
α + γ − 2β
+
P
i
v 2 Rα ln(Ri )
Plos,i 2 i α
+
i vlos,i Ri
Ψ( α2 + 52 ) Ψ( α2 + 1)
1−β
−
−
2
2
α + 3 − β(α + 2)
(5.19)
where Ψ(x) is the digamma function, defined as the derivative of the logarithm of the Γ(x) function.
Unlike the other cases, we can not give a generalized estimation of the
error introduced by the α parameter, it being dependent on the radial distribution of the satellites population: this uncertainty varies for every specific
scenario and needs to be calculated individually.
83
5.4. APPLICATION TO THE CLUES SIMULATION
5.4
Application to the CLUES simulation
We now move to the application of the scale-free mass estimators to a
situation as close as possible to our Local Group. To this extent we use the
CLUES simulation introduced in Section 5.2. While we are certain that the
scale-free approximation leads to credible results as shown by W10, Evans
et al. (2011) and Deason et al. (2011), it remains to be seen whether the
uniqueness of the Local Group with its binary host system and particular formation history involving preferential infall (Libeskind et al. 2011b),
renegade satellites (Knebe et al. 2011b) and anisotropically distributed subhaloes (not explicitly shown here) will effect the mass estimate. Moreover,
we would like to gauge the accuracy of these mass estimators when fewer
tracers are used, as in the real LG.
From now on we will refer to the case of an observer that is placed at
the center of our Galaxy and looking towards the MW’s satellites or to the
nearby M31’s ones. The choice to put the observer in the galactic center
instead that at the solar radius may affect the determination of vr from
vlos , given the fact that the radial velocity should be computed with respect
to the sun. However, this is practically identical to the radial velocity
with respect to the galactic center for distant tracers, for which sin φ ∼ 0,
which is the case for our subhaloes. Moreover, the anisotropy parameter β,
which appears in the correction factor of Eq. (5.5), has always been found
to be very close to zero in our simulations (as reported in Section 5.3.2).
Nevertheless, when applying the different mass estimators we also used the
correction factor given by Eq. (5.5), placing the observer on a sphere of
radius 8 kpc from the galactic center, and we verified that the affect of this
correction is at the < 0.5% level. We will thus refer, through this study, to
the case of an observer placed in the galactic center.
5.4.1
Obtaining the parameters α, β and γ
In order to apply the mass estimator method to our simulated galaxies, we need to calculate the three unknowns α, β and γ that appear in
Eq. (5.1),(5.3),(5.6) and Eq. (5.8).
The satellite parameters: γ and β
The γ parameter is simply obtained by fitting the radial number distribution N (< r) of each host’s subhaloes to the functional form
84
CHAPTER 5. SCALE-FREE MASS ESTIMATORS APPLIED TO THE
LOCAL GROUP
N (< r) ∝ r3−γ ,
(5.20)
assuming that the number density n(r) follows Eq. (5.13).
The velocity anisotropy parameter β, as defined in Eq. (5.12), is obtained
by first calculating the radial velocity dispersion of the subhaloes, projecting their velocities along the radial axis, then by computing the tangential
component of σ through the relation
2
σt2 = σtot
− σr2 = (σx2 + σy2 + σz2 ) − σr2 .
(5.21)
While β and γ can be directly computed in the FIE and RIE cases, in order
to calculate them in the LIE scenario we first need to derive the line-ofsight component of the velocity vectors of the subhaloes. The line-of-sight
velocity depends on the viewing angle of the host which is unknown in our
simulations. We thus randomly rotate each host and its subhaloes Nrot = 5
times, taking the mean of all these resulting line-of-sight velocity to compute β. We perform a small number of rotations of the whole system since
otherwise, by averaging over a higher number of rotations, we converge to
the FIE case. The same methodology has been applied to the PIE case
where we additionally had to project the distances of the tracers objects
into the observers plane in order to obtain the γ parameter.
The host halo parameter: α
To get the value of α, we must recall that since our haloes are not scalefree but rather follow a NFW profile (Navarro et al. 1996b), the applicability
of a power-law is limited. While for a pure scale-free model it is irrelevant
whether we fit the gravitational potential, the density or the mass profile of
the host halo (see W10), it will most certainly lead to differences when the
scale-invariance is broken. Recall that for a scale-free model:
φ(r) ∝ r−α ⇔ ρ(r) ∝ r−α−2 ⇔ M (r) ∝ r1−α .
(5.22)
For a NFW object however, we must identify which quantity is the most
suitable to be fitted, and we decided to use the cumulative mass profile
M (r) since this is the least noisy from a numerical point of view.
Furthermore, since our halo does not follow a scale-free profile (either
in mass or in potential), the actual value of α depends on the radial range
85
5.4. APPLICATION TO THE CLUES SIMULATION
Table 5.2: Value of the α parameter and its fractional error ∆α/α obtained
by fitting the numerical mass profiles of the MW and M31 over different radial
ranges.
Radial Range
[0, 1]Rvir
[0.4, 1]Rvir
[0.8, 1]Rvir
MW
α
-0.034
0.302
0.398
∆α
α
70 %
8%
3%
M 31
α
-0.052
0.266
0.402
∆α
α
60%
9%
7%
used to fit it, i.e. α(r) 6= const.
We thus provide, in Table 5.2, the numerically fitted values of α, obtained
by fitting the total mass halo profile in different radial ranges, specifically
in the total range, in the outermost one, and in the intermediate range,
together with their fractional relative errors, where we indicate with ∆α
the 1σ error on α as found from the fitting routine.
As in the previous case of the γ parameter, we used a Poissonian weight
(1/Nsub ) to associate errors to the data during the fit: as expected, the
smallest relative error is obtained in the outermost radial range, confirming
that in this regime the host density profile is best approximated as being of
scale-free nature.
We obtained for the MW and M31 in the total radial range a value of
α = −0.034 and α = −0.052 respectively, as listed already in Table 5.1,
while we can observe how the α value increases when we move to the outer
part of the halo, as expected if the halo is following a NFW profile, since it
gets steeper towards the outer part of the distribution.
While using the numerical mass profile given by the simulation data is
actually a self-consistent way to obtain α, we note that an observer would
require a mass model to actually determine the α parameter to be used
with the mass estimators. Since an observer does not have any a-priori
knowledge of the radial mass distribution (or potential) of the host halo,
an analytical profile must be assumed. Note that W10 showed that for an
object following a NFW profile the typical value of α is ≈ 0.55, based upon
fitting a NFW potential in the range [10, 300] kpc to a power-law φ ∝ r−α
and assuming to have hosts with concentration between c = 18 and c = 8.
Given the uncertainty on the actual density profile of the real hosts, we
decided to allow for the estimates of α in two different ways:
1. using the values derived by fitting our numerical profile at different
86
CHAPTER 5. SCALE-FREE MASS ESTIMATORS APPLIED TO THE
LOCAL GROUP
radial ranges, or
2. using the relation α = γ − 2, which holds true if the subhaloes are
tracking the total gravitating mass of the hosts.
5.4.2
Results for the simulated MW and M31
The application of the scale-free mass estimator to the (observationally)
unrealistic scenario in which we have N ∼ 1000 tracers, as found in our
simulated haloes, gives excellent results for all the estimators FIE, RIE,
LIE and PIE. Using the error formulae listed in Section 5.3.2, and allowing a maximum error on the calculation of the parameters α, β and γ of
about ∼ 20%, we obtained the MW mass at the Rvir = 309 kpc within a
5% of uncertainty and the M31 mass at the Rvir = 340 kpc within a 3%
of error, respectively (FIE estimator). However, we decided not to show
these results and rather focus on more interesting and practical situations
where the number of tracer objects is limited and agrees better with the
actual observed Local Group. We must note however, that part of our
initial questions has been already answered by this exercise: the scale-free
mass estimators are even applicable to a system of host haloes such as the
(observed) Local Group for which they were originally designed.
Matching the number of the observed satellites
As shown in Table 5.1, the total number of subhaloes found within
300 kpc in our simulations substantially differs from the number of observed
satellites galaxies of the Milky Way and Andromeda within the same radius
(the well known missing satellites problem, first addressed in Klypin et al.
(1999b) and Moore et al. (1999)). Thus, we would like to calculate the
accuracy of the mass estimators when the number of tracers is comparable
to the real one, i.e. N ∼ 30 (we explicitly chose this number to be able to
have a direct comparison with the W10 results, see for example their Fig.1).
Further, the real case scenario is the one for which we have the radial velocities of the MW satellites and the line-of-sight velocities of the M31 tracers:
in the forthcoming analysis we will thus only use the RIE estimator for the
Milky Way and the LIE one for the Andromeda galaxy.
From the total set of subhaloes we randomly selected N = 30 objects
that covered the total range within rout < 300 kpc and computed their velocity anisotropy and their radial distribution, thus obtaining the β and γ
coefficients. For this particular exercise, the α parameter was numerically
evaluated using the three different radial ranges of the host mass profile
87
5.4. APPLICATION TO THE CLUES SIMULATION
Table 5.3: Mean value and standard deviation of the Gaussian distribution of the
estimated mass over the true mass for the MW and M31 hosts, using the RIE and
the LIE, respectively, for the three considered values of α (cf. Table 5.2). The
number of subhaloes has been limited to 30 random ones, and they have been used
to compute β and γ for each realization. The average values of these parameters
over the total N = 1000 realizations are γ = 1.63 ± 0.12 and β = −0.307 ± 0.061
for the MW, and γ = 2.013 ± 0.013 and β = −0.006 ± 0.001 for M31.
α
-0.034
0.302
0.398
MW
µ
1.057
0.992
0.975
σ
0.204
0.177
0.169
α
-0.052
0.266
0.402
M 31
µ
1.060
0.958
0.931
σ
0.257
0.167
0.159
listed in Table 5.2 (ignoring the option to evaluate it as α = γ − 2 for the
moment). For each of these values of α we performed 1000 random realization, we applied the scale-free mass estimator and we calculated the distribution of the ratio of the estimated over the actual mass, i.e. Mest /Mtrue ;
those distributions have then been fitted by a Gaussian curve eventually
leading to the best-fit parameter µ and its standard deviation σ.
The results of these tests (for the α value evaluated from the total radial
range, i.e. first line of Table 5.2) are summarized in Fig. 5.2 for the MW
and Fig. 5.3 for M31 where we plot in the left panels the distributions of
Mest /Mtrue for the FIE mass estimators and in the right panels the RIE
(MW) and LIE (M31), respectively. The legends of each panel further list
the three parameters α, γ, and β relevant for the respective mass estimator
(where β and γ represent the average value over the total 1000 realizations)
alongside the peak and standard deviation of the √
best fit Gaussian. Note
that the standard deviation is compatible with 1/ Nsub where Nsub is the
number of used tracers, and it increases when only radial velocities (or lineof-sight ones) are used. Remarkably, the mean of the distribution stays
always very close to µ = 1.0: the mass estimators are thus unbiased with
respect to the number of used objects. We repeated the above mentioned
analysis for the other values of α listed in Table 5.2, and found practically indistinguishable results: the best-fit µ and σ values are given in in
Table 5.3.
In summary, we found that for both host systems the mass is always
recovered within a few percent of error when restricting the analysis to 30
randomly selected subhaloes each.
88
CHAPTER 5. SCALE-FREE MASS ESTIMATORS APPLIED TO THE
LOCAL GROUP
Figure 5.2: Distribution of 1000 realizations of the estimated mass over the real
one for 30 subhaloes of the simulated Milky Way. The average value of the
parameters β and γ obtained in each realization is shown. The best-fit Gaussian
is also plotted, and its mean µ and standard deviation σ are indicated. The left
panel corresponds to the FIE estimator, the right panel to the RIE one.
Figure 5.3: Distribution of 1000 realizations of the estimated mass over the real
one for 30 subhaloes of the simulated Andromeda galaxy. The average value
of the parameters β and γ obtained in each realization is shown. The best-fit
Gaussian is also plotted, and its mean µ and standard deviation σ are indicated.
The left panel corresponds to the FIE estimator, the right panel to the LIE one.
89
5.4. APPLICATION TO THE CLUES SIMULATION
Figure 5.4: Radial distribution of the observed MW satellites and corresponding
best fit in the range r < 300 kpc.
Matching the radial number distribution of the observed satellites
While using 30 randomly chosen subhaloes leads to exceedingly well
recovered host masses, we acknowledge that our model subhaloes (for the
MW) do not follow the same radial distribution as the observed ones (why
this is the case is substance for yet another study and shall not be addressed
here): we list in Table 5.4 the distances to all presently known MW satellites
(taken from Wadepuhl & Springel 2011) alongside their masses and use this
data to obtain the observed γ ± ∆γ = 2.80 ± 0.08 by fitting the radial
distribution to a power-law in Fig. 5.4. Please note that we only focus on
the MW’s subhaloes here, as in the case of M31 the γ = 2.013 coefficient
is very similar to the one obtained from the observed satellites distribution
(see W10).
From the total set of subhaloes in our numerical MW, we constructed
a subset of 30 tracers by selecting those objects that follow the radial distribution N (< r) ∝ r3−2.8 . Further care was taken to verify that the randomly selected subhaloes always cover the (observational) radial range up
to ∼ 300kpc. While the γ = 2.8 is fixed by construction the β has always
been derived from this subset; for the α we first used, again, the three values
listed in Table 5.2, and we found a notable bias in the Gaussian distribution of Mest /Mtrue , as high as the 80%: this choice of α does not provide the
expected host mass. Thus, we secondly decided to verify if the assumption
that the tracers are tracking the total gravitating mass of the host can pro90
CHAPTER 5. SCALE-FREE MASS ESTIMATORS APPLIED TO THE
LOCAL GROUP
Figure 5.5: Distribution of the estimated RIE mass over the real one for 30
subhaloes of the Milky Way and 1000 realizations. The subhaloes have been
selected following the power law with γ = 2.8 (left panel) as well as additionally
also constraining them to lie within the observed mass range (right panel). Note
that in both cases α has been determined as α = γ − 2.
vide a better constrain on the value of α, i.e. using the relation α = γ − 2.
In this case, without making any fits to the numerical shape of the host
profile, we actually found results in excellent agreement with the true mass,
as shown in the left panel of Fig. 5.5. In the right panel of the same figure
we show the distribution obtained when yet another additional constraint
was added, i.e. we selected only those subhaloes whose mass lies between
5 · 106 < M/M < 1 · 108 , in order to resemble the average mass of the
observed MW satellites (see Table 5.4). Also in this case we can observe
that the Gaussian is peaked very close to 1.0, at µ = 1.016.
We finally decided to also test and use the suggested value of α = 0.55
(W10), but we actually obtained a Gaussian mean value for µ that is biased
by approximately 30% towards large estimated masses.
In summary, even when restricting the subhaloes to follow the same
power-law as the observed satellites within the same mass range, the scalefree mass estimators are capable of recovering the true mass of our constrained MW and M31 if one chooses to use α = γ − 2 (being close to the
isotropic regime, i.e. β = 0 and as far out as β = −0.5).
91
5.4. APPLICATION TO THE CLUES SIMULATION
Table 5.4: List of the MW satellites used in this work, corresponding to those
lying within 300kpc from the galactic center and with measured line-of-sight
velocities. The Galactocentric distances D are in kpc. The values are from: (a)
Martin et al. (2008), (b) Mateo (1998), (c) Belokurov et al. (2008), (d) van den
Bergh (1994), (e) Belokurov et al. (2009), (f) Simon & Geha (2007), (g) Bekki
(2008), (h) van den Bergh (2000).
Name
D[kpc]
M ass[106 M ]
BooI (a)
BooII (a)
Carina(b)
Com(a)
CV nI (a)
CV nII (a)
Draco(a)
F ornax(b)
Her(a)
LeoI (b)
LeoII (b)
LeoIV (a)
LeoV (c)
LM C (d)
Sag (b)
Sculptor(b)
SegI (a)
SegII (e)
Sextans(b)
SM C (d)
U M aI (a)
U M aII (a)
U M i(b)
W il1(a)
66 ± 3
42 ± 8
101 ± 5
44 ± 4
218 ± 10
160+4
−5
76 ± 5
138 ± 8
132 ± 12
250 ± 30
205 ± 12
160+15
−14
180
49
24 ± 2
79 ± 4
23 ± 2
35
86 ± 4
58
96.8 ± 4
30 ± 5
66 ± 3
38 ± 7
13
1.2 ± 0.4(f )
27 ± 4(f )
2.4 ± 1.1(f )
22
68
7.1 ± 2.6(f )
22
9.7
1.4 ± 1.5(f )
10.000(g)
150(h)
6.4
0.55+1.1
−0.3
19
400(g)
15 ± 4(f )
4.9 ± 2.2(f )
23
-
92
CHAPTER 5. SCALE-FREE MASS ESTIMATORS APPLIED TO THE
LOCAL GROUP
Do we require a host mass profile or simply α = γ − 2?
The analysis in the previous subsection has shown that simply using
α = γ−2 actually leads to excellent results for the scale-free mass estimators
when applied to our constrained Local Group and a subhalo population
restricted to follow the observed one as closely as possible. But can this
finding be generalized, at least with respects to our simulation?
To verify that the assumption α = γ − 2 holds true in general, we
select the subhaloes of both MW and M31 in order to follow different radial
distributions, according to N (< r) ∝ r3−γ , where we allowed the γ to vary
between 1.5 and 3.0. The α coefficient was then calculated consequently,
while the β, as usual, came from the selected satellites velocity dispersions.
In this way we selected N = 30 subhaloes again for 1000 times and we
obtained Gaussian distributions of the Mest /Mtrue quantity. We show the
best-fit µ, with the standard deviation σ as error bars, as a function of γ in
Fig. 5.6 for the MW (left panel, RIE only) and M31 (right panel, LIE only).
The anisotropy parameter was always found to be close to β ∼ 0, with a
maximum variation between −0.3 < β < 0.1, indicating that we are in the
isotropic regime. We would like to highlight that despite other choices of α
may in principle be possible, as demonstrated in Section 5.4.2, the simple
assumption α = γ −2 provides always the best estimation for the host mass,
whose associated Gaussian distribution has mean value µ closer to 1 and
smaller standard deviation σ.
We see that the simple assumption, that the satellites track the total
mass of the host halo, is sufficient to give an excellent estimation of the
parameter α to be used. The suggested value of α = 0.55, indicative of a
NFW halo potential, is thus recommendable when the satellite distribution
follows a power law with exponent γ ∼ 2.5: these values have been already
successfully used in Deason et al. (2011) and Evans et al. (2011). This is
of fundamental importance for observations: without having any a-priori
knowledge about the host halo density profile, we can simply use the value
α = γ − 2 once we have calculated γ from the satellite distribution. This
condition has been verified in our constrained simulations only, in which the
anisotropy parameter is always β ∼ 0: care should be taken when dealing
with satellite populations whose β is highly anisotropic.
In summary, we have shown that our two model hosts within the simulated constrained Local Group allow the application of scale-free mass
estimators to them. And, for as long as we are in the isotropic regime in
which β = 0, the simplifying assumption of α = γ − 2 can be used. This alleviates the need to derive this parameter from a model of the host potential
or mass profile.
93
5.4. APPLICATION TO THE CLUES SIMULATION
Figure 5.6: Mean value µ of the best fit Gaussian distribution for different values
of γ and correspondingly α = γ − 2. The anisotropy parameter lies between
−0.3 < β < 0.1. The distribution is based upon 1000 realization. MW, using the
RIE, left panel, M31, using the LIE, right panel.
5.4.3
Exploring the influence of the MW and M31 on each other
Subhaloes (not) facing the opposite host
The fact that the MW and M31 hosts are close to each other, forming
a binary galactic system, poses the question if the mass estimators work
even in the situation in which we only consider satellites in between the
two haloes. To shed light on this issue we begin by separating the MW
halo into two hemispheres, defined as “facing” and “non-facing” M31 (we
perform the same test for the M31 halo, too). Subhaloes are then grouped
by the hemisphere they sit in. We remark that this is a purely spatial cut,
to investigate if the proximity of the companion host causes some bias on
the mass estimator.
The facing/non-facing subhaloes of the MW are selected according to a
radial number distribution N (< r) ∝ r3−γ with γ = 1.63, and consequently
α = γ − 2 = −0.37, while the M31 subhaloes are selected in order to
follow the distribution with γ = 2.013 and α = 0.013. We chose these
value to match the parameters found in Section 5.4.2, but verified that our
results are not affected by the choice of the specific power law, as already
expected (cf. Fig. 5.6). Finally, we randomly selected N = 30 subhaloes
from each of the two facing/non-facing subsets, repeating the analysis 1000
times and computing each time the parameter β and the estimated mass.
The anisotropy parameter, for both MW and M31 and in every subset of
94
CHAPTER 5. SCALE-FREE MASS ESTIMATORS APPLIED TO THE
LOCAL GROUP
Table 5.5: Milky Way and Andromeda galaxy mass estimation (RIE for MW,
LIE for M31) using the subset of subhaloes facing and non-facing the companion
host. The mean value µ and standard deviation σ of the Gaussian distribution
of the estimated mass over the true one are shown, obtained by selecting N=30
subhaloes from the facing or not facing subsets, repeating 1000 realizations and
evaluating the mass at two different rout .
Host rout
rout,MW
309 kpc
197 kpc
rout,M31
340 kpc
221 kpc
All Subs
µ±σ
0.97 ± 0.12
0.98 ± 0.12
µ±σ
1.02 ± 0.19
1.05 ± 0.19
Facing Subs
µ±σ
1.05 ± 0.16
1.01 ± 0.12
µ±σ
1.08 ± 0.19
1.11 ± 0.22
Not Facing Subs
µ±σ
0.95 ± 0.24
1.03 ± 0.26
µ±σ
0.92 ± 0.15
0.98 ± 0.16
objects considered, has been found to be very close to 0 again, lying between
−0.35 < β < 0.05. We are hence in a situation to explore the influence of
the two hosts on each other: with the β close to 0 and the subhaloes selected
to follow a fixed power law (thus without errors associated to the 3 main
parameters) we can affirm that any deviation in the mass estimation should
now be attributed to the subhaloes facing or not the other host.
In Table 5.5 we show the results of the mean value and standard deviation of the Gaussian distribution of the estimated mass over the true one
for the MW (by applying the RIE) and for M31 (using the LIE). We show
the µ obtained by using the facing subhaloes, the non-facing subhaloes and
also the total set. We did this exercise for two different values for rout , thus
computing the host mass up to this outer radius: in this way we should
be able to observe if the proximity or, on the contrary, the distance of the
subhaloes population to the opposite host has some influence as well. For
the MW host we can observe that the estimator performs equally well when
using the facing or non-facing objects, for each of the two rout values used.
In the case of M31, instead, the non-facing population of subhaloes seems
to give better results in the estimation of the host mass, while the facing
objects lead to a Gaussian distribution whose mean value is slightly biased
(µ = 1.11) when we considered the rout = 221 kpc. Given the high uncertainties associated to this biased result however, we can conclude that each
of the main galaxies does not influence the subhalo population of the other
one.
95
5.4. APPLICATION TO THE CLUES SIMULATION
Renegade subhaloes
As already discussed, we call renegade subhaloes those objects, in our
simulations, that change their affiliation from one of the two prominent
hosts in the Local Group to the other (Knebe et al. 2011b). We were able
to identify 129 renegade objects, 57 of which belonging to M31 at z=0, and
the remaining 72 belonging to the MW.
We thus examine the effect that this population of renegade subhaloes
may have on the mass estimators: while in the previous studies we used
the full set of subhaloes, automatically including also the renegade ones, we
now want to restrict the analysis to the renegade subhaloes only in order to
estimate the mass of MW and M31.
For each host we computed the anisotropy parameter and radial distribution of their respective renegade satellites, and found βM 31 = 0.86 βM W = 0.72 and γM 31 = 2.15 ± 0.21 - γM W = 2.01 ± 0.20. The choice of the
host parameter α is made considering its value in the total [0, 1]Rvir range,
or using the relation α = γ − 2 that we provided in the previous sections.
The resulting estimated masses are shown in Table 5.6, in which we have
used the FIE estimator in order to compare the effects of these renegade
subhaloes in the same way for both hosts. This time, because of the small
number of objects considered, we do not perform multiple realizations of
the mass estimation, but only one: the errors associated with the mass are
thus computed through the error propagation formula based on Eq. (5.14)
- Eq. (5.19), in which we further assume that β is fixed, ∆γ/γ ∼ 10% as
obtained by the fitting routine and ∆α/α is listed in Table 5.2. We see that
in the case of using the value of α from the total radial range, the mass
estimator is biased for both hosts, with a large associated error. When
using the relation α = γ − 2, instead, the mass of both Milky Way and
Andromeda in recovered within a much smaller uncertainty. Is interesting
to note how the relation between the host parameter α and the subhaloes
distribution parameter γ seems to hold true also in this case, in which the
anisotropy parameter β is substantially far from being isotropic. However
the lack of statistic in this case, having at our disposal just one realization
of a small number of renegade objects, prevents us from generalizing the
finding of Section 5.4.2 to this highly anisotropic case. The fact that β ∼ 1
for the renegade subhaloes means that these objects are mainly moving on
radial orbits with respect to their hosts. We conclude that the computation
of the host mass based upon a family of renegade subhaloes gives results in
agreement with the expected ones and hence these mass estimators will not
be biased in case that renegade objects also exist in reality.
96
CHAPTER 5. SCALE-FREE MASS ESTIMATORS APPLIED TO THE
LOCAL GROUP
Table 5.6: Estimation of the MW and M31 mass based upon renegade subhaloes
only, FIE case. The parameter used are β = 0.72 and γ = 2.01 for the MW,
β = 0.86 and γ = 2.15 for M31. We remind that the value of α from the total
radial range is α = −0.034 for the MW and α = −0.052 for M31, as in Table 5.2.
α
[0, 1]Rvir
γ−2
MW
M31
(Mest ± ∆Mest )/Mtrue
0.92 ± 0.33 0.75 ± 0.40
1.00 ± 0.21 0.97 ± 0.16
Unbound subhaloes
For all previous results we did not test whether or not a subhalo is gravitationally bound to its host; we simply used a spatial criterion to determine
its affiliation as this is how satellites are often defined in the observations.
Now instead, we impose an additional constraint on our subhalo population:
its velocity has to be lower than the local escape velocity vesc of the halo
at that distance. Following this criterion, we find that about the 3% of the
subhaloes inside the virial radius of each host are unbound. As expected,
most of them lie near by the virial radius, where the vesc is lower and the
effects of the proximity of the other host are more important. We thus
quantify the effects that unbound subhaloes have on the mass estimators.
This is an interesting test, as it corresponds to the real case scenario in
which the affiliation of a tracer object is not clear and could be erroneously
included into the calculation of the mass of a host.
We repeat our previous methodology by evaluating the MW and M31
mass 1000 times with a subset of N = 30 subhaloes, this time including one,
two or three unbound subhaloes. In order to ensure an unbound subhalo
is included, we explicitly substitute in each realization, one, two or three
of the 30 subhaloes with an unbound one. We then computed the β and γ
coefficients for each realization, and used the formula α = γ − 2. We verify
that the inclusion of a single unbound subhalo leads to mass estimators
which are slightly biased towards larger masses: we obtained, for both M31
and MW, a Gaussian peaked at µ = 1.04 with σ = 0.14. When including
two unbound subhaloes, we found an higher deviation, with µ = 1.12 and
σ = 0.13. Finally, forcing three unbound subhaloes to be included in each 30
subhalo subsample, we obtain a Gaussian peaked at µ = 1.17 and σ = 0.14.
We performed the calculation using the FIE estimator but verify that our
results are the same in the RIE and LIE case, giving similar values for
the mean of the distribution µ, and increasing standard deviations σ with
97
5.5. SUMMARY & CONCLUSIONS
respect to the FIE case.
We note that the results presented in the previous sections are not significantly affected by the presence of unbound subhaloes, as in that case the
probability that in a given realization of N = 30 randomly picked subhaloes
one was unbound is P ≈ 37%2 , due to the fact that unbound subshaloes
make up just 3% of the full subhalo population. In this last test, instead, the
probability that one object is unbound, over the N = 30 subhaloes used in
each realization, is P = 100%, because we deliberately replaced one random
subhalo with an unbound one. Thus, we expect that the error on the mean
value of the Gaussian distributions in the previous analysis, caused by the
possible inclusion of one unbound object, is 100/37 ≈ 2.7 times lower than
the error made here, when one subhalo is forced to be unbound. Looking
at the µ = 1.04 obtained in this section, for the FIE case when we used a
single unbound subhalo, we see that the 4% of deviation from the expected
value will be reduced of a factor 2.7, giving negligible errors. We are further
reassured by having performed the analysis of Section 5.4.2 also by explicitly neglecting the unbound objects, and we have observed no significant
differences in the results already presented.
To conclude, in this section we demonstrate that, being sure of having
included unbound subhaloes, this inclusion causes an overestimate of the
host mass, in agreement with the results of Deason et al. (2011). The more
unbound objects we include into the mass estimator, the more biased the
final mass is. Care should thus be taken when considering objects at the
”edge” of a galaxy halo, as they may be not bound to it.
5.5
Summary & Conclusions
We verified the accuracy of the scale-free mass estimators recently proposed by Watkins et al. (2010,W10) when applied to the two dominant
Local Group host haloes, the MW and M31, by using Constrained Local
UniversE Simulations (CLUES). These scale-free mass estimators assume
that all the relevant informations about the enclosed mass of a halo are
contained in the properties of its satellites (or any other tracer population),
2
This probability can be computed using the hypergeometric distribution, which, in our case
and for the M31 and MW, respectively, describes the probability to get one unbound subhalo
within k = 30 randomly drawn objects from a total subhaloes population of size N = 1405(1205)
in which the unbound objects are n = 45(36), thus the ∼ 3% of the total.
!
!
!
n
N −n
N
P =
/
(5.23)
1
k−1
k
98
CHAPTER 5. SCALE-FREE MASS ESTIMATORS APPLIED TO THE
LOCAL GROUP
such as distances and velocities, which can both be given as either projected
or full 3D data. The importance of such estimators resides in the fact that
the full six-dimensional phase-space information of all celestial bodies down
to the very faint magnitude G ≈ 20 mag will soon be available thanks to the
upcoming GAIA mission. What makes the usage of these mass estimators
so appealing? After three years of operation the Sloan Digital Sky Survey II
(SDSS-II3 ) discovered eight new dwarf galaxies, seven of them orbiting our
Galaxy. The SDSS, which covered more than a quarter of the sky, essentially doubled the known number of MW satellite galaxies, helping close the
gap between the observed number of dwarf satellites and theoretical predictions. During its projected five-year mission, GAIA will scan the entire
41253 square degrees of the sky, obtaining astrometric parameters (angular
position, proper motion, and parallax) for roughly one billion stars. Recently, An et al. (2012) further investigated the benefits that the use of all
this new proper motion data will introduce in the application of mass estimators. It is thus imperative to develop and test against simulations the
mass estimator based entirely upon tracer objects, such as satellite galaxies.
This issue has already been partially addressed in Deason et al. (2011) and
Evans et al. (2011), using the GIMIC suite of simulations, from which they
selected a set of galaxies that resemble the Milky Way.
In this work we tested the scale-free mass estimators against Constrained
Simulation of the Local Group, in which observational data of the nearby
Universe is used as constraints on the initial conditions. These constrained
simulations provide us with a unique Local Group seated in the correct environment, as opposed to un-constrained cosmological simulations, to make a
direct comparison between numerical results and observations: verifying the
goodness of the W10 mass estimators in our simulated LG should therefore
been seen as complementary to the already published work on their credibility and as an extension to a system resembling as closely as possible the
real Local Group.
Our motivation is driven by the fact that the Local Group likely is
a rather special (binary) system of galaxies featuring backsplash galaxies
(Knebe et al. 2011c), renegade satellites (Knebe et al. 2011b) and preferential infall: Libeskind et al. (2011b) have studied the simulated MW and
M31 galaxies in the CLUES framework and have found a clear evidence for
the anisotropic infall of subhaloes onto their respective hosts. This result
has been recently corroborated by Keller et al. (2012), who examined the
spatial distribution of the MW young halo globular clusters finding that
they are anisotropically spatially distributed, sharing the same accreted
origin as that of the MW’s satellite galaxies. Our simulations also show
3
http://www.sdss.org/
99
5.5. SUMMARY & CONCLUSIONS
the typical anisotropy in the distribution of subhaloes population, compatible with the observed classical MW satellites (Kroupa et al. 2005; Metz
et al. 2007, 2008), and as already found in other cosmological simulations
(cf. Knebe et al. 2004; Libeskind et al. 2005; Zentner et al. 2005). Furthermore, when comparing constrained against un-constrained simulations
– only 1-3% of Local Group (candidates) share similar formation properties
(Forero-Romero et al. 2011). Thus, it is clear that our Local Group is a
very special object in the Universe.
We first studied the sensitivity of the mass estimators with respect to
their main parameters: α, which describes the host halo scale-free gravity
field, β, which corresponds to the satellites’ velocity anisotropy, and γ, representing the exponent of the power law describing the number density of the
tracer population. We found that for an external galaxy, such as M31, for
which only line-of-sight informations are available, the greatest error comes
from the uncertainty of α and γ, whereas the mass variations stemming from
the anisotropy parameter β are almost negligible in the interesting physical
range. On the other hand, the greatest concern in the estimation of the
mass of our Galaxy comes from the β parameter, as pointed out by W10:
without precise information about the satellites’ proper motions, the error
introduced by using their radial velocities is sensibly high. Hopefully, future surveys (e.g. the GAIA mission) would be able to measure such proper
motions, significantly improving the quality of these mass estimators.
We then applied the relevant mass estimators to the MW and M31 Local
Group system as found in our constrained simulation. We found that all
the estimators (FIE and RIE for the MW, FIE and LIE for M31) provide
an unbiased results, with the mean of the Mest /Mtrue√distribution close to
µ = 1.0 and its standard deviation scaling with 1/ Nsub , even when a
small (N ∼ 30) number of tracer objects are used, resembling the real case
scenario of the known satellites galaxies. When selecting the subhaloes in
order to follow a specific radial number distribution N (< r) ∝ r3−γ with
different γ, we found that, in the limit of the isotropic regime (i.e. β ∼ 0 and
as far as β = −0.5 in our simulations) the assumption that the subhaloes
are tracking the total mass of the host (i.e. α = γ − 2) is sufficient to get a
very good estimate of the host mass.
We thus also investigated how the mass estimators work when using
subhaloes that are closer or further away from the neighboring host, by
restricting the analysis to the facing and non-facing hemispheres and calculating the mass at different values for rout : we observe that the two dominant
hosts of the Local Group do not appear to influence its subhalo populations
– at least not when the applicability of the scale-free mass estimators is
concerned.
100
CHAPTER 5. SCALE-FREE MASS ESTIMATORS APPLIED TO THE
LOCAL GROUP
Finally, we explored the possibility that using renegade subhaloes, i.e.
subhaloes that change their affiliation from one of the two hosts to the other,
in the estimation of the mass may cause a bias: we do not find evidence
for this, on the contrary, we observe that the mass of both MW and M31
is recovered with a few percent of error when the assumption α = γ − 2 is
made, even if the anisotropy parameter in this case is β ∼ 0.7, indicating
that these objects are moving on radial orbits.
On the other hand, the inclusion of unbound objects, mainly found near
the virial radius of each host, is able to cause an overestimate of the host
mass, as high as the 20% when 3 unbound subhaloes are used out of a total
of 30 objects. In this regard, care should be taken when dealing with tracer
populations whose affiliation to each of the two host is not clear. As long
as boundness is verified however, the unique subhaloes population in our
simulations, showing anisotropy in their spatial distribution, preferential
infall (Libeskind et al. 2011b) and even renegade objects (Knebe et al.
2011b), does not prevent us from always recovering a good estimation of
the host mass.
Hence, the most important finding of this work is that satellite galaxies
are well suited to “weigh” the MW’s halo. Even with a small sample of just
two dozen objects and despite anisotropic accretion, an anisotropic spatial
distribution, different masses, sizes and histories, subhalo kinematics are
dominated by the host potential, making satellite galaxies well suited for
the problem at hand. We therefore conclude that the application of the
scale-free mass estimators to either of the two dominant hosts of the Local
Group provide credible results, it therefore appears safe to use it for the
Local Group as already done by W10. To get a good estimation of a host
mass, in the case of having the anisotropy parameter β ∼ 0, we recommend
the use of the parameter α = γ − 2 where the γ directly come from the
observation of a satellite population.
In the future, sensitive surveys and space based telescopic missions will
most likely improve both the census of satellite galaxies as well as our understanding of their proper motions: these new data will enhance the mass
estimators making them more accurate than they are today.
101
5.5. SUMMARY & CONCLUSIONS
102
Chapter 6
Warm dark matter Local
Group simulations
We explore the main differences in the formation of the Local Group by
analyzing cold (CDM) and warm (WDM) dark matter simulations within
the CLUES project. In the WDM case the initial power spectrum has been
changed to mimic a 1 keV dark matter particle.
We firstly focus on the “too big to fail” problem and show that the WDM
scenario naturally predicts less subhaloes than the CDM one. The fewer
number of substructures formed, however, is not enough to accommodate
all the visible subhaloes of the Milky Way; moreover, the brightest subhaloes
in the WDM SPH run are still too bright to be compatible with observed
dSphs.
Regarding the entire Local Group, two significant differences between
the CDM and WDM run are found. While in the CDM case a group of
galaxies that resembles the real LG forms, the WDM run fails to reproduce
a viable LG, instead forming a diffuse group which is still expanding at
z=0. This is surprising since, due to the suppression of small scale power
in its power spectrum, WDM is naively expected to only affect the collapse
of small haloes and not necessarily the dynamics on a scale of a group of
galaxies. Furthermore, the concentration of baryons at the center of the
haloes is greater in CDM than in WDM.
6.1
Introduction
Despite the many successes of CDM, we have seen that there are still
issues with the small scale structures formed within such a model. This
103
6.2. RESULTS
is what motivated scientists to investigate the formation of structures by
using a different type of dark matter, namely a warm dark matter particle.
Invoking a warmer flavor of DM, such as a 2 keV sterile neutrino, may
indeed solve a number of issues related to dwarf satellite galaxies, including
the “missing satellite problem” (Klypin et al. 1999a; Moore et al. 1999) as
well as the “massive failure problem” (Boylan-Kolchin et al. 2011, 2012).
In this Chapter we use again the CLUES simulations, run this time
with a power spectrum changed to mimic the suppression of power at small
scales caused by a 1 keV particle, as shown in Fig. 2.3. Within such WDM
model initial perturbations below a certain mass cannot collapse and the
smallest structures to form out of gravitational instability are fairly large.
The initial condition and details of the simulations have been presented
already in Section 2.1 and the SPH and star formation recipes are exactly
the same as in the CDM counterpart.
In the WDM simulation, discreteness effects which can cause haloes below a specific limit mass (Mlim ) to arise from the unphysical numerical
fragmentation of filaments, is an issue. In order to protect our analysis
against these artificially formed haloes we use the value of Mlim provided
by Wang & White (2007) as the minimum trusted mass for a halo in the
WDM simulation. Their expression, originally based upon Hot Dark Mat2
ter models, reads Mlim = 10.1ρ̄d/kpeak
, where ρ̄ is the mean density, d is
the mean interparticle separation, and kpeak is the wavenumber at which
∆2 (k) = k 3 P (k) reaches its maximum. In our WDM run, where the power
spectrum has been modified to correspond to a 1 keV particle, the values
of this limiting mass is Mlim ∼ 2.6 × 10⁷ M /h, which corresponds roughly
to a 100 particle limit. In practice when comparing CDM and WDM simulations, only objects whose mass is greater than 500 particles are used.
We note that since the simulations have identical baryonic physics, particle
mass and spatial resolutions any of the differences reported here are due
entirely to the nature of the DM model.
6.2
Results
The WDM simulation of the Local Group produce three dominant objects which we name galaxy A, B and C in decreasing mass. In the CDM
case these closely resemble the Milky Way (MW), Andromeda (M31) and
Triangulum (M33). An image of the two groups can be seen in Fig. 6.1.
Two salient aspects of WDM are immediately apparent from this figure:
(1) there are far fewer small substructures and (2) the two groups differ
substantially, cosmographically speaking.
104
CHAPTER 6. WARM DARK MATTER LOCAL GROUP SIMULATIONS
Figure 6.1: Dark matter distribution within a 2h−1 Mpc sphere containing the
three main haloes of the LG. CDM (left) and WDM(right). Credit: Libeskind et
al. (2013)
Regarding the first point, it is clear how the number of fewer small structures observed within the main haloes in the WDM run could, in principle,
solve the “massive satellite” problem. The warm, 1 keV particles are indeed able to suppress dramatically the number of such substructures within
Milky Way like haloes. We show in Fig. 6.2 the total number of substructures found within the halo A and the halo B (dubbed as MW and M31,
even if they do not accurately resemble some of the main features of the
observed galaxies, as we will discuss later) in the Vmax - Rmax space, for the
DM only run, as open diamonds, and SPH run, as filled circles.
We indicate as black circles those subhaloes whose magnitude is compatible with the observed dSPhs, while in light gray we show subhaloes with
are “too bright” when compared to the classical dwarfs. The dashed line
indicates the observational constraint coming from the assumption that the
dSphs live in NFW haloes, while the solid black line is the same constraint
but using an Einasto profile with variable shape parameter. We based such
constraint on the analysis of subhaloes density profile in CLUES, and found
that like the CDM case described in Section 4.3, such profiles can be accurately described by an Einasto model, which over performs the NFW
fit.
Amongst the two hosts considered in our simulations, we found only 5
satellites brighter than the classical dwarfs, only 3 of which lying outside
105
6.2. RESULTS
Figure 6.2: The “too big to fail” problem in warm dark matter simulations.
Open diamonds indicate the subhaloes found in the DM-only run, while the filled
circles indicate the SPH satellites, color-coded according to their magnitude. The
satellites of the two main hosts are shown here.
the observational range. While these numbers can easily be explained by
a statistical fluke, it is worrisome that the fewer number of substructures
formed, however, is not enough to accommodate all the visible subhaloes of
the Milky Way. Using a 2 keV particle would, possibly, solve the problem
(Lovell et al. 2012). This results have been, however, recently disfavored by
Schneider et al. (2014), who used the most stringent constraints on warm
dark matter particle mass coming from the Lyman-α forest which provides
mW DM > 3.3 keV at the 2σ level (Viel et al. 2005). With such a realistic
WDM particle mass the TBTF problem seem to be as severe as in the CDM
scenario.
We conclude that simply invoking a WDM scenario is not enough to
solve the TBTF problem.
We now move on in analyzing the evolution of some physical properties
of the three main haloes found in WDM simulations. In Figure 6.3(a,c) we
show the co-moving and physical distance between the three pairs of group
106
CHAPTER 6. WARM DARK MATTER LOCAL GROUP SIMULATIONS
members as a function of look back time, normalized to the z=0 value. In
the CDM simulation, the physical separation of each pair of galaxies reaches
a maximum “turn-around” (at a look back time of around 6 Gyrs for galaxy
B-A and galaxy B - C pair and around a few Gyrs later for galaxy A - C).
In the WDM simulation this is not the case: the physical distance between
each pair of haloes at every redshift is smaller than the corresponding distance at redshift zero, indicating that the Hubble expansion is the dominant
force at every epoch and that all three pairs of galaxies have yet to begin
approaching each other. Accordingly, the group is more compact in CDM
than in WDM. Using these specific initial conditions, over densities that
turn around and are on a collision course at a given epoch in cosmic time in
CDM, have yet to approach each other in WDM: where CDM produces an
attracting, collapsing group of galaxies, WDM produces a still expanding
version. Using initial conditions, whose only difference is a suppression of
small scale power, the defining dynamics of a group of galaxies is completely
different in CDM and WDM, with the former predicting an attracting group
that resembles the LG, while the latter predicting a still expanding one.
The co-moving distances (shown as the thick lines in Fig. 6.3a,c) show
monotonic attractions. In the WDM case the simulated haloes are closer to
each other (relative to their z=0 distances) at early times than the CDM
haloes. In the CDM case, by z=0 the haloes have been brought closer. Note
that the small kinks in the A -C system (CDM) and B - C system (WDM
case) appear due to false identification of the main progenitor in the merger
tree construction at a given snapshot.
We now examine the evolution of the three individual group members
by examining the mass accretion history shown in Fig. 6.3(b,d). In both
the CDM and WDM run, the two most massive galactic haloes (A and B)
show jumps in the mass accretion history characteristic of merger activity
occurring more or less continuously. Often, these haloes appear to lose mass
after a violent major merger. This is because of the unique merger history
of these objects - violent mergers may bring material into the virial radius
that is bound at one redshift, but which may become unbound and flung
out at a later time. The smallest halo (C) on the other hand shows little
evidence of major mergers in its past.
Although the mass growth histories look similar, in fact they differ
slightly. The time at which half of the z=0 mass has been assembled is
shown in each plot as a filled circle. In the WDM simulation, each halo assembles 50% of its mass later with respect to the CDM model. Specifically,
in the WDM run halo A, B and C accrete half-mass at a look-back time of
∼ 4, ∼ 6, and ∼ 9.5Gyrs, respectively. In the CDM case this occurs at ∼ 7,
∼ 7 and ∼ 10Gyrs: that is ∼ 3, ∼ 1, ∼ 0.5 Gyrs earlier. Since B and C
107
6.2. RESULTS
Figure 6.3: Upper Panels: CDM; Lower Panels: WDM. Left Panels (a,c): The
physical (thin line) and co-moving (thick line) distance as a function of look back
time between the three pairs of LG haloes. We show the distances between the A
and B in blue, the B and C in red and A and C in green. Each curve is normalized
to its z=0 value which can be found in Table 1. Right Panels (b,d): The mass
growth for halo A (red), B (blue), and C (green) as a function of look-back time.
The solid dots denote the time at which half the z=0 mass was assembled. Credit:
Libeskind et al. (2013).
108
CHAPTER 6. WARM DARK MATTER LOCAL GROUP SIMULATIONS
are smaller mass haloes, their half mass times are considerably earlier and
the delay is considerably smaller than for halo A. A characteristic feature
of the WDM model emerges here: the finite primordial phase-space density due to the large thermal velocities of the particles causes most of the
mass to undergo gravitational collapse at later redshift (z < 5), resulting
in the suppression of halo formation at higher redshift (Bode et al. 2001).
Halo collapse is thus delayed with respect to the CDM model. Although
not a new result, this finding directly informs the main differences we find
between CDM and WDM.
How do the different cosmographies and histories change the internal
structure of each of our three LG objects? In Fig. 6.4(a)-(c) we show the
density profile of the three LG members in both WDM (dashed) and CDM
(solid) simulations. All density profiles are standard NFW fits, and in all
three cases the WDM is nearly indistinguishable from the CDM. That said,
owing to the lower mass of the WDM haloes, their density profiles are
systematically shifted to slightly lower densities.
In Fig 6.4(d)-(f) we show the cumulative baryon fraction as a function of
radius. Again, WDM and CDM show broad similarities in shape and value
of the baryon fraction. In the inner parts, WDM shows a systematically
lower baryon fraction. At around ∼ 0.03rvir , the total fraction of internal
mass in baryons is roughly the same in both cosmologies. Towards the outer
parts of the halo, the baryon fraction of both cosmologies drops, reaching
the cosmic mean of ∼ 0.1 at the virial radius. That CDM haloes have more
concentrated baryons is likely due to a number of combining factors: their
earlier formation time, their greater mass and thus their deeper potential.
We conclude that WDM haloes have lower baryon fractions in their inner
parts where baryons dominate, than CDM haloes.
The baryonic properties of the three Local Group members are summarized in Table 2. The fraction of mass in a gaseous component is presented
in Fig. 6.4(g)-(i). Although each halo shows different specific behavior, some
interesting similarities exist. Firstly, the fraction of mass in gas is almost
always greater in WDM than in CDM. This is true for all radii in halo A,
and for radii greater than 0.03rvir for halo B and C (although in halo B,
there is more gas in CDM for r < 0.2rvir ). The higher gas fractions in
WDM may inhibit infalling substructures from depositing their material in
the center of the halo thereby suppressing the baryon fraction in the inner
parts of WDM haloes, as seen in Fig. 6.4(d)-(f).
Finally, we close this section with an image of the gas distribution in the
Local Group within such WDM scenario, in Fig. 6.5. The size of the plot
is about 2h−1 Mpc across, viewed from a distance of 3.3h−1 Mpc. On the
three right panels we show the gas disks of the three main galaxies as seen
109
6.2. RESULTS
Figure 6.4: Internal properties of the three main haloes simulated as function
of radius. Properties for halo A (red, left panel), B, (blue, center panel) and C
(cyan, right panel) are shown for WDM (dashed) and CDM (solid). Top row:
Density profile. Middle row: Baryon fraction. Bottom row: Gas fraction. Credit:
Libeskind et al. (2013)
110
CHAPTER 6. WARM DARK MATTER LOCAL GROUP SIMULATIONS
Halo
A
B
C
Property
Nvir
Mvir
fb,vir
Nvir
Mvir
fb,vir
Nvir
Mvir
fb,vir
TOTAL
4.2
5.5
0.12
2.9
4.0
0.08
1.5
2.0
0.11
CDM
GAS
1.3
0.52
STARS
0.65
0.14
0.53
0.21
0.55
0.12
0.40
0.17
0.29
0.064
TOTAL
2.9
4.2
0.09
2.2
3.0
0.09
1.3
1.8
0.11
WDM
GAS
0.66
0.27
STARS
0.43
0.094
0.56
0.23
0.30
0.066
0.36
0.15
0.19
0.040
Table 6.1: Properties of the three main galaxies in the CDM and WDM simulation. For each halo we show the number Nvir , in units of 106 , and mass Mvir , in
units of 1011 h−1 M , of stars, gas and all particles within the virial radius. We
present the baryon fraction within the virial radius (fb,vir ).
from a distance of 250h−1 kpc, the size of the plot is about 50h−1 kpc.
6.3
Summary and Discussion
Since the temperature of the DM particle at decoupling determines its
ability to “free-stream” out of potential wells, it also sets the scale at which
structures are able collapse. In principle this characteristic can be used
to constrain DM to be either “cold”, “warm”, or “hot”. Hot DM, such
as neutrinos which travel at relativistic speeds, were at first hailed as the
solution to the DM problem but have now been effectively ruled out since
they can escape most potential wells and prevent structures from formation
via gravitational instability. Cold DM (CDM), on the other hand, moves
non-relativistically and as such is able to collapse into smaller objects. The
prediction of small substructures embedded in larger objects is a generic
feature of the CDM model and, since such objects are unobserved in the
Milky Way, this has lead to the famed “missing satellite problem” (Klypin et
al. 1999a; Moore et al. 1999), often dubbed a crisis for CDM. Astrophysical
process (such as photo-evaporation of star forming gas due to UV radiation,
see Benson et al. 2003) are invoked to inhibit the gas cooling into small subhaloes. These process do not erase substructures, they simply ensure that
they remain non-luminous. A large population of dark subhaloes detectable
via gamma ray emission from DM annihilation (Stoehr et al. 2003) or via
strong gravitational lensing of background sources (Xu et al. 2009), is thus
111
6.3. SUMMARY AND DISCUSSION
Figure 6.5:
The gas distribution within the LG in a WDM scenario (for CDM see Fig. 2.2).
Credit A. Khalatyan, using PMViewer
http://pmviewer.sourceforge.net.
112
CHAPTER 6. WARM DARK MATTER LOCAL GROUP SIMULATIONS
predicted albeit unobserved, in the Milky Way halo.
As a result of the apparent failures of CDM in over producing and HDM
in underproducing the number of dwarf satellites around the Milky Way,
warm DM (WDM), has recently been suggested and studied (by e.g. Bode
et al. 2001; Knebe et al. 2002, 2008; Macciò & Fontanot 2010; Lovell et al.
2012; Schneider et al. 2014, among others). In this work, we have used a set
of initial conditions that constrain scales unaffected by the nature of the DM
to test the effect of the type of DM on a group of galaxies (i.e. ∼ 1Mpc).
Within the scales that are still linear at z=0 (the “local environment”) a
group of galaxies that in CDM resembles the local group is resimulated
at high resolution, with gas dynamics. In the CDM run, this local group
includes three galaxies that have the same mass, geometry and kinematics
as the MW, M31 and M33. Thus our simulation allows us to study in detail
the merger history and internal structure of these galaxies as well as their
baryonic properties. Since the local environment has been kept identical,
we can directly measure the effect the type of DM has on our CDM LG.
The main difference between our CDM and WDM simulations is that
structure formation is delayed in WDM. This is a direct result of the suppression of small scale power which, owing to the lack of mergers below the
filtering mass, means that it takes longer for haloes to grow to a given mass.
The greatest effect this has is to inhibit the collapse of a group of galaxies in
WDM. All our results regarding the differences in the galaxies themselves,
follow directly from this main difference.
• The number of luminous substructures formed within such a WDM
scenario is not enough to reconcile simulations and observations of
dSphs: there are too few subhaloes within the luminosity range of the
observed classical dwarfs.
• A group of galaxies which at z=0 closely resembles the LG in CDM,
is dynamically very different in WDM. Whereas in CDM the group is
collapsing and is compact, in WDM it is still expanding and is much
more diffuse.
• Delayed halo collapse, implies that at z=0 WDM haloes are smaller
than their CDM counterparts.
• Baryons are more centrally concentrated in CDM versus WDM haloes.
Our conclusions are all consequences of the delayed formation and collapse of haloes in WDM cosmologies with respect to CDM. This simple
113
6.3. SUMMARY AND DISCUSSION
attribute, a direct result of the lack of small scale power due to free streaming of DM at early times, informs a myriad of physical properties, from star
formation rates to bulge/disc ratios to colors.
For a more comprehensive study of the differences between a CDM and a
WDM simulated Local Group we refer the reader to Libeskind et al. (2013).
114
Chapter 7
Abundance Matching in the
Local Group
The way in which dark matter halo masses are assigned to each specific dSph within the Local Group is by mean of dynamical measurements:
knowing the stellar velocity dispersion of such galaxies at a specific radius,
such as the half-light radius r1/2 , and assuming that the dSphs are amongst
the most dark matter dominated objects in the Universe, one can immediately derive the dark matter mass within such r1/2 after a density profile
has been chosen.
We showed already in the previous Chapters that with this procedure the
brightest satellite galaxies of the Milky Way would be apparently housed by
subhaloes which are smaller than expected within a galaxy formation model,
the TBTF problem (Boylan-Kolchin et al. 2011). The key in solving the
“massive subhaloes” problem is thus to understand what is the actual halo
mass of subhaloes within which the observed satellite galaxies are embedded.
Using the abundance matching technique (e.g. Moster et al. 2010; Guo
et al. 2010), it is possible to constrain the relationship between stellar mass
and halo mass of galaxies. The idea is to match the cumulative number
of observed galaxies with the cumulative number of dark matter haloes,
the latter being derived either from theory or from cosmological N-body
simulations.
In this Chapter, we use the CLUES simulations to show that a single
power law halo mass distribution is appropriate for direct matching to the
stellar masses of observed Local Group dwarf galaxies, allowing the determination of the slope of the stellar mass-halo mass relation for low mass
galaxies. In other words, we extended the halo-galaxies abundance matching down to the completeness limit of the Local Group galaxies. Errors in
115
7.1. INTRODUCTION
halo masses are well defined as the Poisson noise of simulated local group
realizations, which we determine using local volume simulations. For the
stellar mass range 107 M <M∗ <108 M , for which we likely have a complete
census of observed galaxies, we find that the stellar mass-halo mass relation
follows a power law with slope of 3.1, significantly steeper than most values
in the literature. This steep relation between stellar and halo masses would
indicate that Local Group dwarf galaxies are hosted by dark matter haloes
with a small range of mass. Our methodology is robust down to the stellar
mass to which the census of observed Local Group galaxies is complete, but
the significant uncertainty in the currently measured slope of the stellar-to
halo mass relation will decrease dramatically if the Local Group completeness limit was 106.5 M or below, highlighting the importance of pushing
such limit to lower masses and larger volumes.
7.1
Introduction
By comparing stellar masses of galaxies from large scale surveys with
masses of haloes in cosmological dark matter simulations, one can use
abundance matching techniques to derive the stellar-to-halo mass relation,
M∗ −Mhalo (e.g. Moster et al. 2010; Guo et al. 2010). More direct measurements of M∗ −Mhalo can also be made by measuring halo masses using,
for example, galaxy-galaxy lensing (e.g. Hoekstra et al. 2004; Hudson et
al. 2013) or satellite dynamics (e.g. Prada et al. 2003; More et al. 2011),
with the various methods giving reasonable agreement (e.g. Leauthaud et
al. 2012).
However, the range of masses that can be probed by abundance matching is limited by the luminosity down to which galaxy surveys are complete,
and by variations in the halo mass functions of simulations. Large scale
galaxy surveys, e.g. SDSS and GAMMA, have provided complete stellar
mass functions (Baldry et al. 2008, 2012) down to ∼ 108 M within volumes
that are large enough such that the mass function within collisionless cosmological simulations have variations which are insignificant.
<
The details at the low mass end, M∗ ∼
109 M , become less clear, as does
the question as to how to extend the relation to even lower mass galaxies.
For example, the stellar mass function from Baldry et al. (2008) has an upturn at the low mass end, which translates to an upturn in the M∗ −Mhalo
relation (Behroozi et al. 2013). This implies a slope of the M∗ −Mhalo relation of α=1.6 at the low mass end, where M∗ ∝Mhalo α . Extrapolating this
relation to lower masses would imply that low stellar mass galaxies would
reside in significantly lower mass dark matter haloes than predicted by extrapolating the earlier models of Moster et al. (2010) and Guo et al. (2010),
116
CHAPTER 7. ABUNDANCE MATCHING IN THE LOCAL GROUP
which found steeper slopes (higher values of α) for the M∗ −Mhalo relation.
However, Garrison-Kimmel et al. (2014) point out that extrapolating
a slope of α=1.6 would significantly over-estimate the number of Local
>
Group galaxies with M∗ ∼
5×10⁶ M . Using updated observational data
from Baldry et al. (2012), which shows less upturn in the stellar mass function and hence a steeper M∗ −Mhalo relation, Garrison-Kimmel et al. (2014)
find a slope α=1.92 at the low mass end.
Regardless of these differences, there is no a piori reason to believe that
the relation between stellar mass and halo mass should be extrapolated to
low mass galaxies, M∗ <108 M . Further, the relation derived from large
volume galaxy surveys may not be directly applicable to the particular
environment of the Local Group.
In this study, we use constrained simulations of the local universe (CLUES)
to show that the mass function of a volume analogous to the Local Group
follows a single power law. This allows us to match the masses of dark
matter haloes taken from the underlying power law mass function directly
to the stellar masses of observed Local Group galaxies. We thus provide
the first robust measurement of the relation between the stellar mass of Local Group galaxies and the masses of the haloes in which they are hosted,
assuming a ΛCDM cosmology.
7.2
Local Group Simulations
We use here the same set of CLUES simulations already extensively
described in the previous Chapters. Our fiducial dark matter only run has
WMAP5 cosmology (Dunkley et al. 2009), and its two most massive haloes,
taken as analogues of the MW and M31, have virial masses of MMW =1.7 ×
1012 M and MM31 =2.2×10¹² M and are separated by a distance of 849 kpc.
To calculate rms errors between simulated halo masses and the underlying power law mass function, we also use a CLUES local group run with
WMAP3 cosmology, and 10 simulated local group volumes from the Exploring the Local Group Volume In Simulation Suite (ELVIS, Garrison-Kimmel
et al. 2014).
The AHF halo finder1 (Gill et al. 2004b; Knollmann & Knebe 2009) has
been used to identify all (sub-)haloes in our simulation. Virial mass is
defined as the mass within a sphere containing ∆vir ' 350 times the cosmic
mean matter density. We measure halo masses at their maximum mass,
prior to being stripped.
1
http://popia.ft.uam.es/AHF
117
7.2. LOCAL GROUP SIMULATIONS
Figure 7.1: The mass function of CLUES haloes, including subhaloes, within the
defined local group region (LGV, black line). The red dots follow the best fit to
the halo mass function, with masses assigned to each N= 0.5, 1.5, 2.5 etc. by
inverting the mass function to give Mhalo ∝ N(>Mhalo )−1/0.89 . Credit: Brook et
al. (2014).
118
CHAPTER 7. ABUNDANCE MATCHING IN THE LOCAL GROUP
7.3
Results
In what follows, the slope of the dark matter halo mass function, αdm ,
is defined via a power law fit to the mass function, N(>Mhalo ) ∝Mhalo αdm .
The slope, α, of the M∗ −Mhalo is defined by assuming a power law fit
M∗ ∝Mhalo α . The local group volume (LGV) is defined as a sphere of radius
1.8 Mpc centred on the MW analogue halo.
Figure 7.1 shows (black line) the halo mass function of the fiducial
CLUES local group simulation within the LGV. Subhaloes, using their maximum mass values prior to stripping, are included within the total halo
population. The LGV mass function follows a single power law with slope
αdm =−0.89, the same slope as the cosmological box from which the LGV is
drawn, and essentially the same slope as other cosmological mass functions
in the literature (e.g. Jenkins et al. 2001).
The LGV of the CLUES simulation run with WMAP3 cosmology also
has a mass function slope of αdm =−0.89, the same as the slope in the cosmological volume from which it is drawn. Further, the 10 LGVs surrounding
paired MW/M31 analogue haloes from Garrison-Kimmel et al. (2014), follow a slope αdm =−0.9. These results provide strong evidence that the mass
function of Local Group dwarf galaxies is a single power law.
The red dots in Figure 7.1 are halo masses of a defined local group
distribution which follows the mass function power law: masses are assigned
to each N= 0.5, 1.5, 2.5 etc., according to the inverted mass function,
Mhalo
= N0 × N (> Mhalo )−1.12
1010 M
(7.1)
where N0 =47.9 for our fiducial model, and N0 =38.1 for the mean of the 12
simulated LGVs.
This distribution of masses is appropriate for direct application to the
observed Local Group, with the virial masses of each halo subject only to
Poisson noise around the power law halo mass function.
We next match this power law halo mass distribution to observed stellar
masses of Local Group galaxies, assuming a one-to-one correspondence in
order of mass, as shown in Figure 7.2. Our predicted Local Group abundance matching is shown as points with error bars, while stellar-to-halo
mass relations from previous studies are shown as lines. Observed Local
Group galaxy luminosities are taken from McConnachie (2012), with stellar
mass to light (M∗ /L) taken from Woo et al. (2008). Updated distance measurements have resulted in slight changes to the Woo et al. (2008) stellar
masses (see Kirby et al. 2013,for a table of updated stellar masses for most
119
7.3. RESULTS
Figure 7.2: The stellar mass of observed Local Group galaxies within 1.8 Mpc
of the Milky Way, assigned to halo masses from the power law fit to the halo
mass function (red dots in Figure 7.1). Stellar mass errors are 0.17dex (Woo
et al. 2008). Halo mass errors are the rms deviations of simulated LGV halo
masses from the power law fit to the halo mass function. Also shown are the
stellar-halo mass relations of Behroozi et al. 2013 (solid line), Garrison-Kimmel
et al. 2013 (long-dashed line), Moster et al. 2010 (triple-dot-dashed line), Guo
et al, 2010 (dot-dashed line), and the luminosity-mass relation from Kravtsov
2010 (dashed line). Scatter in the halo mass-stellar mass would only change the
matching order: shifting high stellar mass galaxies into low mass haloes must be
accompanied by low stellar mass galaxies being hosted by high mass haloes. The
slope will not be flattened. Credit: Brook et al. (2014).
120
CHAPTER 7. ABUNDANCE MATCHING IN THE LOCAL GROUP
galaxies). We assume M∗ /L=1.6 for galaxies not listed in either Woo et
al. (2008) or Kirby et al. (2013). There are 41 galaxies in our sample with
M∗ >106 M and within 1.8 Mpc of the Milky Way.
Error bars for stellar masses in Figure 7.2 are 0.17 dex, the quoted typical
error in Woo et al. (2008). Error bars for Mhalo in Figure 7.2 are rms errors
of each simulated halo mass from the corresponding (by ordered number)
power law halo mass, Mhalo ∝N−1/α , using our full suite of 12 simulated
LGVs. These errors in halo mass are dominated by Poisson noise, with
other sources of error coming from the different cosmologies and any sample
variance being insignificant. The errors on the halo masses are reasonably
small in the relevant region for this study, where N(>Mhalo )>10. This region
>
is relavent because there are 10 Local Group galaxies with M∗ ∼
108 M . so
the single power law in this region can be used to match galaxies with
<
M∗ ∼
108 M .
Analyzing Figure 7.2 we found that the M∗ −Mhalo relation for the Local
Group galaxies is well fit by α=3.1 in the region 107 <M∗ /M ≤108 . The
catalogue of Local Group galaxies within 1.8 Mpc of the MW is likely complete down to M∗ =107 M and possibly down to M∗ =5×10⁶ M (Koposov et
al. 2008; Tollerud et al. 2008). If we do increase the assumed completeness
range to 5×10⁶ <M∗ /M ≤108 we obtain a slope of α=3.5.
In this context, we note the recent discovery of satellites in the vicinity of
M31 that have stellar masses of several times 106 M (Martin et al. 2013b,a),
demonstrating that we are certainly not complete down to M∗ ∼106 M in
the Local Group. Even using the M∗ =107 M limit, our derived slope of the
M∗ −Mhalo relation, α=3.1, is nevertheless significantly steeper than most
values in the literature (see the Introduction and Figure 7.2).
The normalization of the mass function coming from the total mass
of the Local Group will not affect such derived value of α; instead, the
effect will be to shift all points in Figure 7.2 left or right. In the region
107 <M∗ /M ≤108 , the M∗ −Mhalo relation is fit by
M∗ =
Mhalo
M0 × 106
3.1
(7.2)
where M0 =79.6 in our fiducial run. M0 =63.1 when using the mean power
law mass function for the 12 LGVs. Similarly, systematic errors in observed
stellar mass determinations, such as assuming a different initial mass function, will shift all points up or down.
In Figure 7.3, we plot the stellar mass function of observed Local Group
galaxies, shown as the black line. Fixing the halo mass function slope at
αdm =−0.89, we examine the resultant stellar mass functions for various
121
7.3. RESULTS
Figure 7.3: The stellar mass function of observed Local Group galaxies within
1.8 Mpc of the Milky Way (black line). Coloured lines are stellar mass functions
that assume a halo mass function of slope αdm =−0.89 along with various assumed
slopes for a power law M∗ −Mhalo relation, α=2, 2.5, 3, 3.5 plotted as dashed,
dot-dashed, triple-dot-dashed and long-dashed lines respectively. Normalization
ensures 10 galaxies with M∗ >108 M in each case: we are interested in the shapes
of the curves. Credit: Brook et al. (2014).
122
CHAPTER 7. ABUNDANCE MATCHING IN THE LOCAL GROUP
assumed values of the slope of the M∗ −Mhalo relation, α. Stellar mass functions that result from assuming α=2, 2.5, 3, 3.5 are plotted as dashed, dotdashed, triple-dot-dashed and long-dashed lines respectively in Figure 7.3.
Normalisation ensures 10 galaxies with M∗ >108 M , i.e. the observed number, in each case.
The stellar mass functions for low values of α diverge from the observed
function as we go to low stellar masses. Down to a completeness limit of
M∗ ∼107 M , values of α are hard to distinguish, with just a few galaxies separating α=2 from α=3.5. However, assuming that the completeness limit for
>
Local Group is closer to 5×10⁶ M , a slope of α ∼
3 is clearly favoured. As
the catalogue of observed Local Group galaxies becomes complete to lower
stellar masses, the stellar mass-halo mass relation will become increasingly
well defined.
In Figure 7.3, no assumption of a one-to-one correspondence between
halo mass and stellar mass is made, as it is in Figure 7.2. The slope of the
stellar mass function, α∗ is simply derived from the relation, 1+α∗ =(1 +
αdm )/α. Any scatter around the M∗ −Mhalo relation, which may be large
for low mass galaxies (e.g. Behroozi et al. 2013), will not affect our result
>
for the preferred slope, α ∼
3.
7.4
Conclusions
We have extended the abundance matching relation between halo mass
and stellar mass of galaxies down to the current Local Group observational
completeness limit.
Supported by evidence from constrained local group simulations, we argue that a power law mass function for haloes is appropriate to be directly
applied to Local Group galaxies. Poisson noise of simulated realizations provide well defined errors in halo masses. By matching such power law mass
function to stellar masses of observed Local Group galaxies, we determine
a slope of the M∗ −Mhalo relation of α=3.1 for galaxies with stellar mass
<
108 M . This determination of the relation for Local Group galaxies
M∗ ∼
down to M∗ =107 M is significantly steeper than most values in the literature, which have generally been extrapolations of the abundance matching
relation from higher masses.
Our value of α is consistent with the extrapolation of the Guo et al.
(2010) relation to small stellar masses, yet the upturn in the relation at
masses above M∗ =108 M (Behroozi et al. 2013; Garrison-Kimmel et al.
2014) indicates that the extended relation is likely to be more complex than
a single power law for masses M∗ <109 M .
123
7.5. DISCUSSION
The key insight of our paper comes from the fact that the halo mass function of the local group analog simulation in a volume with radius 1.8 Mpc
follows a single power law slope to large enough masses to host all the local
<
group galaxies with M∗ ∼
108 M . Because the census of observed Local
Group galaxies is well known down to M ∼107 M (or a little lower) within
such a volume, we can match Local Group dwarf galaxies to dark matter
haloes drawn from a population that follows a power law in a region where
Poisson noise, which determines the uncertainties in the halo masses, is low.
On the other hand, smaller volumes, such as sub-halo mass functions
of Milky Way analogue haloes, are not constrained in this manner. On
average, such populations will also follow a single power law (e.g. BoylanKolchin et al. 2010), but their individual mass functions are dominated by
Poisson noise. Therefore the Local Group is unique, with a volume that
is large enough to have a single, well defined power law mass function, yet
small enough to find faint galaxies.
Scatter in the M∗ −Mhalo relation appears evident in the Local Group.
For example, Fornax is 100 times more luminous than Draco, but seems to
have a smaller halo mass (Peñarrubia et al. 2008). However, such scatter will
not flatten the slope of the stellar-to-halo mass relation that we derived, as is
evident in Figure 7.3 where only slopes are considered, with no assumption
made regarding how stellar masses and halo masses are matched. Nevertheless, scatter in the M∗ −Mhalo relation will result in some relatively high
stellar mass galaxies being hosted by relatively low mass haloes, but this is
only achieved in conjunction with relatively low stellar mass galaxies being
hosted by high mass haloes.
As we show in Figure 7.3, surveys of Local Group galaxies that extend
the the completeness limit to lower luminosities, such as SKYMAPPER (Keller
et al. 2007) and LSST (LSST Science Collaboration et al. 2009) will provide
increasingly strong constraints on the M∗ −Mhalo relation, and particularly
on the slope of such relation at small masses, simply by matching observed
data to a power law mass function for dark matter haloes.
7.5
Discussion
Finally, and most importantly, we have shown that the vast majority of
the galaxies in the Local Group, regardless of whether they are satellites or
isolated, are predicted to be housed in haloes whose mass exceeds 1010 M ,
in evident contrast with dynamical measurements of dSphs, which would
assign most of these galaxies to a halo of smaller mass. Such assignment
assumes that the dark matter halo follows the density profile derived from
124
CHAPTER 7. ABUNDANCE MATCHING IN THE LOCAL GROUP
N-body simulations, the commonly used NFW model.
They way out of this discrepancy may reside in baryonic processes that
are neglected when using collisionless simulations to make predictions about
observed dwarf galaxies. If we can identify a process that is able to cause
an expansion of the dark matter halo of satellite galaxies, then we will
solve at the same time the “massive subhaloes” problem and the abundance
matching vs. dynamical measurements discrepancy.
Indeed, some satellites will be hosted in big (∼ 1010 M ), expanded
haloes, thus in agreement with the prediction of our LG abundance matching. Such haloes will also be in agreement with dynamical measurements
of dSphs, as their velocity dispersion can be well fitted by a ∼ 1010 M
cored halo (or by a smaller ∼ 109 M , cuspy NFW halo, scenario that we
have seen to cause many tensions within a galaxy formation model). The
TBTF problem will then be solved since such cored haloes would be much
less concentrated toward the center, and they would be big enough not to
leave any “massive failure”: in other words, all the biggest haloes will now
be populated with galaxies, with an expanded inner dark matter profile in
agreement with observations of stellar velocity dispersions.
Of course, one naively expects that whatever is the baryonic mechanism
that causes expansion in dark matter haloes, it would be connected to the
amount of stellar, baryonic mass available in each galaxy, ultimately leading
to different profiles according to the different amount of energy that each
galaxy has. We do not expect, therefore, all the satellite galaxies in the
LG to live within an expanded halo: there must be some case in which the
“baryonic energy” is simply not enough to create a cored profile, and such
galaxies will retain a cuspy, NFW halo.
The evidence for a mixed population of cored and cuspy satellite galaxies
within the Local Group is strongly supported by observations (Walker &
Peñarrubia 2011; Wolf & Bullock 2012).
Exploring what are the main mechanisms able to cause an expanded
dark matter haloes in galaxies will be the focus of the next Chapters of this
thesis, by using hydrodynamical simulations of galaxies from the MaGICC
project.
A detailed study of the connection between satellite galaxies’ kinematics,
abundance matching in the Local Group and the core/cusp discrepancy in
galaxies is an ongoing project.
125
7.5. DISCUSSION
126
Chapter 8
Cusp and cores in galaxies: the
dependence of dark matter
profiles on the stellar-to-halo
mass ratio
We have seen in the previous Chapters the importance of studying the
impact of baryonic physics on galaxy formation, particularly regarding the
core/cusp discrepancy.
To explore this issue, we use a suite of 31 simulated galaxies drawn
from the MaGICC project to investigate the effects of baryonic feedback on
the density profiles of dark matter haloes. The sample covers a wide mass
range: 9.4 × 10⁹ < Mhalo /M < 7.8 × 10¹¹ , hosting galaxies with stellar
masses: 5.0 × 10⁵ < M? /M < 8.3 × 10¹⁰ , i.e. from dwarf to L? . The
galaxies are simulated with blastwave supernova feedback and, for some
of them, an additional source of energy from massive stars is included.
Within this feedback scheme we vary several parameters, such as the initial
mass function, the density threshold for star formation and energy from
supernovae and massive stars.
The main result is a clear dependence of the inner slope of the dark matter density profile, α in ρ ∝ rα , on the ratio between stellar-to-halo mass,
M? /Mhalo . This relation is independent of the particular choice of parameters within our stellar feedback scheme, allowing a prediction for cusp vs
<
core formation. When M? /Mhalo is low, ∼
0.01 per cent, energy from stellar
feedback is insufficient to significantly alter the inner dark matter density
and the galaxy retains a cuspy profile. At higher ratios of stellar-to-halo
mass feedback drives the expansion of the dark matter and generates cored
127
8.1. INTRODUCTION
profiles. The flattest profiles form where M? /Mhalo ∼ 0.5 per cent. Above
this ratio, stars formed in the central regions deepen the gravitational potential enough to oppose the supernova-driven expansion process, resulting
in cuspier profiles. Combining the dependence of α on M? /Mhalo with the
empirical abundance matching relation between M? and Mhalo provides a
prediction for how α varies as a function of stellar mass. Further, using
the Tully-Fisher relation allows a prediction for the dependence of the dark
matter inner slope on the observed rotation velocity of galaxies. The most
cored galaxies are expected to have Vrot ∼ 50 km s−1 , with α decreasing
for more massive disc galaxies: spirals with Vrot ∼ 150 km s−1 have central
slopes α 6 −0.8, approaching again the NFW profile. This novel prediction
for the dependence of α on disc galaxy mass can be tested using observational data sets and can be applied to theoretical modeling of mass profiles
and populations of disc galaxies.
8.1
Introduction
The Λ Cold Dark Matter (ΛCDM) cosmological model has been shown
to agree with observations of structures on large scales (e.g. Riess et al.
1998; Komatsu et al. 2011; Hinshaw et al. 2013; Planck Collaboration et
al. 2013). According to this theory, galaxies are embedded within dark
matter (DM) haloes (White & Rees 1978; Blumenthal et al. 1984), whose
properties have been extensively studied in the past thanks to numerical
N-body simulations (e.g. Springel 2005; Power & Knebe 2006; Maccio’ et
al. 2008; Kuhlen et al. 2012). Problems at small scales, however, still affect
the ΛCDM model, one of which is the so-called “cusp-core” problem. A
prediction of pure DM collisionless simulations is that dark matter density
increases as ρ ∝ r−1 toward the halo center (Navarro et al. 1996b; Springel
et al. 2008; Navarro et al. 2010). The existence of such a “cuspy” density
profile is in disagreement with observations of disc and dwarf galaxies (e.g.,
Salucci & Burkert 2000; Simon et al. 2005; de Blok et al. 2008; Kuzio de
Naray et al. 2008b, 2009; Oh et al. 2011b), where detailed mass modeling
using rotation curves suggests a flatter, or “cored”, DM density profile.
Simulated DM haloes modeled with an Einasto (Einasto 1965) profile have
a inner slope of −0.7 (Graham et al. 2006a): this value is closer to what
observed in real galaxies (Swaters et al. 2003), yet not sufficient to solve the
discrepancy (de Blok et al. 2003).
One possibility, without resorting to more exotic forms of dark matter
(e.g. warm dark matter see Avila-Reese et al. 2001; Bode et al. 2001; Knebe
et al. 2002,Macciò et al. 2012b), is that this inconsistency arises from having neglected the effects of baryons, which are irrelevant on cosmological
128
CHAPTER 8. CUSP AND CORES IN GALAXIES: THE DEPENDENCE OF
DARK MATTER PROFILES ON THE STELLAR-TO-HALO MASS RATIO
scales where dark matter and dark energy dominate, but may be dynamically relevant on small, galactic scales. For example, as gas cools to the
central region of galaxy haloes, it adiabatically contracts dark matter to
the centre (e.g. Blumenthal et al. 1986; Gnedin et al. 2004). Such adiabatic
contraction exacerbates the mismatch between the profiles of dark matter
haloes and the observed density profiles inferred from rotation curves. Further, theoretical models with halo contraction are unable to self-consistently
reconcile the observed galaxy scaling relations, such as the rotation velocityluminosity and size-luminosity relations. Un-contracted or expanded haloes
are required (Dutton et al. 2007, 2011).
Two main mechanisms have been shown to cause expansion: supernova
feedback (Navarro et al. 1996a; Mo & Mao 2004; Read & Gilmore 2005;
Mashchenko et al. 2006; Pontzen & Governato 2012) and dynamical friction
(El-Zant et al. 2001; Tonini et al. 2006; Romano-Dı́az et al. 2008; Goerdt et
al. 2010; Cole et al. 2011). Supernova feedback drives sufficient gas outflows
to flatten the central dark matter density profile in simulated dwarf galaxies
(Governato et al. 2010; Teyssier et al. 2013) into a “core”. Dynamical
friction smooths dark matter density profiles during mergers.
The analytical model of Pontzen & Governato (2012) predicts that repeated outflows, rather than a single, impulsive mass loss (as in Navarro
et al. 1996a), transfer energy to the dark matter. The rapid oscillations
of the central gravitational potential perturb the dark matter orbits, creating a core. Mashchenko et al. (2006) decribed a similar mechanism in
which supernova-driven outflows changed the position of the halo centre,
also creating a core. Macciò et al. (2012) showed that reasonable amounts
of feedback in fully cosmological simulations can result in dark matter cores
rather than cusps in galaxies as massive as L? . Governato et al. (2012) measured the inner dark matter slope in a sample of simulated dwarf galaxies,
that match well the stellar-to-halo mass relation (Munshi et al. 2013), using
a power law density profile ρ ∝ rα . They found that the slope α increases,
i.e. the profile flattens, with increasing stellar mass.
In this chapter we study dark matter density profiles in a suite of galaxies
drawn from the MUGS (Stinson et al. 2010) and MaGICC projects (Stinson
et al. 2013; Brook et al. 2012b). The galaxies cover a broad mass range
from dwarf to massive discs, and are simulated using a variety of stellar
feedback implementations. The wide mass range of our simulated galaxies,
5.0×10⁵ < M? /M < 8.3×10¹⁰ , allows us to confirm and extend the results
of Governato et al. (2012). We show that the most relevant property for
the determination of the DM inner slope is actually the stellar-to-halo mass
ratio, i.e. the star formation efficiency, and that the relation between α and
stellar mass turns over such that the inner density profiles of more massive
129
8.2. SIMULATIONS
disc galaxies become increasingly steep.
We present our simulations in Section 8.2, the results and predictions in
Section 8.3 and the conclusions in Section 8.4.
8.2
Simulations
The hydrodynamical simulations used in this study are part of the MaGICC project, as described in Section 2.2.
All of the simulations are listed in Table 1 where they are separated into
3 mass groups: high, medium and low mass. The symbol shapes denote
simulations with the same initial conditions, while the colors indicate the
specific star formation and feedback model used. The medium and low mass
initial conditions are scaled down variants of the high mass initial conditions,
so that rather than residing in a 68 Mpc cube, they lie within a cube with
34 Mpc sides (medium) or 17 Mpc sides (low mass). This rescaling allows us
to compare galaxies with exactly the same merger histories at three different
masses. Differences in the underlying power spectrum that result from this
rescaling are minor (Springel et al. 2008; Maccio’ et al. 2008; Kannan et al.
2012). Moreover this methodology does not affect our analysis and results
since we reach, at the low halo mass end where we have made the rescaling,
the same conclusions as in Governato et al. (2012) whose galaxies do not
have rescaled initial conditions.
In addition to the hydrodynamic, SPH simulations, collisionless, dark
matter-only simulations were performed for each initial condition. These
DM-only runs exhibit a wide range of concentrations, from those typical of
the L? to dwarf galaxies. The concentration, c, varies between 10 <
∼c<
∼ 15,
where c ≡ Rvir /rs and rs is the scale radius of the NFW profile (Navarro
et al. 1996b). Such a range is sufficient to study density profiles. Indeed,
the sample includes a number of galaxies with high c at each mass range,
a legacy of preferentially simulating galaxies with early formation times in
order to model Milky Way formation.
The main haloes in our simulations were identified using the MPI+OpenMP
hybrid halo finder AHF1 (Knebe et al. 2013; Knollmann & Knebe 2009; Gill
et al. 2004a). The virial masses of the haloes, Mhalo , are defined as the
masses within a sphere containing ∆ = 390 times the cosmic background
matter density at z = 0.
1
http://popia.ft.uam.es/AMIGA
130
CHAPTER 8. CUSP AND CORES IN GALAXIES: THE DEPENDENCE OF
DARK MATTER PROFILES ON THE STELLAR-TO-HALO MASS RATIO
Table 8.1: Simulation parameters
Low
Medium
High
MUGS
label
g1536
g1536
g1536
g1536
g15784
g15784
g15784
g15784
g15784
g15807
g7124
g5664
g5664
g5664
g1536
g21647
g15784
g15784
g15784
g15784
g15807
g7124
g7124
g5664
g5664
g5664
g1536
g1536
g1536
g1536
g1536
gas part.
mass [M ]
3.1×10³
3.1×10³
3.1×10³
3.1×10³
3.1×10³
3.1×10³
3.1×10³
3.1×10³
3.1×10³
3.1×10³
2.5×10⁴
2.5×10⁴
2.5×10⁴
2.5×10⁴
2.5×10⁴
2.5×10⁴
2.5×10⁴
2.5×10⁴
2.5×10⁴
2.5×10⁴
2.5×10⁴
2×10⁵
2×10⁵
2×10⁵
2×10⁵
2×10⁵
2×10⁵
2×10⁵
2×10⁵
2×10⁵
2×10⁵
soft
[pc]
78.1
78.1
78.1
78.1
78.1
78.1
78.1
78.1
78.1
78.1
156.2
156.2
156.2
156.2
156.2
156.2
156.2
156.2
156.2
156.2
156.2
312.5
312.5
312.5
312.5
312.5
312.5
312.5
312.5
312.5
312.5
Mhalo
[M ]
9.4×10⁹
9.4×10⁹
9.4×10⁹
9.4×10⁹
1.9×10¹⁰
1.9×10¹⁰
1.9×10¹⁰
1.8×10¹⁰
1.8×10¹⁰
3.0×10¹⁰
5.3×10¹⁰
6.3×10¹⁰
6.6×10¹⁰
7.3×10¹⁰
8.3×10¹⁰
9.6×10¹⁰
1.8×10¹¹
1.8×10¹¹
1.9×10¹¹
1.7×10¹¹
2.9×10¹¹
4.5×10¹¹
4.9×10¹¹
5.6×10¹¹
5.7×10¹¹
5.9×10¹¹
7.2×10¹¹
7.7×10¹¹
7.0×10¹¹
7.8×10¹¹
7.0×10¹¹
Rvir
[kpc]
61
60
61
60
77
79
79
75
75
89
107
114
116
120
125
131
161
161
164
157
189
219
227
236
237
241
257
264
254
265
255
131
M?
[M ]
7.2×10⁵
5.1×10⁵
5.0×10⁵
7.0×10⁵
8.9×10⁶
7.4×10⁸
8.4×10⁶
6.0×10⁶
1.1×10⁷
1.6×10⁷
1.3×10⁸
2.4×10⁸
1.0×10⁹
8.7×10⁹
4.5×10⁸
2.0×10⁸
4.3×10⁹
2.4×10⁹
7.1×10⁹
8.6×10⁸
1.5×10¹⁰
6.3×10⁹
5.1×10¹⁰
2.7×10¹⁰
4.9×10¹⁰
1.4×10¹⁰
2.4×10¹⁰
8.3×10¹⁰
1.1×10¹⁰
2.5×10¹⁰
1.8×10¹⁰
ESN
esf
IMF
1.0
1.0
1.0
1.2
1.0
0.4
1.0
1.0
1.2
1.0
1.0
1.0
0.8
0.4
1.0
1.0
1.0
1.0
1.0
1.0
1.0
1.0
0.4
1.0
0.4
1.0
1.0
0.4
1.0
1.0
1.2
0.1
0.125
0.175
0.0
0.1
0
0.125
0.175
0.0
0.1
0.1
0.1
0.05
0
0.1
0.1
0.1
0.125
0.1
0.1
0.1
0.1
0
0.1
0
0.175
0.1
0
0.125
0.175
0.0
C
C
C
C
C
K
C
C
C
C
C
C
C
K
C
C
C
C
K
C
C
C
K
C
K
C
C
K
C
C
C
nth
[cm−3 ]
9.3
9.3
9.3
9.3
9.3
0.1
9.3
9.3
9.3
9.3
9.3
9.3
9.3
0.1
9.3
9.3
9.3
9.3
9.3
9.3
9.3
9.3
0.1
9.3
0.1
9.3
9.3
0.1
9.3
9.3
9.3
sym
•
•
•
•
N
N
N
N
N
∗
•
J
N
N
N
N
∗
∗
•
•
•
•
•
8.3. RESULTS
8.2.1
Star Formation and Feedback
The hydrodynamical simulations all include star formation, with the
stars feeding energy back into the interstellar medium (ISM) gas. A range
of star formation and feedback parameters are used in this study: all of
them employ blastwave supernova feedback (Stinson et al. 2006), and some
also include “early stellar feedback”, the energy that massive stars release
prior to their explosions as supernovae (Stinson et al. 2013). Early stellar
feedback uses a fraction, esf , of the total luminosity emitted by massive
stars. In the fiducial model used in the MaGICC simulations, esf =0.1,
which corresponds to the fraction of ionizing UV flux emitted from young
stellar populations.
Two initial mass functions were used in the simulations. MUGS used
(Kroupa et al. 1993,denoted K), while most of the rest used (Chabrier
2003,denoted C). Chabrier (2003) produces two times more type SNII per
mass of stars born.
The fiducial feedback (red colored symbols) includes early stellar feedback with esf = 0.1, 1051 erg of energy deposited per supernova and a
Chabrier (2003) IMF. The early stellar feedback efficiency esf is increased
from 0.1 to 0.125 (blue) in some simulations, while in others esf = 0, but
the energy per supernova is then increased by 20 per cent (cyan). In yellow,
we include simulations with esf = 0.175, in which diffusion of thermal energy from gas particles (Stinson et al. 2012; Wadsley et al. 2008) is allowed
to occur during the adiabatic expansion phase. We also include simulations
made with the original MUGS feedback, with 4 × 1050 erg per supernova,
a Kroupa et al. (1993) IMF and no esf , which systematically overproduce
the number of stars at each halo mass (black). Finally, an intermediate
feedback implementation with esf = 0.05, Chabrier IMF and 8 × 1050 erg
per supernova, has been also added (purple).
The reader is referred to Stinson et al. (2013) for a study of the effects
of the parameters on the galaxy properties. Suffice to say that the fiducial
simulations best match present observed galaxy properties (see also Brook
et al. 2012b).
8.3
Results
We study the response of the dark matter distribution to different feedback schemes within this full set of simulated galaxies. Some example density profiles are shown in Figure 8.1. It shows how the dark matter density
profiles of the hydrodynamic simulations can vary depending on physics
132
CHAPTER 8. CUSP AND CORES IN GALAXIES: THE DEPENDENCE OF
DARK MATTER PROFILES ON THE STELLAR-TO-HALO MASS RATIO
Figure 8.1: Density profiles of contracted (solid red and dashed black lines) and
expanded (dashed red line) dark matter haloes, together with the corresponding
DM only prediction (solid grey). The vertical dashed lines indicate 0.01 and 0.02
of the virial radius, our fiducial range to measure α.
(MUGS in black compared to MaGICC fiducial simulations, that use early
stellar feedback, in red), galaxy mass (solid line at high mass and dashed
line at medium mass), and how the hydrodynamic simulations compare with
the dark matter only run (solid grey line).
The halo profiles are calculated using logarithmically spaced bins and
the dark matter central density is subsequently fit using a single power law,
ρ ∝ rα , over a limited radial range. The vertical dashed lines in Fig. 8.1
show the fiducial range over which α is measured, 0.01 < r/Rvir < 0.02,
where Rvir is the virial radius. Other radial ranges are also used to ensure
the robustness of our results.
The choice of 0.01Rvir as the inner most bin satisfies the Power et al.
(2003) criterion for convergence even in our least resolved galaxy, as it encloses enough DM particles to ensure that the collisional relaxation time is
longer than the Hubble time. This range is also straightforward to reproduce, and is not dependent on the resolution of the simulations. We also
measured α between 3 < r/ < 10, where is the softening length of each
galaxy, and at a fixed physical range, 1 < r/kpc < 2. The choice of radial
fitting range does not affect our results qualitatively, and only makes small
quantitative differences which we show in our main results.
133
8.3. RESULTS
8.3.1
Inner slope as a funcion of halo mass
We first examine how α varies with stellar and halo mass. The top panel
of Fig. 8.2 shows the M? − Mhalo relation for the entire suite of galaxies with
the abundance matching prediction from Moster et al. (2013) indicated as
the central solid black line with the 1σ uncertainties plotted as thin lines
above and below the central relationship. Each galaxy is colored according
to the feedback model and symbol coded correspondingly to which initial
condition was used, as described in Table 1.
Simulations are scattered around the M? − Mhalo relation. The fiducial
feedback (red) represents the best fit to the abundance matching relation at
every halo mass. Increasing the early stellar feedback efficiency esf (blue)
reduces the stellar mass by a factor of two at the high mass end, while
leaving the total amount of stars relatively unchanged at the low mass
end, compared to the fiducial feedback. When early stellar feedback is not
included the energy per supernova must be increased to ESN = 1.2 in order
to lower the stellar mass to the Moster et al. (2013) relation (cyan). We note
that the star formation history using such feedback is quite different from
the fiducial runs, with more star formation at high redshift (see Stinson
et al. 2013,for details). The yellow simulations that include high esf have
systematically lower stellar-to-halo mass ratios, and also have high late time
star formation. Finally, the original MUGS feedback (black) systematically
forms too many stars at each halo mass.
The bottom panel of Fig. 8.2 shows α as a function of halo mass, where
Mhalo comes from the full hydrodynamical simulation2 . The solid black line
shows the theoretical expectation of α as a function of halo mass for the
DM only case, as in Maccio’ et al. (2008) assuming a WMAP3 cosmology;
the thin solid lines represent the scatter in the c-Mhalo relation.
At fixed halo mass, α varies greatly, depending on the feedback strength.
The simulations that most closely follow the M? − Mhalo relationship show a
notable flattening of inner profile slopes as mass increases, as in Governato
et al. (2012). This flattening is due to the increasing energy available from
SNe explosions, as derived in Peñarrubia et al. (2012). Indeed, all the
galaxies in our sample whose inner slope is shallower than the corresponding
DM run, have had an energy injection from SNe equal or higher than the
conservative values found in Peñarrubia et al. (2012). We note, however,
that in our simulations the core creation process does not only depend on
the total amount of energy available: in the g15784 MUGS dwarf galaxy
(black triangle), for example, the energy from SNe is higher than in the
2
Using Mhalo taken from the dark matter only run provides similar results, as the halo mass
amongst DM and SPH simulations changes by only a few percent.
134
CHAPTER 8. CUSP AND CORES IN GALAXIES: THE DEPENDENCE OF
DARK MATTER PROFILES ON THE STELLAR-TO-HALO MASS RATIO
Figure 8.2: Top panel: The abundance matching relation for our suite of simulated galaxies. The feedback schemes are indicated with different colors, while the
different galaxies are represented with symbols. The thick solid line corresponds
to the abundance matching prediction from Moster et al. (2013) and the thin lines
are the 1σ uncertainty on it. Bottom panel: The inner slope of the dark matter
distribution, measured between 0.01 and 0.02 of each galaxy’s virial radius, as a
function of total halo mass. The solid lines are the theoretical expectation for
dark matter haloes from Maccio’ et al. (2008) with its scatter.
135
8.3. RESULTS
Figure 8.3: The relation between dark matter density profile slope, α, measured
between 0.01 < r/Rvir < 0.02, and the stellar-to-halo-mass ratio of each galaxy.
Colors and symbols are the same as in Fig. 8.2. The best fit function of Eq. (8.1)
is overplotted as a dashed line. The grey area on the right side indicates the 1σ
peak in the M? /Mhalo abundance matching.
g15784 dwarfs of the same mass that had an expansion, yet this galaxy is
strongly contracted. What we observe is the interplay between the energy
from stellar feedback and the increased potential well caused by the high
number of stars at the galaxy center (see next section for more details).
The profiles are flattest around Mhalo ∼ 1011 M .
At higher masses, however, the inner profiles steepen again. All the
simulations above the M? − Mhalo relationship have inner slopes α < −1.5,
i.e. a contracted halo steeper than the DM expectation at each halo mass.
These simulations are all black colored indicating that they were part of the
MUGS simulations.
Thus, depending on the feedback and the halo mass used, the dark
matter haloes may expand, contract or retain the initial NFW inner slope.
It seems that the inner slope of the dark matter density profile does not
show a clear dependence on halo mass (or equivalently stellar mass) when
different feedback schemes are included.
136
CHAPTER 8. CUSP AND CORES IN GALAXIES: THE DEPENDENCE OF
DARK MATTER PROFILES ON THE STELLAR-TO-HALO MASS RATIO
8.3.2
Inner slope as a funcion of stellar-to-halo mass
While there is not a well defined relation between α and stellar or halo
mass individually, Fig. 8.3 shows α, measured between 0.01 < r/Rvir < 0.02,
plotted as a function of M? /Mhalo . The dark matter inner profile slope shows
a tight relationship as a function of M? /Mhalo : indeed, much of the scatter
apparent when α was plotted as a function of Mhalo disappears. The grey
area indicates the region where the M? /Mhalo ratios are more than 1σ above
the M? /Mhalo peak in the abundance matching relation. Real galaxies do
not have these star formation efficiencies.
The tight relationship between α and M? /Mhalo points to the conditions
in which stellar feedback can create dark matter density cores. At low values
of M? /Mhalo , the stellar content per halo mass is too small for the feedback
energy to modify the DM distribution, and the halo of such galaxies retains
a cuspy profile. As the stellar content per halo mass increases, the feedback
energy is strong enough to produce expanded dark matter haloes, and thus
for increasing values of M? /Mhalo the inner slope of dark matter profiles
gets flatter, reaching a maximum of α = −0.10 at M? /Mhalo = 0.5 per cent.
The maximum value of α is even smaller, i.e. the profiles are flatter, if the
inner slope is measured closer to the centre. At 3 < r/ < 10, α ∼ 0 at
M? /Mhalo = 0.35 per cent. At higher masses, the amount of stars formed in
the central regions deepens the potential well at the center of the galaxies,
opposing the expansion process and leading to increasingly cuspy profiles
for higher values of M? /Mhalo .
We verified this claim by studying in detail the medium mass version
of g15784 for different choices of feedback parameters. We found that the
stellar mass within 1 kpc is a good indicator of the minimum of the potential
in each galaxy and that, as expected, the cored most version of g15784 (green
triangle) has the shallowest potential well. Looking at the evolution of this
galaxy, we observe that its SFR decreases with time and correspondingly
the M? /Mhalo value within 1 kpc is fairly constant at every redshift, reaching
only 0.1 at z = 0; the fraction of gas vs stars at the center is always very
high, making possible the core creation since there is enough gas per total
mass (or stellar mass) to be efficient in flattening the profile.
This process does not occur in the cuspy version g15784 fiducial (red
triangle), which has a constant SFR after 11 Gyrs and its M? /Mhalo ratio
within 1 kpc increases up to 0.4 at z = 0: the increasing amount of stars at
the center causes the gas vs stars ratio to become very low, therefore the
gas available for the outflows is not sufficient to be effective at flattening
the profile because the potential well has been deepened by the stars.
We note that the total amount of gas in the inner 1kpc is similar in
137
8.3. RESULTS
Table 8.2: Best fit parameters and relative errors for the α vs M? /Mhalo relation.
The reduced Chi-Square is also listed.
radial range
0.01 < r/Rvir < 0.02
1 < r/kpc < 2
3 < r/ < 10
n
0.132
±0.042
0.168
±0.031
0.231
±0.043
log10 x0
−2.051
±0.074
−2.142
±0.133
−2.209
±0.064
β
0.593
±0.086
0.699
±0.213
0.494
±0.055
γ
1.99
±0.32
1.56
±0.12
1.49
±0.55
χ2r
1.16
1.29
1.28
both the cored and the cuspy medium mass versions of g15784: it is not
the absolute amount of gas which regulates the cusp/core transition, but its
relative value compared to the total (or stellar) inner mass. We conclude
that stellar mass at the galaxy center and in particular the ratio M? /Mhalo is
the most important quantity at indicating the deepening of the gravitational
potential which balances the energy released from SNe.
The relationship shown in Fig. 8.3 can be analytically modelled. We
use a four parameter, double power law function, whose best fit is shown in
Fig. 8.3 as a dashed black line:
"
α(X) = n − log10
X
x0
−β
+
X
x0
γ #
,
(8.1)
where X = M? /Mhalo while β and γ are the low and high star forming
efficiency slopes. The best fit parameters, summarized in Table 2, were
obtained using a χ2 minimization fitting analysis. The same dependence,
but with different normalization, is obtained for the various criteria used to
define the inner radial range, also shown in Table 2.
Fig. 8.4 shows the abundance matching relationship of M? /Mhalo as a
function of Mhalo color coded according to the expected value of DM inner
slope when α is measured at 0.01 < r/Rvir < 0.02. The halo mass at
which the flattest DM profiles are expected to be found, corresponding to
a peak M? /Mhalo = 0.5 per cent, is Mhalo ≈ 1010.8 M . The profile becomes
increasingly cuspy, approaching the NFW value for galaxies near the Milky
Way mass: only galaxies with M? /Mhalo > 3.8 per cent, which is the peak
in the abundance matching prediction, are contracted. Such galaxies are
outliers in the Universe.
138
CHAPTER 8. CUSP AND CORES IN GALAXIES: THE DEPENDENCE OF
DARK MATTER PROFILES ON THE STELLAR-TO-HALO MASS RATIO
Figure 8.4: The abundance matching prediction color coded according to the
expected value of the DM inner slope at every halo mass. We used the best fit
parameters of α measured between 0.01 and 0.02 of each galaxy’s virial radius.
8.3.3
Core creation
We next examine which mechanism is responsible for the creation of
cores, using the three simulations shown in Fig. 8.1 as case studies. As
outlined in §8.1, core formation from stellar feedback depends on repeated
starbursts that are able to move gas enough to have a dynamical effect on
the dark matter (Read & Gilmore 2005; Governato et al. 2010; Macciò et
al. 2012; Pontzen & Governato 2012; Teyssier et al. 2013).
The four panels of Fig. 8.5 show how some relevant quantities vary as
a function of lookback time. From top to bottom we present: (i) the star
formation history, which shows clear starbursts that can drive outflows;
(ii) the gas mass within a sphere of 1 kpc from the center of the galaxy,
which shows when the gas has been driven out of the galaxy centre; (iii)
the distance ∆ between the position of the dark matter and gas potential
minima, which shows how much the baryonic centre of mass moves around;
and (iv) the M? /Mhalo value that determines α.
The medium mass version of g5664 that uses the fiducial MaGICC feedback (red dashed line) has the flattest density profile at z = 0, so we expect
it to have the most violent history. Indeed, it has a bursty star formation
history (multiplied by 100 to get it into the same range as the other galaxy
star formation histories), and a star formation efficiency, M? /Mhalo , that
stays near the optimal value for cores, between ∼ 0.35 and 0.5 per cent
139
8.3. RESULTS
throughout its evolution. A couple of the bursts of star formation cause
significant gas loss from the inner 1 kpc, which results in consistent offsets
between the positions of the center of gas and dark matter distributions.
The medium mass version of g5664 that uses the low feedback MUGS
physics (dashed black line) is the most contracted galaxy of this set. Other
than a peak of star formation rate at an early time, corresponding to its
peak dark matter accretion, its star formation history is a smoothly declining exponential. This early star formation quickly drives the efficiency
M? /Mhalo to values higher than 10 per cent, which, according to Fig. 8.3,
leads to a cuspy density profile. The high amount of stars already formed 11
Gyrs ago within this galaxy creates a deep potential well which suppresses
the effects of stellar feedback, so that little gas flows out of the inner regions
and the DM and gas distributions share the same centre of mass throughout
the galaxy’s evolution.
Perhaps the most interesting case is that of the fiducial high mass g5664
galaxy (red solid line). At z = 0 its dark matter profile is slightly contracted
compared to the NFW halo, but less contracted than the lower mass MUGS
case (dashed black line). Indeed, its star formation efficiency, M? /Mhalo ∼ 5
per cent at z = 0, is lower than the MUGS case, but still high enough to have
contracted dark matter. This galaxy shows elevated star formation starting
∼6 Gyrs ago, which correlates with an increase of M? /Mhalo , increased gas
in the centre with fewer outflows and a more constant ∆. Before z = 0.66
the star formation efficiency, M? /Mhalo , of this galaxy was still ∼ 1 per cent,
and the feedback energy was still able to cause gas flows and variations in
∆. When we examine the galaxy at that epoch, it indeed had an expanded
dark matter profile with α > −1.0, measured between 0.01 and 0.02 of the
physical virial radius. Immediately after the starburst the star formation
efficiency increases, the dark matter and gas start to share the same centre,
the outflows from the inner region diminish, and the profile steepens to
α < −1.0 by z = 0.66 (6 Gyrs ago) and finally to α = −1.8 by z = 0 with
a star formation efficiency of M? /Mhalo ∼ 5 per cent.
8.3.4
Predictions for observed galaxies
Combining the parameters in Table 2 with the Moster et al. (2013) relationship, it is possible to predict the inner density profile slope of a galaxy
based on its observed stellar mass. This allows us to make predictions which
are independent of the feedback prescription. Using the best fit parameters
from the 0.01 < r/Rvir < 0.02 range, we can compute the median expected
α dependence on stellar mass for galaxies as massive as Mhalo ≈ 1012 M
(M? ≈ 3.4 × 10¹⁰ M ):
140
CHAPTER 8. CUSP AND CORES IN GALAXIES: THE DEPENDENCE OF
DARK MATTER PROFILES ON THE STELLAR-TO-HALO MASS RATIO
Figure 8.5: For the galaxies in Fig 8.1, we show the evolution of (i) the star
formation history; (ii) the gas flows within a 1 kpc sphere centered at the galaxy
center; (iii) the relative position between gas and dark matter potential minima
and (iv) the M? /Mhalo as a function of lookback time. Note that the SFR of the
M? = 2.4 × 10⁸ M galaxy (red dashed line) has been multiplied by a factor 100
in order to be shown in the same scale range.
141
8.3. RESULTS
Figure 8.6: Expected relation between galaxies’ rotation velocity and inner slope
of their dark matter haloes. The three lines correspond to different radial ranges
used for measuring α. The dashed lines refer to the linear extrapolation of the
baryonic TF relation (Dutton et al. 2010) below M? = 109 M .
α = 0.132 − log10
where
η = 0.84
M∗
109 M
η 2.58 + 1
η 1.99
−0.58
+ 0.06
M∗
109 M
(8.2)
0.26
(8.3)
The peak of this function occurs at M? = 108.5 M and the low mass end
slope, 0.34, is in good agreement with the one obtained in Governato et al.
(2012) for stellar masses between 104 < M? /M < 109.4 . Our study extends
the prediction of cores vs cusps to L? scales and predicts a turnover in the
relation between inner slope and galaxy mass for M? > 108.5 M : above this
value, the inner slope decreases as α ∝ −0.64 log10 M? /M .
Taking a step further, the stellar content of galaxies is then connected
to their observed rotation velocity through the Tully-Fisher (TF) relation.
Equation 4 of Dutton et al. (2010) parameterizes Vrot at 2.2 I-band exponential scale lengths as a function of M? . Using this M? −Vrot relation we predict
α as a function of Vrot , the rotation velocity of galaxies. Fig. 8.6 shows, for
the different radial ranges where we measure the inner density profile, α as
a function of observed rotation velocity for galaxies with Mhalo 6 1012 M .
The dashed lines indicate where the Tully-Fisher relationship was linearly
extrapolated for M? < 109 M .
142
CHAPTER 8. CUSP AND CORES IN GALAXIES: THE DEPENDENCE OF
DARK MATTER PROFILES ON THE STELLAR-TO-HALO MASS RATIO
Fig. 8.6 shows that the galaxies with the flattest inner density profiles
are found at Vrot ∼ 50 km s−1 . α decreases in more massive galaxies where
the inner density profiles become more cuspy until they reach the NFW
profile.
We note that the position at which the inner slope is measured has
an effect on the α values, which alters the best fit parameters reported in
Table 2, and consequently determines how α varies with rotation velocity.
Thus, Fig. 8.6 has to be interpreted according to the radial range chosen,
though the general trends are not changed and the peak of α remains at
Vrot ∼ 50 km s−1 , independent of where the slope is measured.
The major difference between α measured at 0.01 < r/Rvir < 0.02 and
the other radial ranges is that the inner slope is steeper for Vrot > 100 km s−1
in the former case. A steeper slope is expected because 0.01 < r/Rvir <
0.02 is further from the galaxy centre than the other two measurements.
However, none of the measured α values fall below the NFW expectation as
Vrot approaches 250 km s−1 . Thus, dark matter haloes are never contracted
in our model, even in the most massive disc galaxies.
8.4
Conclusions
Using 31 simulated galaxies from the MaGICC project, we showed that
dark matter density profiles are modified by baryonic processes in the centre
of galactic haloes. The inner profile slope depends solely on the mass of stars
formed per halo mass and is independent of the particular choice of feedback
parameters within our blastwave and early stellar feedback scheme. Similar
to previous work, the expansion of the dark matter profile results from
supernova-driven outflows that cause fluctuations in the global potential
and shift the centre of the gas mass away from the centre of the dark matter
mass.
<
At values of M? /Mhalo ∼
0.01 per cent, the energy from stellar feedback
is not sufficient to modify the DM distribution, and these galaxies retain
a cuspy profile. At higher ratios of stellar-to-halo mass, feedback drives
the expansion of the DM haloes, resulting in cored profiles. The shallowest profiles form in galaxies with M? /Mhalo ∼ 0.5 per cent. According to
the abundance matching relation (Moster et al. 2013), these galaxies have
Mhalo ≈ 1010.8 M and M? ≈ 108.5 M . In higher mass haloes, the deepening
of the potential due to stars that form in the central regions suppresses
supernova-driven outflows and thus lowers expansion, leaving cuspier profiles.
The abundance matching peak of star formation efficiency, M? /Mhalo =
143
8.4. CONCLUSIONS
3.8 per cent, occurs at Mhalo = 1011.76 M , which is close to the lowest
current estimate of the Milky Way mass. Our model predicts that such a
halo will be uncontracted and have an NFW-like inner slope of α = −1.20
when the slope is measured between ∼ 2 and ∼ 4kpc.
We combine our parameterization of α as a function of M? /Mhalo with
the empirical abundance matching relation to assign a median relationship
between α and M? . The inner slope of the dark matter density profile
increases with stellar mass to a maximum (most cored profile) at M? ≈
108.5 M , before decreasing toward cuspier profiles at higher stellar masses.
Below M? ≈ 108.5 M the DM inner slope increases with stellar mass as
α ∝ 0.34 log10 M? /M , similar to the relation found in Governato et al.
(2012). For M? > 108.5 M , dark matter haloes become cuspier, with α ∝
−0.64 log10 M? /M .
The Tully-Fisher relation allows us to predict the dependence of the DM
inner slope on the observed rotation velocity of galaxies. Using our results
and the stellar mass TF relation from Dutton et al. (2010), we find that
the flattest inner profiles are expected for galaxies with Vrot ∼ 50 km s−1 . α
decreases for more massive galaxies, leading to cuspier profiles and eventually reaching the NFW prediction at the Milky Way mass. We note that,
in agreement with our findings, the most clear observational measurements
of flattened “core” profiles of disc galaxies (de Blok et al. 2008; Kuzio de
Naray et al. 2008b, 2009; Oh et al. 2011b) are found in low surface brightness
(LSB) galaxies with Vrot < 100 km s−1 .
More massive disc galaxies, being baryon dominated, suffer from larger
uncertainties in the disc-halo decomposition of their rotation curves, making
it difficult to distinguish if their dark matter profile is cuspy or cored. Some
studies conclude that such galaxies, those with Vrot > 150 km s−1 , can be
described with cored profiles (Borriello & Salucci 2001; Donato et al. 2004;
McGaugh et al. 2007), while others find that NFW model provide equally
good fits for these high luminosity galaxies (de Blok et al. 2008; Kuzio de
Naray et al. 2008b).
More recently, Martinsson et al. (2013) presented rotation-curve mass
decompositions of several massive spiral galaxies, and found no significant
difference between the quality of a pseudo-isothermal sphere or a NFW
model in fitting the DM rotation curves of individual galaxies, given the
uncertainties in the contribution of baryons. If high surface brightness discs
are sub-maximal (e.g. Courteau & Rix 1999) their haloes are allowed to be
cuspy at the center.
An aspect not taken into account in our simulations of galaxy formation
is the influence of AGN feedback on the density profile of dark matter haloes.
144
CHAPTER 8. CUSP AND CORES IN GALAXIES: THE DEPENDENCE OF
DARK MATTER PROFILES ON THE STELLAR-TO-HALO MASS RATIO
We acknowledge that this form of feedback starts to be relevant at the high
halo mass end, where we observe increasingly cuspy galaxies: the study of
the core/cusp problem would thus benefit from a future implementation of
this type of feedback.
Our novel prediction for cusp vs core formation can be tested and, at
least at the low halo mass end, well constrained using observational data
sets. This study can be applied to theoretical modeling of galaxy mass
profiles, as well as to modeling of populations of disc galaxies within cold
dark matter haloes. We find this encouraging, and hope that our study
motivates more systematic analysis of the dependance of α on galaxy mass
in real disc galaxies.
145
8.4. CONCLUSIONS
146
Chapter 9
Influence of galaxy formation
on dark matter haloes: a mass
dependent density profile
We introduce a mass dependent density profile to describe the distribution of dark matter within galaxies, which takes into account the stellar-tohalo mass dependence of the response of dark matter to baryonic processes.
The study is based on the analysis of hydrodynamically simulated galaxies
from dwarf to Milky Way mass, drawn from the MaGICC project, which
have been shown to match a wide range of disk scaling relationships. We
find that the best fit parameters of a generic double power-law density profile vary in a systematic manner that depends on the stellar-to-halo mass
ratio of each galaxy. Thus, the quantity M? /Mhalo constrains the inner (γ)
and outer (β) slopes of dark matter density, and the sharpness of transition between the slopes (α), reducing the number of free parameters of
the model to two. Due to the tight relation between stellar mass and halo
mass, either of these quantities is sufficient to describe the dark matter halo
profile including the effects of baryons. The concentration of the haloes
in the hydrodynamical simulations is consistent with N-body expectations
up to Milky Way mass galaxies, at which mass the haloes become twice as
concentrated as compared with pure dark matter runs.
This mass dependent density profile can be directly applied to rotation
curve data of observed galaxies and to semi analytic galaxy formation models as a significant improvement over the commonly used NFW profile.1
1
Note that through this chapter the inner slope of density profile will be indicated as γ, as
opposite to the previous chapter in which it was indicated as α.
147
9.1. INTRODUCTION
9.1
Introduction
Over several orders of magnitude in radius, dark matter (DM) halo density profiles arising from N-body simulations are well described by the socalled ’NFW’ model (Navarro et al. 1996b; Springel et al. 2008; Navarro
et al. 2010), albeit with well known systematic deviations (e.g., Navarro et
al. 2004; Springel et al. 2008; Gao et al. 2008; Navarro et al. 2010; Dutton
& Macciò 2014). The NFW function consists of two power laws, the inner region where the density is behaving as ρ ∝ r−1 and the outer part as
ρ ∝ r−3 .
The central ρ ∝ r−1 “cusps” of such model disagree with observations
of real galaxies where mass modeling based on rotation curves finds much
shallower inner density slopes, known as “cored” profiles (e.g., Moore 1994;
Salucci & Burkert 2000; de Blok et al. 2001; Simon et al. 2005; de Blok et al.
2008; Kuzio de Naray et al. 2008b, 2009; Oh et al. 2011b). Cored galaxies
are also found within the fainter, dark matter dominated dwarfs spheroidal
galaxies surrounding the Milky Way (Walker & Peñarrubia 2011). This
cusp/core discrepancy is usually seen as one of the major problems of the
ΛCDM paradigm at small scales.
The NFW profile is, however, derived from pure DM simulations in
which particles only interact through gravity. These simulations neglect
hydrodynamical processes that may be relevant in determining the inner
halo profile. Many studies have shown how baryons can affect the dark
matter (e.g., Tissera & Dominguez-Tenreiro 1998). Gas cooling to the center
of a galaxy causes adiabatic contraction (e.g. Blumenthal et al. 1986; Gnedin
et al. 2004), whose effect strengthens cusps and exacerbates the mismatch
between theoretical profiles and observations. Rather, expanded haloes are
required to reconcile observed galaxy scaling relations of both early and
late-type galaxies (Dutton et al. 2007, 2013).
Baryons can expand haloes through two main mechanisms (see Pontzen
& Governato (2014) for a recent review): outflows driven by stellar or AGN
feedback (Navarro et al. 1996a; Mo & Mao 2004; Read & Gilmore 2005;
Mashchenko et al. 2006; Duffy et al. 2010; Pontzen & Governato 2012;
Martizzi et al. 2013) and dynamical friction (El-Zant et al. 2001; Tonini et
al. 2006; Romano-Dı́az et al. 2008; Del Popolo 2009, 2010; Goerdt et al.
2010; Cole et al. 2011).
While dynamical friction is effective at expanding high mass haloes hosting galaxy clusters, stellar feedback is most effective at expanding low mass
haloes (Governato et al. 2010). Gas cools into the galaxy centre where
it forms stars that drive repeated energetic outflows. Such outflows move
enough gas mass to create a core in an originally cuspy dark halo, due to
148
CHAPTER 9. INFLUENCE OF GALAXY FORMATION ON DARK
MATTER HALOES: A MASS DEPENDENT DENSITY PROFILE
the DM response to the adjusted gravitational potential. Peñarrubia et al.
(2012) calculated the energy required to flatten a density profile as a function of halo mass. The cusp/core change can be made permanent if the
outflows are sufficiently rapid (Pontzen & Governato 2012).
Simulations from dwarf galaxies (Governato et al. 2010; Zolotov et al.
2012; Teyssier et al. 2013) to Milky Way mass (Macciò et al. 2012) have
produced dark matter halo expansion depending on the implementation
of stellar feedback. Governato et al. (2012) showed that only simulated
galaxies with stellar masses higher than ∼ 107 M expand their haloes.
They also showed that the inner DM profile slope, γ in ρ ∝ r−γ , flattens
with increasing stellar mass, resulting from the increase of available energy
from supernovae. An increase in stellar mass may, however, also deepen
the potential well in the central region of the halo: indeed, Di Cintio et al.
(2014b) showed that above a certain halo mass such a deepened potential
well opposes the flattening process.
Di Cintio et al. (2014b) propose that γ depends on the stellar-to-halo
−4
mass ratio of galaxies. At M? /Mhalo <
∼ 10 there is not enough supernova
energy to efficiently change the DM distribution, and the halo retains the
original NFW profile, γ ∼ −1. At higher M? /Mhalo , γ increases, with the
maximum γ (most cored galaxies) found when M? /Mhalo ∼3 − 5 × 10⁻³ . The
empirical relation between the stellar and halo mass of galaxies (Moster et
al. 2010; Guo et al. 2010) implies that this corresponds to M? ≈108.5 M and
Mhalo ≈1011 M . In higher mass haloes, the outflow process becomes ineffective at flattening the inner DM density and the haloes have increasingly
cuspy profiles.
In this study, we take the next step to provide a mass-dependent parametrization of the entire dark matter density profile within galaxies. Using high
resolution numerical simulations of galaxies, performed with the smoothedparticle hydrodynamics (SPH) technique, we are able to study the response
of DM haloes to baryonic processes. As with the central density slope γ in
Di Cintio et al. (2014b), we find that the density profile parameters depend
on M? /Mhalo .
This study is based on a suite of hydrodynamically simulated galaxies,
drawn from the Making Galaxies In a Cosmological Context (MaGICC)
project. The galaxies cover a broad mass range and include stellar feedback
from supernovae, stellar winds and the energy from young, massive stars.
The galaxies that use the fiducial parameters from Stinson et al. (2013)
match the stellar-halo mass relation at z = 0 (Moster et al. 2010; Guo et
al. 2010) and at higher redshift (Kannan et al. 2013) as well as a range of
present observed galaxy properties and scaling relations (Brook et al. 2012b;
Stinson et al. 2013). Unlike previous generations of simulations, there is no
149
9.2. SIMULATIONS
catastrophic overcooling, no loss of angular momentum (Brook et al. 2011,
2012a), and the rotation curves do not have an inner peak, meaning that
the mass profiles are appropriate for comparing to real galaxies.
We present a profile that efficiently describes the distribution of dark
matter within the SPH simulated galaxies, from dwarfs to Milky Way mass.
The profile is fully constrained by the integrated star formation efficiency
within each galaxy, M? /Mhalo , and the standard two additional free parameters, the scale radius rs and the scale density ρs that depend on individual
halo formation histories. After converting rs into r−2 , i.e. the point where
the logarithmic slope of the profile equals −2, we derive the concentration
parameter for this new profile, defined as c = Rvir /r−2 , and show that for
high mass galaxies it substantially differs from expectation based on N-body
simulations.
This chapter is organized as follows: the hydrodynamical simulations
and feedback model are presented in Section 9.2, the main results, including the derivation of profile parameters and galaxies rotation curves, together with a comparison with N-body simulations in Section 9.3 and the
conclusions in Section 9.4.
9.2
Simulations
The SPH simulated galaxies we analyze here make up the Making Galaxies in a Cosmological Context (MaGICC) project (Stinson et al. 2013; Brook
et al. 2012b), as described in Section 2.2.
Standard formulations of SPH are known to suffer from some weaknesses
(Agertz et al. 2007), such as condensation of cold blobs which becomes particularly prominent in galaxies of virial masses ∼ 1012 M . We thus checked
our results using a new version of gasoline which has a significantly different solver of hydrodynamics than the previous one. Within two simulated
galaxies, which represent extreme cases (the cored most case and the highest mass case), we find that the dark matter density profiles are essentially
identical to the ones found with the standard version of gasoline. As this
new hydrodynamical code is not yet published, we have not included any
figures here, but these preliminary tests give us confidence that our results
are not predicated on the specific of the hydrodynamics solver. Indeed, it
has been shown already that similar expansion processes are observed in
galaxies simulated with grid-based codes (Teyssier et al. 2013).
The galaxies properties are summarized in Table 1: the sample comprises
ten galaxies with five different initial conditions, spanning a wide range in
halo mass. The initial conditions of the medium and low mass galaxies are
150
CHAPTER 9. INFLUENCE OF GALAXY FORMATION ON DARK
MATTER HALOES: A MASS DEPENDENT DENSITY PROFILE
Table 9.1: Properties of the SPH simulated galaxies used. Mhalo is the dark
matter mass within the virial radius. The increasing symbol size indicates the
membership of each galaxy to the low, medium or high mass group.
Mass
range
Low
Medium
High
ID
g1536
g15784
g15807
g7124
g5664
g1536
g15784
g7124
g5664
g1536
soft
[pc]
78.1
78.1
78.1
156.2
156.2
156.2
156.2
312.5
312.5
312.5
Mhalo
[M ]
9.4×10⁹
1.9×10¹⁰
3.0×10¹⁰
5.3×10¹⁰
6.3×10¹⁰
8.3×10¹⁰
1.8×10¹¹
4.5×10¹¹
5.6×10¹¹
7.2×10¹¹
Rvir
[kpc]
60
77
89
107
114
125
161
219
236
257
M?
[M ]
7.2×10⁵
8.9×10⁶
1.6×10⁷
1.3×10⁸
2.4×10⁸
4.5×10⁸
4.3×10⁹
6.3×10⁹
2.7×10¹⁰
2.4×10¹⁰
sym
•
N
∗
•
N
∗
•
scaled down variants of the high mass ones. This assures us than any result
derived from such sample, and presented in Section 9.3, will not be driven
by the specific merger history. It would be desirable, of course, to have
a larger statistical sample of simulated galaxies and initial conditions, an
issue that we hope to address in the near future.
The main haloes in our simulations were identified using the MPI+OpenMP
hybrid halo finder AHF2 (Knollmann & Knebe 2009; Gill et al. 2004a). The
virial masses of the haloes are defined as the masses within a sphere containing ∆ = 92.8 times the cosmic critical matter density at z = 0.
The hydrodynamical simulations use the stochastic star formation recipe
described in Stinson et al. (2006) in such a way that, on average, they
reproduce the empirical Kennicut-Schmidt Law (Schmidt 1959; Kennicutt
1998).
The stars feed energy back into the interstellar medium (ISM) gas through
blast-wave supernova feedback (Stinson et al. 2006) and ionizing feedback
from massive stars prior to their explosion as supernovae, referred to as
“early stellar feedback” (Stinson et al. 2013).
Early stellar feedback is implemented using 10% of the luminosity emitted by massive stars prior to their explosion as supernovae.
We analyze simulated galaxies that are part of the fiducial run of the
MaGICC project, which uses early stellar feedback with esf = 0.1, a Chabrier
2
http://popia.ft.uam.es/AMIGA
151
9.3. RESULTS
(2003) initial mass function, a ESN = 1051 erg energy from SNe and a gas
density threshold of nth = 9.3cm−3 . These simulations match the abundance matching relation at z = 0 (Moster et al. 2010; Guo et al. 2010),
many present observed galaxy properties (Brook et al. 2012b; Stinson et al.
2013) as well as properties at high redshift (Kannan et al. 2013; Obreja et
al. 2014).
9.3
Results
We analyze the dark matter density profiles of our SPH simulated galaxies using a five-free parameter α, β, γ profile function. We show how to
express α, β and γ as functions of the integrated star formation efficiency
M? /Mhalo at z=0.
9.3.1
α, β, γ profile
The NFW profile is a specific form of the so-called (α, β, γ) double powerlaw model (Merritt et al. 2006; Hernquist 1990; Jaffe 1983):
ρs
ρ(r) = γ h
α i(β−γ)/α
r
1 + rrs
rs
(9.1)
where rs is the scale radius and ρs the scale density. rs and ρs are characteristics of each halo, related to their mass and formation time (e.g. Prada
et al. 2012; Muñoz-Cuartas et al. 2011; Macciò et al. 2007; Bullock et al.
2001). The inner and outer regions have logarithmic slopes −γ and −β,
respectively, while α regulates how sharp the transition is from the inner
to the outer region. The NFW profile has (α, β, γ) = (1, 3, 1). In this case,
the scale radius equals the radius where the logarithmic slope of the density
profile is −2, rs = r−2 . In the generic five-parameter model,
r−2 =
9.3.2
2−γ
β−2
1/α
rs
(9.2)
Constraining the halo profile via M? /Mhalo
The dark matter halo profiles of each SPH simulated galaxy are computed in spherically averaged radial bins, logarithmically spaced in radius.
152
CHAPTER 9. INFLUENCE OF GALAXY FORMATION ON DARK
MATTER HALOES: A MASS DEPENDENT DENSITY PROFILE
Figure 9.1: Best fit parameters for the inner slope, γ (green), outer slope β
(red), and transition α (black) plotted as a function of integrated star formation
efficiency, M? /Mhalo . The upper x-axis shows the corresponding Mhalo /M? as a
reference to the mass to light ratio. The parameters are for the double power
law model of the dark matter density profile in Eq. (9.1). Each SPH simulated
galaxy is represented by a symbol of a different size and shape as described in
Table 1. The dotted lines represent the dependence of α, β and γ on M? /Mhalo .
Their functional forms are given in Eq. (9.3).
The number of bins Nbin in each halo is proportional to the number of particles within the virial radius, so that the best resolved haloes (with ∼ 9x10⁶
particles) will have an higher Nbin with respect to the least resolved ones
(with 3.5x10⁵ particles).
We only considered bins within 0.01Rvir < r < Rvir , as this region
fulfills the convergence criterion of Power et al. (2003) in the least resolved
simulation. We perform a fitting procedure of the density profile using
Eq. (9.1), assigning errors to the density bins depending on the Poisson noise
given by the number of particles within each shell, and using a LevenbergMarquardt technique.
Fig. 9.1 shows how the inner slope γ (green), the outer slope β (red)
and the transition parameter α (black) vary as a function of the M? /Mhalo
ratio. The symbols, as explained in Table 1, correspond to different initial
conditions, while their sizes indicate the mass of the halo. The dotted lines
show the best fit for each parameter, which we explain below in Eq. (9.3).
At very low integrated star formation efficiency, we expect to find the
153
9.3. RESULTS
same profile as a dark matter only simulation since star formation is too
sporadic to flatten the profile. Indeed, at log10 (M? /Mhalo )=−4.11 the best
fit values are α=1, β=3, and γ=1, exactly an NFW halo.
At higher integrated star formation efficiencies, both the inner (γ) and
outer (β) profile slopes decline to lower values than an NFW model, indicating halo expansion. At the same mass, the transition between inner
and outer region becomes sharper: α increases as high as 3. Thus, while
baryonic processes affect the profiles mainly in the inner region of slope γ,
we must take their effects into account when deriving the other parameters
α and β.
The star formation efficiency at which the cusp/core transition happens in our simulations is in agreement with the analytic calculation of
Peñarrubia et al. (2012), who compared the energy needed to remove a
cusp with the energy liberated by SNeII explosions.
The value of the inner slope (γ) varies with integrated star formation
efficiency as found in Di Cintio et al. (2014b). The minimum inner slope
is at −2.6<log10 (M? /Mhalo )<−2.4. So, as in Di Cintio et al. (2014b), the
dark matter cusps are most efficiently flattened when M? /Mhalo ∼ 3 − 5 ×
10−3 . Above log10 (M? /Mhalo )=−2.4 (M/L∼250), the parameters turn back
towards the NFW values since more mass collapses to the centre than the
energy from gas can pull around.
We fit the correlation between α, β, γ and the integrated star formation
efficiency using two simple functions. The outer slope, β, is fit with a
parabola as a function of M? /Mhalo . The inner slope, γ, and the transition
parameter, α, are both fit using a double power law model as a function of
M? /Mhalo as in Di Cintio et al. (2014b). The best fit are shown as dotted
lines in Figure 9.1. Their functional forms are:
α = 2.94 − log10 [(10X+2.33 )−1.08 + (10X+2.33 )2.29 ]
β = 4.23 + 1.34X + 0.26X 2
(9.3)
γ = −0.06 + log10 [(10X+2.56 )−0.68 + (10X+2.56 )]
where X = log10 (M? /Mhalo ).
Eq. (9.3) allows us to compute the entire dark matter profiles based solely
on the stellar-to-halo mass ratio of a galaxy. We stress that the mass range
of validity of Eq. (9.3) is −4.1 < log10 (M? /Mhalo ) < −1.3: at lower masses
the (α, β, γ) value returns to the usual (1,3,1), NFW prediction, while at
masses higher than 1012 M , i.e. the Milky Way, other effects such as AGN
feedback can concur to modify the profile in a way not currently testable
with our set of simulations. In the future, having a larger statistical sample
154
CHAPTER 9. INFLUENCE OF GALAXY FORMATION ON DARK
MATTER HALOES: A MASS DEPENDENT DENSITY PROFILE
of simulated galaxies would certainly be desirable in order to compute the
scatter in the relations defined by Eq. (9.3).
9.3.3
Checking the α, β, γ constraints
Using the constrained values for (α, β, γ) from Eq. (9.3), we re-fit the
dark matter density profiles of our haloes with the only standard two-free
parameters, rs and ρs . The fit results are shown as dashed red lines in
Fig. 9.2, superimposed on the dark matter density profiles of each hydrodynamically simulated galaxy (black lines). The galaxies are ordered according
to their mass from top left to bottom right. The best fit values obtained for
the scale radius rs and scale density ρs are shown in the upper-right corner,
along with the constrained values used for (α, β, γ). The r.m.s. value of
fit, defined as
σrms
v
u
bins
u 1 NX
=t
(log10 ρsim,k − log10 ρfit,k )2 ,
Nbins k=1
(9.4)
are shown in the lower-left corner. The average value of σrms is 0.051
and shows that Eq. (9.3) can accurately describe the structure of simulated
dark matter density profiles.
Since we started our analysis using a five-free parameters model, it
is possible that some degeneracies may exist, and other combinations of
(α, β, γ, rs , ρs ) might be equally precise in describing dark matter haloes.
We do not claim that our model is unique, but rather that provides a prescription that successfully describes very different dark matter profiles, both
cored and cusp ones, in galaxies. Our model, reduced to a two-free parameters profile using the value of M? /Mhalo (or simply M? ) of each galaxy,
shows very good precision in reproducing halo density profiles of cosmological hydrodynamically simulated galaxies of any halo mass.
9.3.4
Modeling rotation curves
It is may be easier to compare observations with the dark matter rotation curves, rather than
p with the density profile. We proceed by deriving
the quantity Vc (r) = GM (r)/r for the dark matter component within
hydrodynamical simulations, where
155
9.3. RESULTS
Figure 9.2: Halo dark matter density profiles (black line) and best fit model
(dashed red line) for the hydrodynamically simulated galaxies. The profiles start
at 0.01Rvir to ensure convergence and the galaxies are shown in increasing halo
mass order, same as in Table 1. The constrained α, β and γ values, from Eq. (9.3),
are shown together with the corresponding efficiency M? /Mhalo . The two free
parameters of the fit, rs and ρs , are also listed as well as the r.m.s value σrms .
156
CHAPTER 9. INFLUENCE OF GALAXY FORMATION ON DARK
MATTER HALOES: A MASS DEPENDENT DENSITY PROFILE
Z
M (r) = 4πρs
0
r
γ h
r0
1+
rs
r02
0
α i(β−γ)/α dr
(9.5)
r0
rs
The values (α, β, γ) are constrained through Eq. (9.3) for each galaxy, while
ρs and rs are the best-fit results as listed in Fig. 9.2, such that at the virial
radius M (Rvir ) equals Mhalo .
The derived rotation curves for our model are shown as dashed red lines
in Fig. 9.3, with galaxies again ordered by mass as in Fig. 9.2. The rotation
curves taken directly from simulations, namely using the dark matter component within each hydrodynamically simulated galaxy, are shown as solid
black lines. Each velocity curve is normalized to its maximum value Vmax ,
and plotted in units of the virial radius.
The smaller panels within each plot show a zoom-in of Vc (r) within
0.1Rvir , in order to better appreciate any difference between the actual simulations (solid black) and our parametrization (dashed red). Within this
inner panel we also show as a green dotted-dashed line the rotation curve as
derived from the dark matter only runs for each galaxy, scaled by the baryon
fraction value. There is a very good agreement between our parametrized
dark matter rotation curves and simulated ones, with differences that are
below 10 per cent at any radii and for any galaxy. Further, when the contribution from the baryonic component is added to the rotation curves,
the difference between the simulations and our parametrization will become even smaller, particularly at the high mass end of galaxy range where
baryons dominate. By contrast, large differences can be seen between the
rotation curves from dark matter only simulations (green dotted-dashed)
and the rotation curves from the baryonic run (solid black) with the largest
differences, as much as 50 per cent, being in intermediate mass galaxies.
Such differences highlighting the error one would commit by modeling rotation curves of real galaxies using prediction from N-body simulations,
with a NFW profile unmodified by baryonic processes. As opposite, our
halo model introduces an error in the evaluation of galaxies’ rotation curves
which is well within observational errors, and can therefore safely be applied
to model dark matter haloes within real galaxies.
9.3.5
Constraining the concentration parameter
Now that we have demonstrated the precision of our density profile based
on the stellar-to-halo mass ratio as in Eq. (9.3), we examine how one of the
free parameters, the scale radius rs , varies as a function of integrated star
157
9.3. RESULTS
Figure 9.3: Circular
velocity curves of dark matter within the galaxies used in this
p
work, Vc (r) = GM (r)/r. The dark matter rotation curve from the SPH run is
shown as solid black line, while our parametrized model as red dashed line. The
small insert within each plot shows a zoom-in of the region within 0.1Rvir , with
the addition of the rotation curve from dark matter only run as dotted-dashed
green line. The Vc of each galaxy is normalized to its maximum values Vmax , and
158
plotted in units of Rvir .
CHAPTER 9. INFLUENCE OF GALAXY FORMATION ON DARK
MATTER HALOES: A MASS DEPENDENT DENSITY PROFILE
Figure 9.4: Ratio between concentration parameter c = Rvir /r−2 in the SPH run
and dark matter only run for our set of galaxies, as a function of M? /Mhalo . The
upper x-axis shows the corresponding Mhalo /M? as a reference to the mass to
light ratio. cDM has been derived fitting a NFW profile to the dark matter only
version of each galaxy, while cSPH has been computed applying our model profile
to the dark matter halo of the galaxies in the hydrodynamical run, and converting
the corresponding rs into r−2 . The dashed red line represent the best model for
the cSPH /cDM values.
forming efficiency, so that it could be implemented in semi-analytic models
of galaxy formation. The concentration parameter of our hydrodynamically
simulated galaxies does not always behave the same as in a corresponding
dark matter only run.
First, as α, β and γ vary, the definition of rs changes. For consistency,
Eq. (9.2) defines a conversion from rs to r−2 , the radius at which the logarithmic slope of the profile equals −2. We define cSPH ≡ Rvir /r−2 as the
concentration from the hydrodynamical simulation, and compare it with
cDM , the NFW concentration from the dark matter only simulation.
Fig. 9.4 shows the ratio between the concentration parameter in the
hydrodynamical simulation and the dark matter only one, and how this
ratio varies as a function of M? /Mhalo . Each simulation is represented by
its symbol and size as described in Table 1. The dependence of cSPH /cDM
on M? /Mhalo is nearly exponential. The best fit is:
cSPH /cDM = 1.0 + 0.00003e3.4X
where X = log10 (M? /Mhalo ) + 4.5.
159
(9.6)
9.4. CONCLUSIONS
Up to a mass ratio of log10 (M? /Mhalo ) ∼ −1.5 (which corresponds to a
halo mass of 1012 M ), cSPH is essentially the same as cDM . Thus, despite of
the variation of the inner slope, the transition to the outer slope happens
at the same radius r−2 as in the dark matter only simulation.
Above log10 (M? /Mhalo ) ∼ −1.5, instead, the difference is striking and
the haloes become much more concentrated in the SPH case than the corresponding DM only run. In galaxies about the mass of the Milky Way,
the inner region of the dark matter halo becomes smaller in our model, a
signature of adiabatic contraction. Indeed, as shown already in Di Cintio et
al. (2014b), the increasing amount of stars at the centre of high mass spirals opposes the flattening effect of gas outflows generating instead a profile
which is increasingly cuspy and more concentrated. Collisionless simulations in a WMAP3 cosmology find that the typical concentration of a 1012
M halo [log10 (M? /Mhalo ) = −1.5] is c ≈ 8.5 (Maccio’ et al. 2008); in our
model with effective stellar feedback, the inner region of the halo shrinks by
a factor of ∼ 2, giving a concentration parameter cSPH that can be 2.0 − 2.5
times higher than the original N-body prediction.
Observations of the Milky Way are best fit with an NFW halo with high
concentration parameter c ≈ 18 − 20 (Battaglia et al. 2005; Catena & Ullio
2010; Deason et al. 2012a; Nesti & Salucci 2013). The data include halo
tracers like globular clusters, satellite galaxies, and dynamical observables
like blue horizontal branch stars, red giant stars and maser star forming
regions used to constrain the Galactic potential. While such a high value
of the concentration c is at odds with respect to N-body predictions, our
study suggests that the mismatch could be related to the effect of infalling
baryons, and that a value of c compatible with the above mentioned works
it is indeed expected once such effect is properly taken into account in
simulations. Finally, a high concentration could arise possible tensions with
the Tully-Fisher relation (Dutton et al. 2011) and the Fundamental Plane
(Dutton et al. 2013) for high mass spirals, but this issue has to be explored
in more detail once other effects relevant at L∗ scales, such as feedback from
AGN, will be included in the simulations.
9.4
Conclusions
It is well established that baryons affect dark matter density profiles
of haloes in galaxies (e.g. Blumenthal et al. 1986; Navarro et al. 1996a;
El-Zant et al. 2001; Gnedin et al. 2004; Read & Gilmore 2005; Goerdt et
al. 2006; Read et al. 2006; Mashchenko et al. 2006; Tonini et al. 2006;
Romano-Dı́az et al. 2008; Del Popolo 2009; Governato et al. 2010; Goerdt
et al. 2010; Di Cintio et al. 2011; Zolotov et al. 2012; Governato et al.
160
CHAPTER 9. INFLUENCE OF GALAXY FORMATION ON DARK
MATTER HALOES: A MASS DEPENDENT DENSITY PROFILE
2012; Macciò et al. 2012; Martizzi et al. 2013; Teyssier et al. 2013). Simple
arguments compare the energy available from star formation with the depth
of a galactic potential to estimate the degree of the change in the initial dark
matter distribution (Peñarrubia et al. 2012; Pontzen & Governato 2012,
2014).
This study describes the dark matter profiles of haloes from a suite
of hydrodynamical cosmological galaxy formation simulations that include
the effects of stellar feedback. The profiles are modeled using a generic
double power law function. We find that the slope parameters of such model
(α, β, γ) vary in a systematic manner as a function of the ratio between
M? /Mhalo , which we call integrated star formation efficiency. Using these
fits allows us to propose a star formation efficiency dependent density profile
for dark matter haloes that can be used for modeling observed galaxies and
in semi-analytic models of galaxy formation.
The star formation efficiency dependent density profile has the form of
a double power-law, with inner slope (γ), outer slope (β) and sharpness of
transition (α) fully determined by the stellar to halo mass ratio as given
in Eq. 9.3. Thus, the five free parameters of the generic model reduce to
two, the scale radius rs and scale density ρs , the same free parameters of
the commonly used NFW model.
To examine how the scale radii varies as a function of integrated star
formation efficiency, we compare the concentration parameter, c = Rvir /r−2 ,
of the dark matter haloes from galaxies simulated with hydrodynamics prescriptions to those from the corresponding dark matter only simulations.
For masses below roughly the Milky Way’s the concentrations are similar,
indicating that while the profiles may be significantly different from NFW,
particularly in terms of inner slope, the radius at which the logarithmic
slope of the profile equals -2 is the same as in the NFW model, indicating
no net halo response at scales near the scale radius.
However, for Milky Way mass galaxies the haloes from the hydro runs
become as much as two times more concentrated than in the pure dark
matter runs. Such high concentrations are consistent to what has been
derived from observations of Milky Way’s dynamical tracers (Battaglia et
al. 2005; Catena & Ullio 2010; Deason et al. 2012a; Nesti & Salucci 2013).
Thus, specifying the halo or stellar mass for a galaxy is sufficient to
completely describe the shape of dark matter profiles for galaxies ranging
in mass from dwarfs to L∗ , based on the influence of stellar feedback. Importantly, the simulations we utilize in determining these profiles match a
wide range of scaling relations Brook et al. (2012b), meaning that their
radial mass distributions are well constrained.
161
9.4. CONCLUSIONS
The main features of the mass dependent dark matter profile are:
• Baryons affect the profile shape parameters. For galaxies with flat
inner profiles γ the sharpness of transition parameter, α, increases
from 1 to 3 and corresponds to a small decrease in the slope of the
outer profile β.
<
• At low integrated star formation efficiencies, M? /Mhalo ∼
10−4 (galax<
ies with M? ∼
5x10⁶ M ), dark matter haloes maintain the usual NFW
profile as in dark matter only simulations.
• At higher efficiencies the profile becomes progressively flatter. The
most cored galaxies are found at M? /Mhalo ≈ 3 − 5 × 10⁻³ or M?
∼108.5 M .
−3
8.5
• Galaxies with M? /Mhalo >
∼ 5 × 10 (M? >
∼ 10 M ), become progressively steeper in the inner region as their mass increases.
• The parameters (α, β, γ) returns to the NFW values of (1,3,1) for L∗
galaxies.
• However such L∗ galaxies, and more in general galaxies with M? /Mhalo >
∼
0.03, are up to a factor of 2.5 more concentrated than the corresponding dark matter only simulations.
In an Appendix we show step-by-step how to derive the dark matter
profile for any galaxy mass.
Our results show that baryonic effects substantially change the structure
of cold dark matter haloes from those predicted from dissipationless simulations, and therefore must be taken into account in any model of galaxy
formation.
Of course, our model uses a particular feedback implementation, namely
thermal feedback in the form of blast-wave formalism. Yet Teyssier et al.
(2013) finds a similar degree of core creation, at least in low mass galaxies, using a different feedback scheme. Both studies are based on the same
mechanisms for core creation, i.e. rapid and repeated outflows of gas which
result in changes in the potential. Indeed, the simulations closely follow the
analytic model of core creation presented in Pontzen & Governato (2012),
indicating that the precise details of the feedback implementation are not
central to our results, at least not in a qualitative manner. Galaxy formation models which do not include impulsive supernova explosions driving
outflows from the central regions will not form cores in this manner.
162
CHAPTER 9. INFLUENCE OF GALAXY FORMATION ON DARK
MATTER HALOES: A MASS DEPENDENT DENSITY PROFILE
In a forthcoming study we will present a comprehensive comparison of
our predicted density profile with the inferred mass distribution of observed
galaxies, with particular emphasis on Local Group members.
9.5
Recipe to derive a mass dependent density profile
We summarize here the steps necessary to derive, for a given halo mass,
the corresponding dark matter profile which takes into account the effects
of baryons:
• Input the halo mass Mhalo and the stellar mass M? of a galaxy. In case
that only one of these two quantities is known, use the abundance
matching relation (Brook et al. 2014; Moster et al. 2013; Guo et al.
2011) to derive the second one.
• Specify an overdensity criterion, such that the halo mass is defined as
the mass contained within a sphere of radius Rvir containing ∆ times
the critical density of the Universe ρcrit = 3H 2 /8πG:
4 3
Mhalo = πRvir
∆ρcrit
3
(9.7)
Common choices of ∆ are ∆200 = 200 or ∆vir = 18π 2 + 82x − 39x2
with x = Ωm − 1 at z = 0 (Bryan & Norman 1998). In a WMAP3
cosmology ∆vir = 92.8.
• Compute the halo profile parameters (α, β, γ) as a function of integrated star formation efficiency M? /Mhalo using Eq. (9.3). Recall that
the range of validity of Eq. (9.3) is −4.1 < log10 (M? /Mhalo ) < −1.3: at
lower efficiencies the (α, β, γ) value returns to the usual (1,3,1), NFW
prediction.
• Obtain the concentration parameter cSPH = Rvir /r−2 via Eq. (9.6),
where the quantity cDM is the typical concentration of a halo of mass
Mhalo coming from N-body simulations (Dutton & Macciò 2014; Maccio’ et al. 2008). In this way we have derived the r−2 at which the
logarithmic slope of the profile equals -2.
• Convert such r−2 into the corresponding scale radius rs using Eq. (9.2).
This is the scale radius that enters into Eq. (9.1).
• Find the scale density ρs by imposing the normalization M (< Rvir ) =
Mhalo :
163
9.5. RECIPE TO DERIVE A MASS DEPENDENT DENSITY PROFILE
Z
ρs = Mhalo /4π
0
Rvir
γ h
r
1+
rs
r2
α i(β−γ)/α dr
(9.8)
r
rs
• The mass dependent density profile can now be obtainedpthrough
Eq. (9.1) and the corresponding circular velocity via Vc (r) = GM (r)/r.
• In case of fitting observed rotation curves of galaxies the scale radius
rs and scale density ρs should be left as the two free parameters of the
model.
164
Chapter 10
Conclusion
In this thesis I explored the Lambda Cold Dark Matter (ΛCDM) small
scales problems using two different sets of cosmological simulations of galaxy
formation, namely the CLUES (Gottlöber et al. 2010) and the MaGICC ones
(Stinson et al. 2013; Brook et al. 2012b). The current cosmological paradigm
states that galaxies form within dark matter haloes (White & Rees 1978), in
a process highly non linear that can be modeled by using numerical recipes
(Springel 2005). As far as the dynamic of the process concerns the large scale
structures in the Universe, such as filaments, voids and cluster of galaxies,
the only relevant force that drives the evolution of these structures is the
gravitational one, and the numerical simulations can be performed simply
assuming that collisionless dark matter particles interact through this force.
N-body simulation like the Millenium-XXL (Angulo et al. 2012), the Bolshoi
(Klypin et al. 2010) and the Multidark run (Riebe et al. 2013) have provided
a satisfactory description of the large scale of the Universe when compared
to the observed distribution of galaxies (Cross et al. 2001). At smaller,
galactic scales, however, the situation is more complicated due to the fact
that visible matter undergoes dissipative dynamic processes when clumps
into galaxies and stars. A series of problem associated with the formation
and evolution of galactic and sub-galactic structures has been identified in
the past decade as a possible failure of the ΛCDM paradigm.
In this thesis I reviewed such problems and offered possible solutions and
explanations to them. In particular, I focused on the too big to fail (TBTF)
problem (Boylan-Kolchin et al. 2011) and on the cusp/core crisis (de Blok
2010).
The too big to fail problem is the discrepancy between the observed kinematic of dwarf spheroidal galaxies around the Milky Way and Andromeda
and the kinematic of the most massive subhaloes found in dark matter
only simulations, the latter being more dense than what expected from the
165
measured stellar velocity dispersion of dSPhs (Walker et al. 2007).
I studied this issue by means of constrained cosmological simulations of
the Local Group which also include the baryonic physics processes relevant
in galaxy formation. These simulations are designed in order to constrain
the observed structures at scale larger than few Mpc, while smaller scales
are essentially random, therefore reproducing the evolution and formation
of the Local Group of galaxies within the correct environment. I showed
that the subhaloes lying within the virial radius of the simulated analogues
of the Milky Way and Andromeda are affected by baryonic physics (Knebe
et al. 2010; Di Cintio et al. 2011). Most of them will form too many stars
and will undergo through an adiabatic contraction of their haloes, giving
an even worse picture when compared to the observed dSPhs’ kinematic;
only a few of the subhaloes found in the baryonic (SPH) run of CLUES will
experience a decreasing in their central density, possibly due to outflows of
gas from their center, bringing them in agreement with observations.
In both cases, the density profile of the simulated subhaloes seem to be
better described by an Einasto model (Einasto 1965) rather than the usual
NFW (Navarro et al. 1996b), particularly since the subhaloes will experience tidal stripping, which acts at modifying their outer region (Hayashi
et al. 2003), once they enter into the main halo of their hosts. I applied
the Einasto model to the CLUES subhaloes and I showed that the TBTF
problem can be alleviated if one uses this profile allowing for a variation
of the shape parameter nEin (Di Cintio et al. 2013). I found a correlation
between such shape parameter and the subhaloes mass, with the biggest
subhaloes having a shape parameter as high as nEin = 10, which means
that their inner slope is steeper than a NFW model, thus indicating adiabatic contraction, while the smallest subhaloes have on average a shape
parameter less than nEin = 4, which is the typical value of dark matter
haloes in N-body simulations. This means that the smallest subhaloes have
strongly been affected by tides in their outer regions, and some of them
have even lost all their gas, further lowering their central density.
In the light of these findings I concluded that using a universal density profile to describe the dark matter haloes of observed dwarf spheroidal
galaxies is inconsistent, since both internal (baryonic) and external (tidal
stripping) processes can modify the subhaloes density profiles. Asides from
the most appropriate density profile to be used, however, the CLUES simulations still produce satellites which are brighter than the most luminous
dSphs observed. Unless one accounts for some statistical fluke, this problem has still to be solved, most likely by the inclusion, in the simulations,
of proper feedback processes.
The number of satellite galaxies found in numerical simulations within
166
CHAPTER 10. CONCLUSION
the virial radius of their host halo is strongly dependent on the host halo
mass itself (Wang et al. 2012). Therefore, given the importance of correctly
evaluating the mass of the Milky Way galaxy in order to reproduce the
observed count and luminosities of its satellite population, I focused on
the description of a mass estimator method, based upon dynamical tracers,
to calculate such mass (Watkins et al. 2010). I showed that this mass
estimator can be safely applied even in the case of Local Group galaxies, in
which the two main hosts are near by, possibly influencing each other. The
only caveat is to take care in including only dynamical tracers, like globular
clusters, halo stars or satellite galaxies, which are actually bound to the
considered host: disregarding for this will cause a notable error in the final
mass estimation (Di Cintio et al. 2012).
Finally, I explored the TBTF problem using warm dark matter (WDM)
simulations of the Local Group, with a dark matter particle mass of 1
keV (Libeskind et al. 2013). While these simulations strongly suppress
the counts of subhaloes within the two main galaxies, due to the lack of
power at small scales, the result it is actually still affected by the fact that
the biggest subhaloes will form too many stars. Moreover, a 1 keV particle does not produce enough bright subhaloes, in the SPH run, to account
for all the observed classical dwarf spheroidals of the Milky Way. Recent
constraint on warm dark matter particle mass put the limit at mwdm >
3.3 keV (Viel et al. 2013): with such a high mass, the WDM scenario does
as bad as the CDM one in solving the small scales problems (Schneider et
al. 2014). I further explored the differences between the Local Group of
galaxies formed in WDM vs CDM. In WDM, due to the delayed formation
and collapse of haloes (Bode et al. 2001; Knebe et al. 2008), the resulting
Local Group is more diffuse and still expanding, while in the corresponding
CDM the Milky Way and Andromeda galaxies are approaching each other,
in agreement with observations. I also showed that, reflecting the formation
epoch of haloes and the mass accretion history, WDM haloes have a lower
baryon fractions in their inner parts than CDM haloes.
Moreover, I discussed how it is possible to use the simulations of a Local Group to put further constraint on the stellar-to-halo mass relations of
galaxies, down to the luminosities of the faintest dwarfs observed (Brook
et al. 2014). While this technique has been used extensively to derive an
abundance-matching of galaxies down to an halo mass of Mhalo = 1010.8 M
(Moster et al. 2010; Guo et al. 2010), with our Local Group simulations
we have been able to to extrapolate the relation down to Mhalo ∼ 109.8 M ,
by using the CLUES halo mass function and by matching it to the observed stellar mass function in the Local Group, which is complete to
M? ∼ 106.5 M . This finding shows that the vast majority of the galaxies in the Local Group, regardless of whether they are satellites or isolated,
167
are predicted to be housed in haloes whose mass exceeds 1010 M , in contrast with dynamical measurements of dSphs, which would assign most of
these galaxies to a halo of smaller mass. Such assignment assumes, however,
that their dark matter halo follows the density profile derived from N-body
simulations, the commonly used NFW model.
They way out of this discrepancy may reside in baryonic processes that
are neglected when using collisionless simulations to make predictions about
observed dwarf galaxies. To reconcile observational data with our abundancematching prediction one has to assume that some of these galaxies have a
central dark matter core, i.e. their halo is expanded.
I explored extensively what are the main mechanisms able to cause an
expanded dark matter halo in galaxies, by using hydrodynamical simulations of galaxies from the MaGICC project (Stinson et al. 2013). These
galaxies, which spam a wide range in mass, are simulated using feedback
from supernovae as well as from young massive stars, in terms of thermal
energy. It has been shown that including both sources of feedback it is necessary in order to produce galaxies with the correct amount of stars per halo
mass and that match the observed scaling relations (Brook et al. 2012b).
I showed that supernovae driven gas outflows are able to create a flat,
cored central density in an initially NFW halo, as a result of the dark matter
response to the impulsive variations of the gravitational potential (Pontzen
& Governato 2012). This mechanism is dependent on the amount of energy
per halo mass, such that the flattening process can be directly related to the
M? /Mhalo ratio within each galaxy (Di Cintio et al. 2014b). This process
has a peak of efficiency at M? /Mhalo ∼ 0.39%, while for higher and lower
ratios the profile is cuspy again. At lower ratio the profile is NFW because
there is not enough energy from supernovae in order to lead a modification
in the dark matter distribution; at higher masses, instead, the supernovae
energy is not strong enough to win the deepened potential well caused by
the increasing amount of stars.
This finding allows to make predictions for the cusp/core transformation
−1
in galaxies, with the cored-most galaxies expected at 30 <
∼ Vcirc /kms <
∼ 70,
in agreement with observations of disc and low surface brightness galaxies (Kuzio de Naray et al. 2008a; de Blok et al. 2008; Oh et al. 2011a).
More massive galaxies are predicted to be cuspy, also in agreement with observations although with a greater uncertainty due to the higher baryonic
contribution to the total rotation curve. In our model, some of the satellite galaxies in the Local Group are expected to live within an expanded
halo, while some others will retain a cuspy, NFW halo, depending on their
stellar-to-halo mass ratio. The evidence for a mixed population of cored
and cuspy satellite galaxies within the Local Group is strongly supported
168
CHAPTER 10. CONCLUSION
by observations (Walker & Peñarrubia 2011; Wolf & Bullock 2012).
The cusp/core crisis, therefore, seems to be solved once one takes into
account the relevant processes occurring during the formation of a galaxy.
Of course, it would be invaluable to confirm our results using a different
feedback scheme and simulation code, although recent studies are going
into our same direction (Teyssier et al. 2013).
I further introduced a full density profile able to describe the distribution
of dark matter in galaxies, which takes into account the stellar-to-halo mass
dependence of the response of dark matter to baryonic processes (Di Cintio
et al. 2014a). The main parameters of this profile, like inner and outer
slope and concentration parameter, can be fully constrained via the quantity
M? /Mhalo , reducing the number of free parameters of the model. Knowing
the halo or the stellar mass of a galaxy is sufficient to describe the dark
matter halo profile including the effects of baryons. I showed that the
concentration of the haloes in the hydrodynamical simulations is consistent
with N-body expectations up to Milky Way mass galaxies, at which mass
the haloes become twice as concentrated as compared with pure dark matter
runs, in agreement with recent studies (Nesti & Salucci 2013).
These results suggest that the proposed mass dependent density profile is more adequate than the commonly used NFW one in describing real
galaxies, and it can be directly applied to rotation curve data of observed
galaxies and to mass modeling of their inner profile.
I showed in this thesis how the main problems of ΛCDM at small scales
are connected to each other, the “too big to fail” problem being possibly
solved once we understand how and why the “cusp/core” transformation
happens in galaxies. According to the common NFW profile, the brightest
satellite galaxies of the Milky Way would be placed within haloes of about
Mhalo ∼ 109 M , leaving dark the biggest subhaloes of Mhalo ∼ 1010 M and
highlighting a disagreement with abundance matching predictions. Rather
than a failure of the ΛCDM paradigm at small scales, this issue has to be
seen as a proof of the importance of baryonic mechanisms at such scales,
and as an evidence for halo expansion within the most luminous dSphs in
our galaxy. Expanded, cored haloes, as well as cuspy ones, can be satisfactorily described by means of the mass dependent density profile introduced
in this thesis.
169
Future directions of this research include a complete analysis and comparison of our cusp/core prediction with the Local Group galaxies, by applying our mass dependent density profile to their observed velocity dispersions. The goal is to infer the mass distribution of the entire population of
the Local Group members, highlighting the connection between abundance
matching at these scales and the need for a cusp/core transformation.
The prediction for cusp vs core formation can also be applied to the observed rotation curves of galaxies in order to put constraint on the baryonic
contribution to their circular velocities.
Running new simulation within the CLUES project using the updated
feedback recipe of the MaGICC galaxies, moreover, will allow to explore the
Local Group formation within an effective feedback scenario. Several studies
can be performed, like understanding what are the physical processes that
cause different star formation histories within the observed dwarf spheroidal
galaxies and what drives the scatter in the abundance matching relation at
very small galaxy masses.
The newly introduced mass dependent density profile can be further used
to make comparisons with galaxies in a broad range of masses: in particular
the observed abundances and velocities of galaxies within a certain volume
can be compared with the theoretical velocity function derived by using our
profile.
Finally, it would be imperative to implement such a mass-dependent
density profile into semi-analytic models of galaxy formation. The ultimate
goal is to start using this density profile as a significant improvement over
the NFW model predicted form N-body simulations.
170
Bibliography
Agertz, O., Moore, B., Stadel, J., et al. 2007, MNRAS, 380, 963
An, J., Evans, N. W., & Deason, A. J. 2012, MNRAS, 420, 2562
Angulo, R. E., Springel, V., White, S. D. M., et al. 2012, MNRAS, 426,
2046
Arraki, K. S., Klypin, A., More, S., & Trujillo-Gomez, S. 2014, MNRAS,
438, 1466
Avila-Reese, V., Colı́n, P., Valenzuela, O., D’Onghia, E., & Firmani, C.
2001, ApJ, 559, 516
Bahcall, J. N. & Tremaine, S. 1981, ApJ, 244, 805
Baldry, I. K., Driver, S. P., Loveday, J., et al. 2012, MNRAS, 421, 621
Baldry, I. K., Glazebrook, K., & Driver, S. P. 2008, MNRAS, 388, 945
Banerjee, A. & Jog, C. J. 2008, ApJ, 685, 254
Battaglia, G., Helmi, A., Morrison, H., et al. 2005, MNRAS, 364, 433
Behroozi, P. S., Wechsler, R. H., & Conroy, C. 2013, ApJ, 770, 57
Bekki, K. 2008, ApJ, 684, L87
Belokurov, V., Walker, M. G., Evans, N. W., et al. 2008, ApJ, 686, L83
Belokurov, V., Walker, M. G., Evans, N. W., et al. 2009, MNRAS, 397,
1748
Benson, A. 2011, Galacticus: A Semi-Analytic Model of Galaxy Formation,
astrophysics Source Code Library
Benson, A. J., Bower, R. G., Frenk, C. S., et al. 2003, ApJ, 599, 38
Benson, A. J., Frenk, C. S., Lacey, C. G., Baugh, C. M., & Cole, S. 2002,
MNRAS, 333, 177
171
BIBLIOGRAPHY
Binney, J. & Tremaine, S. 1987, Galactic dynamics (Princeton, NJ, Princeton University Press, 1987, 747 p.)
Blumenthal, G. R., Faber, S. M., Flores, R., & Primack, J. R. 1986, ApJ,
301, 27
Blumenthal, G. R., Faber, S. M., Primack, J. R., & Rees, M. J. 1984,
Nature, 311, 517
Bode, P., Ostriker, J. P., & Turok, N. 2001, ApJ, 556, 93
Borriello, A. & Salucci, P. 2001, MNRAS, 323, 285
Bovill, M. S. & Ricotti, M. 2011a, ApJ, 741, 17
Bovill, M. S. & Ricotti, M. 2011b, ApJ, 741, 18
Boylan-Kolchin, M., Bullock, J. S., & Kaplinghat, M. 2011, MNRAS, 415,
L40
Boylan-Kolchin, M., Bullock, J. S., & Kaplinghat, M. 2012, MNRAS, 422,
1203
Boylan-Kolchin, M., Springel, V., White, S. D. M., & Jenkins, A. 2010,
MNRAS, 406, 896
Brook, C. B., Di Cintio, A., Knebe, A., et al. 2014, ApJ, 784, L14
Brook, C. B., Governato, F., Roškar, R., et al. 2011, MNRAS, 595
Brook, C. B., Miranda, M. S., Gibson, B. K., Pilkington, K., & Stinson,
G. S. 2013a, PASA, 30, 42
Brook, C. B., Stinson, G., Gibson, B. K., et al. 2012a, MNRAS, 419, 771
Brook, C. B., Stinson, G., Gibson, B. K., et al. 2013b, ArXiv e-prints
Brook, C. B., Stinson, G., Gibson, B. K., Wadsley, J., & Quinn, T. 2012b,
MNRAS, 424, 1275
Brooks, A. M., Kuhlen, M., Zolotov, A., & Hooper, D. 2013, ApJ, 765, 22
Bryan, G. L. & Norman, M. L. 1998, ApJ, 495, 80
Bullock, J. S. 2010, ArXiv e-prints
Bullock, J. S., Kolatt, T. S., Sigad, Y., et al. 2001, MNRAS, 321, 559
Bullock, J. S., Kravtsov, A. V., & Weinberg, D. H. 2000, ApJ, 539, 517
172
BIBLIOGRAPHY
Catena, R. & Ullio, P. 2010, Journal of Cosmology and Astro-Particle
Physics, 8, 4
Chabrier, G. 2003, ApJL, 586, L133
Chemin, L., de Blok, W. J. G., & Mamon, G. A. 2011, AJ, 142, 109
Chevalier, R. A. 1974, ApJ, 188, 501
Clowe, D., Bradač, M., Gonzalez, A. H., et al. 2006, ApJ, 648, L109
Cole, D. R., Dehnen, W., & Wilkinson, M. I. 2011, MNRAS, 416, 1118
Cole, S. & et al. 2005, MNRAS, 362, 505
Collins, M. L. M., Chapman, S. C., Rich, R. M., et al. 2014, ApJ, 783, 7
Courteau, S., Dutton, A. A., van den Bosch, F. C., et al. 2007, ApJ, 671,
203
Courteau, S. & Rix, H.-W. 1999, ApJ, 513, 561
Crain, R. A., Theuns, T., Dalla Vecchia, C., et al. 2009, MNRAS, 399, 1773
Cross, N., Driver, S. P., Couch, W., et al. 2001, MNRAS, 324, 825
Davis, M., Efstathiou, G., Frenk, C. S., & White, S. D. M. 1985, ApJ, 292,
371
Dayal, P. & Libeskind, N. I. 2012, MNRAS, 419, L9
de Blok, W. J. G. 2010, Advances in Astronomy, 2010
de Blok, W. J. G., Bosma, A., & McGaugh, S. 2003, MNRAS, 340, 657
de Blok, W. J. G., McGaugh, S. S., Bosma, A., & Rubin, V. C. 2001, ApJ,
552, L23
de Blok, W. J. G., Walter, F., Brinks, E., et al. 2008, AJ, 136, 2648
Deason, A. J., Belokurov, V., Evans, N. W., & An, J. 2012a, MNRAS, 424,
L44
Deason, A. J., Belokurov, V., Evans, N. W., et al. 2012b, MNRAS, 425,
2840
Deason, A. J., McCarthy, I. G., Font, A. S., et al. 2011, MNRAS, 415, 2607
Dekel, A. & Silk, J. 1986, ApJ, 303, 39
Del Popolo, A. 2009, ApJ, 698, 2093
173
BIBLIOGRAPHY
Del Popolo, A. 2010, MNRAS, 408, 1808
Del Popolo, A. & Cardone, V. F. 2012, MNRAS, 423, 1060
Devriendt, J. E. G., Guiderdoni, B., & Sadat, R. 1999, A&A, 350, 381
Di Cintio, A., Brook, C. B., Dutton, A. A., et al. 2014a, MNRAS, 441, 2986
Di Cintio, A., Brook, C. B., Macciò, A. V., et al. 2014b, MNRAS, 437, 415
Di Cintio, A., Knebe, A., Libeskind, N. I., et al. 2013, MNRAS, 431, 1220
Di Cintio, A., Knebe, A., Libeskind, N. I., et al. 2012, MNRAS, 423, 1883
Di Cintio, A., Knebe, A., Libeskind, N. I., et al. 2011, MNRAS, 417, L74
Diemand, J., Kuhlen, M., & Madau, P. 2007, ApJ, 657, 262
Diemand, J., Kuhlen, M., Madau, P., et al. 2008, Nature, 454, 735
Domı́nguez-Tenreiro, R., Obreja, A., Granato, G. L., et al. 2014, MNRAS,
439, 3868
Donato, F., Gentile, G., & Salucci, P. 2004, MNRAS, 353, L17
Duffy, A. R., Schaye, J., Kay, S. T., et al. 2010, MNRAS, 405, 2161
Dunkley, J., Komatsu, E., Nolta, M. R., et al. 2009, ApJS, 180, 306
Dutton, A. A., Conroy, C., van den Bosch, F. C., Prada, F., & More, S.
2010, MNRAS, 407, 2
Dutton, A. A., Conroy, C., van den Bosch, F. C., et al. 2011, MNRAS, 416,
322
Dutton, A. A. & Macciò, A. V. 2014, ArXiv e-prints,1402.7073
Dutton, A. A., Macciò, A. V., Mendel, J. T., & Simard, L. 2013, MNRAS,
432, 2496
Dutton, A. A., van den Bosch, F. C., Dekel, A., & Courteau, S. 2007, ApJ,
654, 27
Einasto, J. 1965, Trudy Inst. Astrofiz. Alma-Ata, 51, 87
El-Zant, A., Shlosman, I., & Hoffman, Y. 2001, ApJ, 560, 636
Evans, N. W., An, J., & Deason, A. J. 2011, ApJ, 730, L26+
Ferrero, I., Abadi, M. G., Navarro, J. F., Sales, L. V., & Gurovich, S. 2012,
MNRAS, 425, 2817
174
BIBLIOGRAPHY
Forero-Romero, J. E., Hoffman, Y., Yepes, G., et al. 2011, MNRAS, 417,
1434
Freyer, T., Hensler, G., & Yorke, H. W. 2006, ApJ, 638, 262
Gao, L., Navarro, J. F., Cole, S., et al. 2008, MNRAS, 387, 536
Garrison-Kimmel, S., Boylan-Kolchin, M., Bullock, J. S., & Kirby, E. N.
2014, ArXiv e-prints
Garrison-Kimmel, S., Rocha, M., Boylan-Kolchin, M., Bullock, J. S., &
Lally, J. 2013, MNRAS, 433, 3539
Gill, S. P. D., Knebe, A., & Gibson, B. K. 2004a, MNRAS, 351, 399
Gill, S. P. D., Knebe, A., Gibson, B. K., & Dopita, M. A. 2004b, MNRAS,
351, 410
Gnedin, O. Y., Kravtsov, A. V., Klypin, A. A., & Nagai, D. 2004, ApJ, 616,
16
Goerdt, T., Moore, B., Read, J. I., & Stadel, J. 2010, ApJ, 725, 1707
Goerdt, T., Moore, B., Read, J. I., Stadel, J., & Zemp, M. 2006, MNRAS,
368, 1073
Gottlöber, S., Hoffman, Y., & Yepes, G. 2010, in High Performance Computing in Science and Engineering, ed. S. Wagner, M. Steinmetz, A. Bode,
M.M. Müller, Springer, 309–323
Governato, F., Brook, C., Mayer, L., et al. 2010, Nature, 463, 203
Governato, F., Zolotov, A., Pontzen, A., et al. 2012, MNRAS, 422, 1231
Graham, A. W., Merritt, D., Moore, B., Diemand, J., & Terzić, B. 2006a,
AJ, 132, 2701
Graham, A. W., Merritt, D., Moore, B., Diemand, J., & Terzić, B. 2006b,
AJ, 132, 2711
Guo, Q., Cole, S., Eke, V., & Frenk, C. 2011, MNRAS, 417, 370
Guo, Q., White, S., Li, C., & Boylan-Kolchin, M. 2010, MNRAS, 404, 1111
Haardt, F. & Madau, P. 1996, ApJ, 461, 20
Hayashi, E., Navarro, J. F., Taylor, J. E., Stadel, J., & Quinn, T. 2003,
ApJ, 584, 541
Hayashi, E. & White, S. D. M. 2008, MNRAS, 388, 2
175
BIBLIOGRAPHY
Hernquist, L. 1990, ApJ, 356, 359
Herpich, J., Stinson, G. S., Macciò, A. V., et al. 2014, MNRAS, 437, 293
Hinshaw, G., Larson, D., Komatsu, E., et al. 2013, ApJS, 208, 19
Hoekstra, H., Yee, H. K. C., & Gladders, M. D. 2004, ApJ, 606, 67
Hoffman, Y. & Ribak, E. 1991, ApJ, 380, L5
Hopkins, P. F., Quataert, E., & Murray, N. 2011, ArXiv e-prints
Hudson, M. J., Gillis, B. R., Coupon, J., et al. 2013, ArXiv e-prints
Ibata, R., Martin, N. F., Irwin, M., et al. 2007, ApJ, 671, 1591
Jaffe, W. 1983, MNRAS, 202, 995
Jarosik, N. & et al. 2011, ApJS, 192, 14
Jenkins, A., Frenk, C. S., White, S. D. M., et al. 2001, MNRAS, 321, 372
Kahn, F. D. & Woltjer, L. 1959, ApJ, 130, 705
Kannan, R., Macciò, A. V., Pasquali, A., Moster, B. P., & Walter, F. 2012,
ApJ, 746, 10
Kannan, R., Stinson, G. S., Macciò, A. V., et al. 2013, arXiv.1302.2618
Karachentsev, I. D., Karachentseva, V. E., Huchtmeier, W. K., & Makarov,
D. I. 2004, AJ, 127, 2031
Karachentsev, I. D. & Kashibadze, O. G. 2006, Astrophysics, 49, 3
Katz, N. 1992, ApJ, 391, 502
Kay, S. T., Pearce, F. R., Frenk, C. S., & Jenkins, A. 2002, MNRAS, 330,
113
Kazantzidis, S., Mayer, L., Mastropietro, C., et al. 2004, ApJ, 608, 663
Keller, S. C., Mackey, D., & Da Costa, G. S. 2012, ApJ, 744, 57
Keller, S. C., Schmidt, B. P., Bessell, M. S., et al. 2007, PASA, 24, 1
Kendall, M. & Gibbons, J. D. 1990, Rank Correlation Methods, 5th edn.
(A Charles Griffin Title)
Kennicutt, Jr., R. C. 1998, in Astronomical Society of the Pacific Conference
Series, Vol. 142, The Stellar Initial Mass Function (38th Herstmonceux
Conference), ed. G. Gilmore & D. Howell, 1–+
176
BIBLIOGRAPHY
Kirby, E. N., Cohen, J. G., Guhathakurta, P., et al. 2013, ArXiv e-prints
Klypin, A., Gottlöber, S., Kravtsov, A. V., & Khokhlov, A. M. 1999a, ApJ,
516, 530
Klypin, A., Hoffman, Y., Kravtsov, A. V., & Gottlöber, S. 2003, ApJ, 596,
19
Klypin, A., Kravtsov, A. V., Valenzuela, O., & Prada, F. 1999b, ApJ, 522,
82
Klypin, A., Trujillo-Gomez, S., & Primack, J. 2010, ArXiv e-prints
Knebe, A., Arnold, B., Power, C., & Gibson, B. K. 2008, MNRAS, 386,
1029
Knebe, A., Devriendt, J. E. G., Mahmood, A., & Silk, J. 2002, MNRAS,
329, 813
Knebe, A., Gill, S. P. D., Gibson, B. K., et al. 2004, ApJ, 603, 7
Knebe, A., Knollmann, S. R., Muldrew, S. I., et al. 2011a, MNRAS, 415,
2293
Knebe, A., Libeskind, N. I., Doumler, T., et al. 2011b, MNRAS, 417, L56
Knebe, A., Libeskind, N. I., Knollmann, S. R., et al. 2011c, MNRAS, 412,
529
Knebe, A., Libeskind, N. I., Knollmann, S. R., et al. 2010, ArXiv e-prints
Knebe, A., Pearce, F. R., Lux, H., et al. 2013, MNRAS, 435, 1618
Knollmann, S. R. & Knebe, A. 2009, ApJS, 182, 608
Komatsu, E., Dunkley, J., Nolta, M. R., et al. 2009, ApJS, 180, 330
Komatsu, E., Smith, K. M., Dunkley, J., et al. 2011, ApJS, 192, 18
Koposov, S., Belokurov, V., Evans, N. W., et al. 2008, ApJ, 686, 279
Koposov, S. E., Rix, H.-W., & Hogg, D. W. 2010, ApJ, 712, 260
Kravtsov, A. 2010, Advances in Astronomy, 2010
Kroupa, P., Theis, C., & Boily, C. M. 2005, A&A, 431, 517
Kroupa, P., Tout, C. A., & Gilmore, G. 1993, MNRAS, 262, 545
Kuhlen, M., Vogelsberger, M., & Angulo, R. 2012, Physics of the Dark
Universe, 1, 50
177
BIBLIOGRAPHY
Kuzio de Naray, R., McGaugh, S. S., & de Blok, W. J. G. 2008a, ApJ, 676,
920
Kuzio de Naray, R., McGaugh, S. S., & de Blok, W. J. G. 2008b, ApJ, 676,
920
Kuzio de Naray, R., McGaugh, S. S., & Mihos, J. C. 2009, ApJ, 692, 1321
Lares, M., Lambas, D. G., & Domı́nguez, M. J. 2011, AJ, 142, 13
Law, D. R., Majewski, S. R., & Johnston, K. V. 2009, ApJ, 703, L67
Leauthaud, A., Tinker, J., Bundy, K., et al. 2012, ApJ, 744, 159
Libeskind, N. I., Di Cintio, A., Knebe, A., et al. 2013, PASA, 30, 39
Libeskind, N. I., Frenk, C. S., Cole, S., et al. 2005, MNRAS, 363, 146
Libeskind, N. I., Hoffman, Y., Knebe, A., et al. 2012, MNRAS, 421, L137
Libeskind, N. I., Knebe, A., Hoffman, Y., Gottlöber, S., & Yepes, G. 2011a,
MNRAS, 418, 336
Libeskind, N. I., Knebe, A., Hoffman, Y., et al. 2011b, MNRAS, 411, 1525
Libeskind, N. I., Yepes, G., Knebe, A., et al. 2010, MNRAS, 401, 1889
Lima Neto, G. B., Gerbal, D., & Márquez, I. 1999, MNRAS, 309, 481
Liu, L., Gerke, B. F., Wechsler, R. H., Behroozi, P. S., & Busha, M. T.
2010, ArXiv e-prints
Liu, L., Gerke, B. F., Wechsler, R. H., Behroozi, P. S., & Busha, M. T.
2011, ApJ, 733, 62
Lokas, E. L. 2009, MNRAS, 394, L102
Lokas, E. L., Kazantzidis, S., & Mayer, L. 2011, ArXiv e-prints
Lokas, E. L., Kazantzidis, S., Mayer, L., & Callegari, S. 2010, ArXiv e-prints
Lovell, M. R., Eke, V., Frenk, C. S., et al. 2012, MNRAS, 420, 2318
LSST Science Collaboration, Abell, P. A., Allison, J., et al. 2009, ArXiv
e-prints
Ludlow, A. D., Navarro, J. F., White, S. D. M., et al. 2011, MNRAS, 415,
3895
Macciò, A. V., Dutton, A. A., van den Bosch, F. C., et al. 2007, MNRAS,
378, 55
178
BIBLIOGRAPHY
Macciò, A. V. & Fontanot, F. 2010, MNRAS, 404, L16
Maccio’, A. V., Kang, X., & Moore, B. 2008, ArXiv e-prints
Macciò, A. V., Paduroiu, S., Anderhalden, D., Schneider, A., & Moore, B.
2012b, MNRAS, 424, 1105
Macciò, A. V., Stinson, G., Brook, C. B., et al. 2012, ApJL, 744, L9
Martin, N. F., de Jong, J. T. A., & Rix, H.-W. 2008, ApJ, 684, 1075
Martin, N. F., Schlafly, E. F., Slater, C. T., et al. 2013a, ArXiv e-prints
Martin, N. F., Slater, C. T., Schlafly, E. F., et al. 2013b, ApJ, 772, 15
Martinsson, T. P. K., Verheijen, M. A. W., Westfall, K. B., et al. 2013,
A&A, 557, A131
Martizzi, D., Teyssier, R., & Moore, B. 2013, MNRAS, 432, 1947
Mashchenko, S., Couchman, H. M. P., & Wadsley, J. 2006, Nature, 442,
539
Mateo, M. L. 1998, ARA&A, 36, 435
McConnachie, A. W. 2012, AJ, 144, 4
McConnachie, A. W., Irwin, M. J., Ferguson, A. M. N., et al. 2005, MNRAS,
356, 979
McGaugh, S. S., de Blok, W. J. G., Schombert, J. M., Kuzio de Naray, R.,
& Kim, J. H. 2007, ApJ, 659, 149
McKee, C. F. & Ostriker, J. P. 1977, ApJ, 218, 148
Merritt, D., Graham, A. W., Moore, B., Diemand, J., & Terzić, B. 2006,
AJ, 132, 2685
Merritt, D., Navarro, J. F., Ludlow, A., & Jenkins, A. 2005, ApJ, 624, L85
Metz, M., Kroupa, P., & Jerjen, H. 2007, MNRAS, 374, 1125
Metz, M., Kroupa, P., & Libeskind, N. I. 2008, ApJ, 680, 287
Mo, H. J. & Mao, S. 2004, MNRAS, 353, 829
Monaco, P., Benson, A. J., De Lucia, G., et al. 2014, MNRAS, 441, 2058
Moore, B. 1994, Nature, 370, 629
Moore, B., Ghigna, S., Governato, F., et al. 1999, ApJ, 524, L19
179
BIBLIOGRAPHY
More, S., Kravtsov, A., Dalal, N., & Gottlöber, S. 2011, ArXiv e-prints
Moster, B. P., Naab, T., & White, S. D. M. 2013, MNRAS, 428, 3121
Moster, B. P., Somerville, R. S., Maulbetsch, C., et al. 2010, ApJ, 710, 903
Muñoz-Cuartas, J. C., Macciò, A. V., Gottlöber, S., & Dutton, A. A. 2011,
MNRAS, 411, 584
Munshi, F., Governato, F., Brooks, A. M., et al. 2013, ApJ, 766, 56
Navarro, J. F., Eke, V. R., & Frenk, C. S. 1996a, MNRAS, 283, L72
Navarro, J. F., Frenk, C. S., & White, S. D. M. 1996b, ApJ, 462, 563
Navarro, J. F., Hayashi, E., Power, C., et al. 2004, MNRAS, 349, 1039
Navarro, J. F., Ludlow, A., Springel, V., et al. 2010, MNRAS, 402, 21
Nesti, F. & Salucci, P. 2013, Journal of Cosmology and Astro-Particle
Physics, 7, 16
Nickerson, S., Stinson, G., Couchman, H. M. P., Bailin, J., & Wadsley, J.
2011, MNRAS, 415, 257
Obreja, A., Brook, C. B., Stinson, G., et al. 2014, ArXiv e-prints,1404.0043
Oh, K. S., Lin, D. N. C., & Aarseth, S. J. 1995, ApJ, 442, 142
Oh, S., Brook, C., Governato, F., et al. 2011a, ArXiv e-prints
Oh, S.-H., de Blok, W. J. G., Brinks, E., Walter, F., & Kennicutt, Jr., R. C.
2011b, AJ, 141, 193
Onions, J., Knebe, A., Pearce, F. R., et al. 2012, ArXiv e-prints
Parry, O. H., Eke, V. R., Frenk, C. S., & Okamoto, T. 2012, MNRAS, 419,
3304
Peñarrubia, J., Benson, A. J., Walker, M. G., et al. 2010, MNRAS, 406,
1290
Peñarrubia, J., McConnachie, A. W., & Navarro, J. F. 2008, ApJ, 672, 904
Peñarrubia, J., Navarro, J. F., McConnachie, A. W., & Martin, N. F. 2009,
ApJ, 698, 222
Peñarrubia, J., Pontzen, A., Walker, M. G., & Koposov, S. E. 2012, ApJ,
759, L42
Peebles, P. J. E. 1980, The large-scale structure of the universe
180
BIBLIOGRAPHY
Penzo, C., Macciò, A. V., Casarini, L., Stinson, G. S., & Wadsley, J. 2014,
ArXiv e-prints
Planck Collaboration, Ade, P. A. R., Aghanim, N., et al. 2013, ArXiv eprints
Pontzen, A. & Governato, F. 2012, MNRAS, 421, 3464
Pontzen, A. & Governato, F. 2014, Nature, 506, 171
Power, C. & Knebe, A. 2006, MNRAS, 370, 691
Power, C., Navarro, J. F., Jenkins, A., et al. 2003, MNRAS, 338, 14
Prada, F., Klypin, A. A., Cuesta, A. J., Betancort-Rijo, J. E., & Primack,
J. 2012, MNRAS, 423, 3018
Prada, F., Klypin, A. A., Simonneau, E., et al. 2006, ApJ, 645, 1001
Prada, F., Vitvitska, M., Klypin, A., et al. 2003, ApJ, 598, 260
Prugniel, P. & Simien, F. 1997, A&A, 321, 111
Quinn, T. & Binney, J. 1992, MNRAS, 255, 729
Read, J. I. & Gilmore, G. 2005, MNRAS, 356, 107
Read, J. I., Wilkinson, M. I., Evans, N. W., Gilmore, G., & Kleyna, J. T.
2006, MNRAS, 367, 387
Reed, D., Governato, F., Verde, L., et al. 2005, MNRAS, 357, 82
Reed, D. S., Koushiappas, S. M., & Gao, L. 2011, MNRAS, 415, 3177
Reiprich, T. H. & Böhringer, H. 2002, ApJ, 567, 716
Riebe, K., Partl, A. M., Enke, H., et al. 2013, Astronomische Nachrichten,
334, 691
Riess, A. G., Filippenko, A. V., Challis, P., et al. 1998, AJ, 116, 1009
Romano-Dı́az, E., Shlosman, I., Hoffman, Y., & Heller, C. 2008, ApJ, 685,
L105
Rubin, V. C., Ford, W. K. J., & . Thonnard, N. 1980, ApJ, 238, 471
Salucci, P. & Burkert, A. 2000, ApJ, 537, L9
Scannapieco, C., Wadepuhl, M., Parry, O. H., & et al. 2012, MNRAS, 423,
1726
181
BIBLIOGRAPHY
Schmidt, M. 1959, ApJ, 129, 243
Schneider, A., Anderhalden, D., Macciò, A. V., & Diemand, J. 2014, MNRAS, 441, L6
Schuberth, Y., Richtler, T., Hilker, M., et al. 2010, A&A, 513, A52
Seigar, M. S., Barth, A. J., & Bullock, J. S. 2008, MNRAS, 389, 1911
Sérsic, J. L. 1963, Boletin de la Asociacion Argentina de Astronomia La
Plata Argentina, 6, 41
Sérsic, J. L. 1968, Atlas de galaxias australes
Shen, S., Wadsley, J., & Stinson, G. 2010, MNRAS, 407, 1581
Silk, J. 2003, MNRAS, 343, 249
Simon, J. D., Bolatto, A. D., Leroy, A., Blitz, L., & Gates, E. L. 2005, ApJ,
621, 757
Simon, J. D. & Geha, M. 2007, ApJ, 670, 313
Smoot, G. F., Bennett, C. L., Kogut, A., et al. 1992, ApJ, 396, L1
Somerville, R. S. 2002, ApJ, 572, L23
Sorce, J., Courtois, H., Gottloeber, S., et al. 2014, in American Astronomical Society Meeting Abstracts, Vol. 223, American Astronomical Society
Meeting Abstracts, 313.01
Spergel et al., D. N. 2003, ApJS, 148, 175
Spergel et al., D. N. 2007, ApJS, 170, 377
Springel, V. 2005, MNRAS, 364, 1105
Springel, V. & Hernquist, L. 2003, MNRAS, 339, 289
Springel, V., Wang, J., Vogelsberger, M., et al. 2008, MNRAS, 391, 1685
Stinson, G., Seth, A., Katz, N., et al. 2006, MNRAS, 373, 1074
Stinson, G. S., Bailin, J., Couchman, H., et al. 2010, MNRAS, 408, 812
Stinson, G. S., Brook, C., Macciò, A. V., et al. 2013, MNRAS, 428, 129
Stinson, G. S., Brook, C., Prochaska, J. X., et al. 2012, MNRAS, 425, 1270
Stoehr, F., White, S. D. M., Springel, V., Tormen, G., & Yoshida, N. 2003,
MNRAS, 345, 1313
182
BIBLIOGRAPHY
Strigari, L. E., Frenk, C. S., & White, S. D. M. 2010, MNRAS, 408, 2364
Strigari, L. E. & Wechsler, R. H. 2012, ApJ, 749, 75
Swaters, R. A., Madore, B. F., van den Bosch, F. C., & Balcells, M. 2003,
ApJ, 583, 732
Teyssier, R., Pontzen, A., Dubois, Y., & Read, J. I. 2013, MNRAS, 429,
3068
Tikhonov, A. V., Gottlöber, S., Yepes, G., & Hoffman, Y. 2009, MNRAS,
399, 1611
Tissera, P. B. & Dominguez-Tenreiro, R. 1998, MNRAS, 297, 177
Tollerud, E. J., Boylan-Kolchin, M., Barton, E. J., Bullock, J. S., & Trinh,
C. Q. 2011, ApJ, 738, 102
Tollerud, E. J., Boylan-Kolchin, M., & Bullock, J. S. 2014, MNRAS, 440,
3511
Tollerud, E. J., Bullock, J. S., Strigari, L. E., & Willman, B. 2008, ApJ,
688, 277
Tonini, C., Lapi, A., & Salucci, P. 2006, ApJ, 649, 591
Tonry, J. L., Dressler, A., Blakeslee, J. P., et al. 2001, ApJ, 546, 681
Torres, G. 2010, AJ, 140, 1158
van den Bergh, S. 1994, AJ, 107, 1328
van den Bergh, S. 2000, The Galaxies of the Local Group (Cambridge Univ.
Press, Cambridge)
Vera-Ciro, C. A., Helmi, A., Starkenburg, E., & Breddels, M. A. 2013,
MNRAS, 428, 1696
Viel, M., Becker, G. D., Bolton, J. S., & Haehnelt, M. G. 2013, Phys. Rev.
D, 88, 043502
Viel, M., Lesgourgues, J., Haehnelt, M. G., Matarrese, S., & Riotto, A.
2005, Phys. Rev. D, 71, 063534
Vogelsberger, M., Zavala, J., & Loeb, A. 2012, MNRAS, 423, 3740
Wadepuhl, M. & Springel, V. 2011, MNRAS, 410, 1975
Wadsley, J. W., Stadel, J., & Quinn, T. 2004, New Astronomy, 9, 137
183
BIBLIOGRAPHY
Wadsley, J. W., Veeravalli, G., & Couchman, H. M. P. 2008, MNRAS, 387,
427
Walker, M. G., Mateo, M., Olszewski, E. W., et al. 2007, ApJ, 667, L53
Walker, M. G., Mateo, M., Olszewski, E. W., et al. 2009, ApJ, 704, 1274
Walker, M. G. & Peñarrubia, J. 2011, ApJ, 742, 20
Walsh, S. M., Willman, B., & Jerjen, H. 2009, AJ, 137, 450
Wang, J., Frenk, C. S., Navarro, J. F., Gao, L., & Sawala, T. 2012, MNRAS,
424, 2715
Wang, J. & White, S. D. M. 2007, MNRAS, 380, 93
Watkins, L. L., Evans, N. W., & An, J. H. 2010, MNRAS, 406, 264
White, S. D. M. & Rees, M. J. 1978, MNRAS, 183, 341
Willick, J. A., Courteau, S., Faber, S. M., et al. 1997, ApJS, 109, 333
Wojtak, R. & Lokas, E. L. 2010, MNRAS, 408, 2442
Wolf, J. & Bullock, J. S. 2012, ArXiv e-prints arxiv:1203.4240
Wolf, J., Martinez, G. D., Bullock, J. S., et al. 2010, MNRAS, 406, 1220
Woo, J., Courteau, S., & Dekel, A. 2008, MNRAS, 390, 1453
Woodley, K. A., Gómez, M., Harris, W. E., Geisler, D., & Harris, G. L. H.
2010, AJ, 139, 1871
Xu, D. D., Mao, S., Wang, J., et al. 2009, MNRAS, 398, 1235
Xue, X. X., Rix, H. W., Zhao, G., et al. 2008, ApJ, 684, 1143
Zentner, A. R., Kravtsov, A. V., Gnedin, O. Y., & Klypin, A. A. 2005, ApJ,
629, 219
Zolotov, A., Brooks, A. M., Willman, B., et al. 2012, ApJ, 761, 71
184
© Copyright 2026 Paperzz