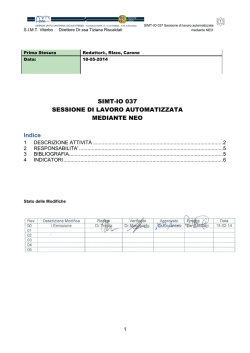
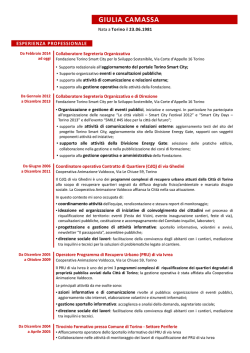
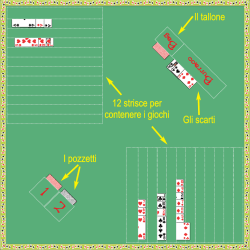
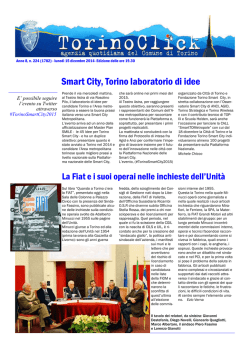
27
*Stefano Pozzati
*Diego Sanvito
*Claudio Castelli
**Dumitru Roman
Understanding territorial distribution
of Properties of Managers and
Shareholders: a Data-driven Approach
DOI: 10.14609/Ti_2_16_2e
Keywords: managers and shareholder concentration score, real estate market, Turin, Rome,
Milan.
Abstract The analysis and better understanding of the distribution of wealth of individuals in cities can
be a precious tool, especially in support of the estimation of real estate values. These analyses can also
be used to facilitate decision making in various sectors, such as public administration or the real estate
market. In this paper, by making use of publicly available data and of data owned by Cerved, (a credit
scoring company in Italy), we can observe the territorial distribution of the properties of managers and
shareholders – categories of people usually linked to high economic well-being – and, based on that, we
identify the areas of the cities where the value of real estate properties is presumably higher. More
specifically, we introduce the Manager and Shareholder Concentration (MSHC) score and validate its
accuracy and effectiveness in three Italian cities (Turin, Rome and Milan).
*
Cerved Group, Milan, Italy
**
SINTEF, Oslo, Norway
28
Stefano Pozzati, Diego Sanvito, Claudio Castelli, Dumitru Roman
INTRODUCING THE MANAGER AND SHAREHOLDER CONCENTRATION (MSHC) SCORE
This paper introduces the “Manager and Shareholders Concentration (MSHC) score” – an index
created with the aim of identifying the wealthiest areas within a certain municipality. This is of
particular interest for the real estate market, especially when there are several wealthy areas within
the same city. This paper will thus introduce the index and demonstrate how it can correctly identify
the areas with high real estate values within a city, even when they are located far from the city centre.
In fact, as suggested by Ioannides and Seslen (2002), ownership of a real estate property is one of
the main components of a household’s wealth; this analysis provides interesting insights on how
income, real estate value, and total wealth interact and are related. Moreover, the work proposed
here is particularly thought-provoking in order to understand how neighbourhoods can be sorted
and how they are composed in terms of wealth and income.
Many indicators currently under development by Cerved,1 such as the number of historical points or
the number of hotels within a 500-metre radius of a given place, can identify the city’s centre as the
most favourable area in terms of prestige and high real estate value, in addition to other areas such
as hills, which are wealthy and luxurious even if they lack hotels or historical monuments. These areas
are as wealthy as the city centre, sometimes wealthier, but their characteristics are quite different. It
is therefore necessary to understand which territorial or geographical features could best help in
identifying such areas. Among the possible choices, only the presence of parks and green areas
appears to be a sound alternative, but ultimately do not provide entirely satisfactory results because
such indicators perform poorly in medium and small sized cities.
The approach proposed in this paper aims to directly observe the distribution of the properties of
the wealthiest citizens, who usually choose to move to and live in the most prestigious areas. While
this phenomenon can be observed in many cities around the world, in Italy it is particularly evident
in the cities of Bologna and Turin: although they are endowed with fascinating city centres, many of
the buildings of greatest importance are located on the hills far from the centre.
The crucial question becomes to correctly determine which sample of citizens to select and qualify
as managers or, more generally, wealthy people. To do this, we used Cerved’s proprietary database
– a database containing public data on all Italian companies – to extract information about individuals
recognized as shareholders and/or managers. In the context of this work, a shareholder is considered
anyone who owns shares above the threshold percentage of 25% of the company’s share capital,
while a manager is defined as anyone who holds a key position within a company, accomplishes
management duties, and is legally liable for the company’s debts.
In Italy, managers and shareholders are legally obligated to provide the address of their residence
to the business register of the Italian Chamber of Commerce; moreover, the public Cadastral database
for properties can also be queried.2 However, it s necessary to proceed with caution, as this
information is not always entirely reliable. This is why, to overcome this limitation, this information
had to be checked against other indicators, such as distance in metres from an industrial area, or
total number of residents per a given delimited geographical area; these additional indicators were
developed by Cerved using ISTAT data from the fifteenth population census.3 The general aim of this
approach is to try to gain a more comprehensive understanding of the distribution of wealth within
a single city; not only can this be thought of as a highly helpful instrument for the real estate market,
1
http://company.cerved.com/
2
https://sister.agenziaentrate.gov.it/CitizenVisure/
3
http://www.istat.it/en/population-and-housing-census/population-and-housing-2011
Understanding territorial distribution of Properties of Managers and Shareholders: a Data-driven Approach
29
but the results can be used, for example, in the area of public administration, in order to guide
potential local investment policies.
In calculating the MSHC score, the basic idea is to observe the total number of properties of
managers and shareholders per geographic area, comparing this information with the total number
of residents in the same geographic area. This approach provides a result that can be immediately
visualized graphically using thematic maps; for example, by plotting the score on a map of the cities
of Turin and Bologna, it may be noted that the two most relevant areas are, respectively, the centre,
the hill on the eastern side of the city, and the hill on the southern side.
The following sections illustrate the score calculation method, followed by examples for three Italian
metropolitan cities: Turin, Rome, and Milan. Lastly, in the conclusions, we summarize the paper and
provide an outlook for potential future developments.
THE MSHC SCORE CALCULATION
To observe the territorial distribution of the MSHC score, we first have to decide how to split the
territory into small areas to which we will assign the scores. For this analysis, we use the ISTAT census
partition (ISTAT cells)4 and, for the city of Turin, the micro-areas partition as well. Although these are
widespread standards, it must be kept in mind how they were created, and what their underlying
logic is, in order to avoid running into potential problems and to fully understand how the score is
calculated.
ISTAT splits Italian territory into approximately 400,000 census sections of varying size and shape,
creating a vast mosaic. The difference between cells is due to the different number of resident
individuals. Larger cells are typically in smaller cities or in the suburbs, where there are fewer houses
and buildings tend to have fewer floors, so the number of inhabitants is smaller than in the cells of
the city centre, where the opposite occurs. In the city centre, a census cell typically corresponds to
a city block, while in the suburbs it can cover a larger area.
The relevance of the partition of the territory is strictly connected to the MSHC score: the number of
managers and shareholders is compared to the number of residents per individual ISTAT cell.
In Italy, out of a total of approximately circa 366,000 ISTAT cells, it was possible to associate the
number of properties owned by managers and shareholders of all active Italian companies (as of
June 2016) with approximately 200,000 ISTAT cells. This operation was also possible thanks to the
extraction of information from the Cadastral database and from the information archived by the Italian
Chamber of Commerce. Table 1 sets out the results of this extraction, both, Italy-wide and for the
three analyzed cities, showing the number of properties belonging to managers (no. M), the number
of properties belonging to shareholders (No. S), and the number of ISTAT cells (No. of ISTAT cells) for
which the MSHC score could be calculated.
4
Italian census cells: http://www.istat.it/it/archivio/sezione+di+censimento
30
Stefano Pozzati, Diego Sanvito, Claudio Castelli, Dumitru Roman
City
N° M
N° S
No. of ISTAT cells
Italy
3,000,000
9,000,000
200,000
Turin
40,000
130,000
4,000
Rome
180,000
280,000
13,000
Milan
100,000
180,000
6,000
Table 1 Analyzed data sample: Italy-side, and detail for the three analyzed cities
Moreover, for each cell, the total number of residents and the distance from an industrial area where
calculated.
Based on the territorial partition and the available data, the MSHC score per individual ISTAT cell is
calculated as follows:
Where:
N°M is the Number of resident Managers per ISTAT cell;
N°S is the Number of resident Shareholders per ISTAT cell;
N°R is the Number of Residents per ISTAT cell;
DIZC is a weighting coefficient based on the distance from an industrial area.
For each individual ISTAT cell, the MSHC score is defined as the sum of the total number of resident
managers and the total number of resident shareholders divided by the total number of residents
present in that given cell. Although simple, this formula yields immediately valuable outcomes using
maps for visualization. However, this result is further improved by the use of the weighting coefficient
DIZC based on the distance from an industrial area.
The weighting coefficient DIZC consists of the Heavy Industries Concentration (HIC) score developed
by Cerved using a proprietary database containing all active Italian companies (as of June 2016).
This database is used to extract information related to the locations of the companies operating in
various industries. This information is aggregated and distributed within each census cell and the
HIC score is calculated as follows:
Where N°HI is the number of heavy industries per census cell.
The reason underlying this adjustment lies in the fact that, from an initial observation of the results,
some cells in areas recognized as non-prestigious garnered high scores. This phenomenon appears
to be due to the fact that some managers or shareholders decide to reside in their company’s vicinity.
This behaviour chosen by managers and shareholders cannot justify classifying an area as wealthy
and thus characterized by high real estate value. The weighting coefficient DIZC also reduces another
problem: cells with a small number of residents.
Understanding territorial distribution of Properties of Managers and Shareholders: a Data-driven Approach
31
As shown by the examples in the next sections, this score calculation method has proved to be rather
accurate; however, the validation process has presented certain challenges that must absolutely be
taken into consideration in order to fully comprehend the method’s current strengths, and the
situations where it could yield more satisfactory results.
The territorial division of the entire Italian peninsula into census sections (ISTAT cells) is a well-adopted
standard: in fact, many other socio-demographic indicators provided by ISTAT use it as well.
Nevertheless, it also presents some critical elements that require further consideration: the correlation
between the size of the ISTAT cell and the number of residents is certainly one of them. This is
especially relevant in the calculation of the MSHC score, and can create outliers that highlight how
the score’s different components can potentially create warped assessments of an area, and
consequently lead to errors in any real estate appraisal processes. In the following sections, we discuss
the results obtained by calculating the MSHC score for three Italian cities (Turin, Rome and Milan).
EXAMPLES OF THE DISTRIBUTION OF THE MSHC SCORE IN CERTAIN ITALIAN METROPOLISES
The territorial distribution of the MSHC score can be easily observed through a heat map. On the
maps, darker colours correspond to high scores, while lighter colours are associated with lower
scores. Heat maps also allow the territorial distribution of real estate values to be easily compared,
in order to verify whether there is a correlation between prices and scores.
For the city of Turin, it was possible to analyze the correlation between the MSHC score and the
asking prices for real estate provided by Osservatorio Immobiliare della Città di Torino – OICT (Turin
Real estate Market Observatory),5 in comparison with their territorial distribution.
For the cities of Rome and Milan, the comparison between the MSHC score and real estate values was
made using the values published by Osservatorio del Mercato Immobiliare (OMI) of Agenzia dell'Entrate
(Italian Revenue authority),6 an important reference for the real estate market on the national level.
Nevertheless, this comparison cannot be made as it is not entirely accurate for the purpose of score
validation: these values are in fact based in part on quotations and not asking or sale prices, which would
be a more reliable source. Moreover, the OMI sets out, for each area, only the minimum and maximum
values, but not the average ones calculated on the basis of the acquired data samples. Therefore, it was
not possible to compare the score with the average values, because the average calculated starting
from the OMI minimum and maximum values would have generated statistically warped results.
Turin
The first city used to analyze the MSHC score was Turn – an Italian city with various wealthy areas –
as it is an effective case study to observe whether the score identifies the areas of the city
characterized by the highest real estate values.
The historic centre has census sections with higher MSHC scores (Figure 1): the centre is in fact one
of the wealthiest areas, with Piazza San Carlo, Piazza Castello, and Piazza Vittorio Veneto being just
some of this area’s points of interest. The Mole Antonelliana is certainly the major Landmark building,
while Via Roma can be considered as one of the main thoroughfares where the predominant Baroque
architecture may be admired. Crocetta and San Salvario are home to some highly rated residential
buildings, and are in fact regarded by locals as prestigious neighbourhoods. At any rate, it is important
to stress that in addition to the historic centre which boasts an elegant architectural style and refined
buildings, at least two more areas where MSHC scores are high may be identified.
5
http://www.oict.polito.it/
6
http://www.agenziaentrate.gov.it/
32
Stefano Pozzati, Diego Sanvito, Claudio Castelli, Dumitru Roman
Figure 1 Territorial distribution of the MSHC score in the city of Turin. The MSHC score is displayed on the map,
associating a darker colour with higher scores and brighter colours with lower ones
The centre is located on the western bank of the Po river, but in Figure 1 we may note that the hill
on the opposite bank also has dark-coloured census sections; this is significant, because the hill is in
fact home to many marvellous mansions and residential buildings, where many of Turin’s wealthiest
people live. This demonstrates how the score can identify a prestigious area or neighbourhood even
when it is relatively far from the centre.
Another area with high MSHC scores, albeit not as high as the ones mentioned above, is the one that
mainly covers the neighbourhoods of Cenisia and Cit Turin: this area starts from the western part of
the city centre and expands to the city’s western boundary. In this area, real estate values are growing
rather rapidly, mainly due to the presence of the underground line providing a convenient link with
the city centre and the railway stations.
Observing the map in Figure 1, it may also be noted that the areas with low MSHC scores are
concentrated in the city’s north and south: these are potentially industrial areas or neighbourhoods
with relatively low real estate values. Turin is famous for the automobile industry which for years has
represented the city’s mainly economic activity, and there is still a significant presence of industrial
districts. Today, the capital of Piedmont is trying to develop and sustain more innovative companies
and initiatives in order to improve the service sector. In support of this new trend, it is pointed out
that the European Commission has ranked Turin the second-most innovative European City.7
7
http://ec.europa.eu/research/innovation-union/index_en.cfm?section=icapital
Understanding territorial distribution of Properties of Managers and Shareholders: a Data-driven Approach
33
The example of Turin is particularly eloquent, because it presents many challenging areas: the
industrial areas, the Superga hill, and the areas served by the underground; the MSHC score is able
to highlight the challenges posed by the heterogeneous characteristics of those areas, providing an
excellent picture of the city and of the areas where its wealthiest citizens decide to live.
Table 2 shows the average scores aggregated by macro-areas for the city of Turn: the highest scores
are located in the centre (38) and on the hill (24.75), while scores tend to decrease towards the
suburbs. The semi-central area displays a similar level, but with a higher standard deviation with
respect to the hill. The same table also shows the mean prices, again for the same geographical
aggregation: it may be observed that the MSHC score and the mean prices per square metre follow
the same trend. The hill area has higher prices per square meter than those in the semi-central area,
and lower prices than the city centre. Mean prices refer to asking prices for residential units surveyed
over the course of 2015 by Osservatorio Immobiliare della Città di Torino – OICT (Turin Real estate
Market Observatory), which is assuredly one of the most reliable sources of information when it comes
to the Piedmontese city’s real estate market. However, for the sake of completeness, it must be noted
that considering statistics aggregated by macro-area is not completely representative of how much
the score is able to detect the price differences; this is why Figure 2 compares the territorial
distribution both of the prices and of the MSHC scores in the census micro-areas (which group
together a number of ISTAT census sections), in order to verify the score’s ability to identify the most
prestigious areas characterized by the highest real estate values. This processing is also supported
by the detailed MSHC scores by micro-zone reported in Table 3.
The correlation is positive in numerous central micro-zones, in the hill micro-zones, and in those
towards the city’s western boundary.
Prezzi medi di offerta (Euro/m2)
anno 2015 (Fonte: OICT)a
MSHC score
Macro-area
Mean
Standard deviation
Mean
Standard deviation
Central
38.00
5.03
3255.49
1118.03
Semi-central
24.62
8.18
2300.18
1058.33
Periphery
11.77
4.42
1666.58
528.53
Hill
24.75
3.59
2939.68
1066.71
Table 2 MSHC score statistics by macro-area (city of Turin)
Microzone
MSHC score
01. Roma
44
02. Carlo Emanuele II
44
03. Solferino
44
04. Vinzaglio
35
05. Garibaldi
36
06. Castello
39
07. Vanchiglia
20
Table 3 MSHC score by micro-area (city of Turin)
34
Stefano Pozzati, Diego Sanvito, Claudio Castelli, Dumitru Roman
Microzone
MSHC score
08. Rocca
37
09. Valentino
22
10. San Salvario
28
11. Dante
23
12. San Secondo
36
13. Stati Uniti
37
14. Galileo Ferraris
39
15. De Gasperi
31
16. Duca d’Aosta
43
17. Spina 2 - Politecnico
21
18. Duchessa Jolanda
26
19. San Donato
21
20. Porta Palazzo
21
21. Palermo
17
22. Michelotti
24
23. Crimea
30
24. Collina
22
25. Zara
23
26. Carducci
12
27. Unità D’Italia
12
28. Lingotto
13
29. Santa Rita-Mirafiori
15
30. Mirafiori Sud
5
31. San Paolo
18
32. Pozzo Strada
20
33. Aeronautica/Parella
16
34. Spina 3 - Eurotorino
11
35. MadonnaCampagna
15
36. Spina 4 - Docks Dora
12
37. Rebaudengo
11
38. Corona Nord Ovest
6
39. Spina 1 - Marmolada
18
40. Barca Bertolla
5
Table 3 MSHC score by micro-area (city of Turin)
Understanding territorial distribution of Properties of Managers and Shareholders: a Data-driven Approach
Mean asking prices (Euro/m2) by micro-area – Turin
Figure 2a - Comparison between territorial distribution of prices and of MSHC score aggregated by census micro-area
Source: OICT - Osservatorio Immobiliare della Città di Torino
35
36
Stefano Pozzati, Diego Sanvito, Claudio Castelli, Dumitru Roman
MSHC score for micro-areas - Turin
Figure 2b Comparison between territorial distribution of prices and of MSHC score aggregated by census micro-area
Source: Cerved
Understanding territorial distribution of Properties of Managers and Shareholders: a Data-driven Approach
37
The score shows high values in the city centre, the hill, and the micro-areas on the western side of
the city, while it correctly identifies the south and north areas of the city as less prestigious. This result
further confirms that the score can also be considered a valuable tool for predicting values on the
real estate market. However, it is important to bear in mind that the existing correlations between the
score and real estate values are to be taken as trend indicators, as the detailed relationship between
the prices and the architectural characteristics of the properties (type, age of construction, size, etc.)
should also be analyzed. It is also worth pointing out that the mean asking price was taken as a
reference datum: in the research’s future developments, actual sale prices may be considered, and it
may be assessed whether the maximum prices may be more representative of the properties
purchased by the parties considered for the calculation of the MSHC score.
Rome
The second city chosen to analyze the MSHC score is Rome, a very complex city due to the vastness
of the municipal area that is not comparable to any Italian metropolis, as well as due to the particular
shape of some specific areas, namely the proximity to the city-state of the Vatican, the large number
of historical and cultural points of interest, and access to the sea.
Macro-area
Mean
Standard deviation
Central
33.16
24.78
Semi-central
23.07
14.77
Periphery
14.21
10.14
Suburbs
12.07
10.17
5.72
7.84
Rural
Table 4 MSHC score statistics by macro-area (city of Rome)
The comparison between the MSHC scores and the real estate values published by the OMI for the
city of Rome shows a close correspondence between score and market, even if it is not always
perfectly truthful. For the most central area, in the heart of the city, the score slightly underestimates
market values: in fact, the area is high-quality, very well served, and well linked to the rest of the city,
and thus cannot be compared with similar scored areas in the periphery. This is due essentially to
the peculiar aspects of the city of Rome, where the ownership of luxury property in the city centre
does not always stem from current economic status, but is more closely linked to the sociodemographic legacy of the city itself.
The size of the Italian capital does not allow the distribution to be observed in detail, but it may be
noted that there are more high-value areas. However, the scores show greater correspondence to
market prices in Rome’s suburbs. The value of the properties in those areas is on the rise, in
consideration of the excellent service resources (with the presence not only of undergrounds and
public transit, but also of universities and excellent educational institutions) that push up the price
of residential property. Even though the increase in market value in these areas has been significant
of late, it is still not enough to reach the price levels of the city centre, where the prestige of the
buildings and areas, as well as of the commercial and tourist areas, also carries importance.
As for the individual neighbourhoods, centre versus periphery differences are found in some areas.
Neighbourhoods such as Parioli, Pinciano, or Trieste indeed have scores comparable to some remote
areas (like La Rustica or EUR), while market prices are higher.
To the contrary, the score can optimally approximate property values in some emerging neighbourhoods
such as Montesacro, Pietralata, and Collatino, where prices are reaching medium / high standards.
38
Stefano Pozzati, Diego Sanvito, Claudio Castelli, Dumitru Roman
Figure 3 Territorial distribution of the MSHC score in the city of Rome. The MSHC score is visualized on the map
by associating a darker colour with higher scores, and brighter colours with lower scores
Milano
The third city used to analyze the MSHC score was Milano – a city that has experienced major changes
in recent years. Milan has seen the development of new neighbourhoods and skyscrapers, a universal
exposition (EXPO), and a new underground line (with another under development) after years of
inactivity. The highest MSHC score is found in the centre of the city, as could easily be foreseen, with
the highest values concentrated in the central neighbourhoods, such as Duomo, San Babila, Verziere,
and Brera. Other neighbourhoods such as Cinque Vie, Cordusio, Castello, and Magenta display an
above-average MSHC score. Hence, around the city centre, the accuracy of the score is quite good
at identifying valuable real estate areas. Other neighbourhoods such as Porta Vittoria, Porta Garibaldi,
and Porta Genova have been gaining value in recent years. Moving towards the suburbs, neighbourhoods
such as San Siro, Porta Romana, San Pietro, Maddalena, and, in part, Isola show very high scores.
However, it may be stated that the census sections with the highest scores are located around the centre,
while in the suburbs not many neighbourhoods are identified as particularly wealthy.
Macro-area
Mean
Standard deviation
Central
43.68
Semi-central
32.16
15.6
Periphery
16.07
11.35
7.3
6.69
4.95
5.79
Suburbs
Rural
Table 5 MSHC score statistics by macro-area (city of Milan)
22.57
Understanding territorial distribution of Properties of Managers and Shareholders: a Data-driven Approach
39
Figure 4 Territorial distribution of the MSHC score in the city of Milan. The MSHC score is visualized on the map
by associating a darker colour with higher scores, and brighter colours with lower scores
CONCLUSIONS AND OUTLOOK
The MSHC score illustrated in this paper provides an interesting index that may be used to better
comprehend where the richest segments of the population live, and consequently to identify the
areas of the city with the highest real estate values. Obviously, although considering this score alone
is not enough to support the valuation of real estate property values, together with other indicators
under development at Cerved (for real estate valuation) it represents an excellent starting point.
One of Cerved’s main goals is to predict the real estate market value for the entire Italian territory,
and the MSHC score can provide an important source of information for this purpose. The estimate
will be constructed through the use of a hedonic linear regression model (Kettani, Oral, Siskos, 1998;
Pagourtzi, Assimakopoulos, Hatzichristos, French, 2003; Monson, 2009), and the score will be used
as one of the fundamental regressors.
In addition to the cities presented in this document, the MSHC score was calculated for the whole
Italian territory, and can be replicated in all European countries, if access to similar data is ensured.
The MSHC score may therefore be used to support the estimation of real estate property values, by
considering it jointly with other components. In future efforts, the result of the estimation will be
compared to that of a previous analysis, focused on the Italian city of Turin (Curto, 2009), which
provides a similar hedonic price estimation even though the data and regressors are different.
The MSHC score could be used in various sectors, such as input for additional research on the census
of the city, social enquiries, or for property insurance assessments (of any kind) in a particular area
of the city.
40
Stefano Pozzati, Diego Sanvito, Claudio Castelli, Dumitru Roman
At Cerved, several activities are planned based on the MSHC score:
• Refinements to consolidate the score of heavy industry concentration (already used in the MSHC
score) with the use of text semantics (corporate purpose and website analysis);
• Weighing managers and shareholders differently based on the current and historical financial
performance of the underlying companies;
• Defining an MSHC score dedicated to managers and shareholders of companies defined as
innovative startups, in order to find neighbourhoods with the greatest medium-term real estate
growth due to the concentration of startups (gentrification).
Acknowledgements.
This work is partially supported by the European proDataMarket project (H2020 644497).
References
Curto, R. (2009), Una stima dei prezzi impliciti in un segmento del mercato immobiliare di Torino, Aestimum, (22).
Ioannides Y. M., Seslen T. N. (2002), Neighborhood wealth distributions, Economics Letters, 76(3), 357-367.
Kettani O., Oral M., Siskos Y. (1998), A multiple criteria analysis model for real estate evaluation, Journal of Global Optimization,
12(2), 197-214.
Monson M. (2009), Valuation using hedonic pricing models, Cornell Real Estate Review, 7(1), 10.
Pagourtzi E., Assimakopoulos V., Hatzichristos T., French, N. (2003), Real estate appraisal: a review of valuation methods, Journal
of Property Investment & Finance,21(4), 383-40.
This work is licensed under a
Creative Commons Attribution - NonCommercial 3.0
© Copyright 2026 Paperzz