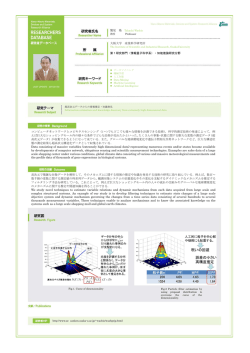
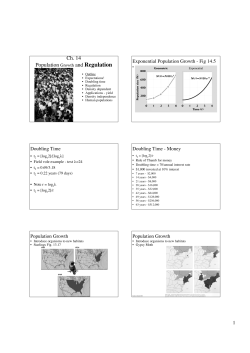
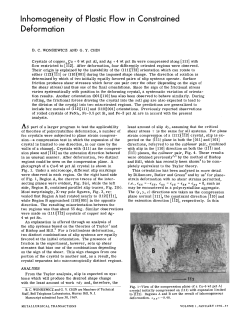
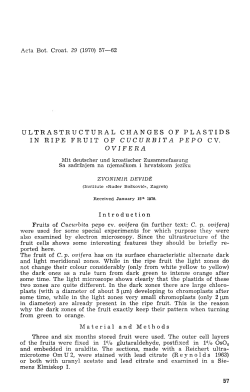
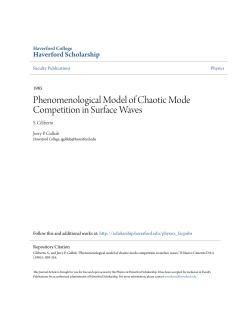
PHYSICAL REVIEW E 95, 022405 (2017)
Spiral-wave dynamics in a mathematical model of human ventricular tissue
with myocytes and Purkinje fibers
Alok Ranjan Nayak,1,* A. V. Panfilov,2,3 and Rahul Pandit4,†
1
International Institute of Information Technology (IIIT-Bhubaneswar), Gothapatna, Po: Malipada, Bhubaneswar 751003, India
2
Department of Physics and Astronomy, Gent University, Krijgslaan 281, S9, 9000 Gent, Belgium
3
Moscow Institute of Physics and Technology (State University), Dolgoprudny, Moscow Region, Russia
4
Centre for Condensed Matter Theory, Department of Physics, Indian Institute of Science, Bangalore 560012, India
(Received 23 June 2016; revised manuscript received 18 October 2016; published 13 February 2017)
We present systematic numerical studies of the possible effects of the coupling of human endocardial and
Purkinje cells at cellular and two-dimensional tissue levels. We find that the autorhythmic-activity frequency of
the Purkinje cell in a composite decreases with an increase in the coupling strength; this can even eliminate the
autorhythmicity. We observe a delay between the beginning of the action potentials of endocardial and Purkinje
cells in a composite; such a delay increases as we decrease the diffusive coupling, and eventually a failure of
transmission occurs. An increase in the diffusive coupling decreases the slope of the action-potential-durationrestitution curve of an endocardial cell in a composite. By using a minimal model for the Purkinje network, in
which we have a two-dimensional, bilayer tissue, with a layer of Purkinje cells on top of a layer of endocardial
cells, we can stabilize spiral-wave turbulence; however, for a sparse distribution of Purkinje-ventricular junctions,
at which these two layers are coupled, we can also obtain additional focal activity and many complex transient
regimes. We also present additional effects resulting from the coupling of Purkinje and endocardial layers and
discuss the relation of our results to the studies performed in anatomically accurate models of the Purkinje
network.
DOI: 10.1103/PhysRevE.95.022405
I. INTRODUCTION
Spiral waves form and propagate in many excitable media
that include systems with chemical oscillations [1,2], catalysts
on surfaces, for instance, the oxidation of carbon monoxide
on a platinum surface [3,4], and, most important, cardiac
tissue [5,6]. Such spiral waves in cardiac tissue play an
important role in life-threatening cardiac arrhythmias like
ventricular tachycardia and ventricular fibrillation, which are
often associated, respectively, with an unbroken spiral wave
and broken spiral waves of electrical activation in cardiac
tissue [7,8]. Several experimental studies have shown that the
dynamics of cardiac arrhythmias depends not only on wave
propagation in the myocardium, but it is also substantially
affected by wave propagation through the Purkinje network
[9]. However, in experimental studies, the mechanisms of
such influence have neither been clearly identified nor studied,
because of the difficulty in varying parameters like the
Purkinje-myocardium coupling. Therefore, the application of
alternative methods, such as mathematical modeling, to this
problem is of great interest. In this paper, we study the
possible effects of the coupling of human endocardial and
Purkinje cells, at both cellular and two-dimensional tissue
levels, by using detailed ionic models for such cells, and a
minimal model for the Purkinje-fiber network; this minimal
model allows us to explore in detail the dependence of
spiral-wave dynamics, in both endocardial and Purkinje layers,
on the density of Purkinje-ventricular junctions, at which
the Purkinje and endocardial layers are connected in our
model. We show how such couplings, tissue properties, and
the architecture of Purkinje fibers affect spiral-wave dynamics
by using spatiotemporal-chaos theory, nonlinear dynamics,
and cardiac biophysics. As in many nonlinear systems, our
studies show that spiral-wave dynamics depends sensitively
on endocardial cell parameters, the endocardial and Purkinje
coupling, and the spatial distribution of Purkinje-ventricular
junctions.
This paper proceeds as follows: In Sec. II we formulate our
endocardial and Purkinje model, first for a single, composite,
cell and then for two-dimensional tissue; we then give an
overview of our numerical scheme. In Sec. III we present our
numerical studies of spiral-wave dynamics in the endocardial
and Purkinje tissue model. We end with a discussion of our
results in Sec. IV.
II. MODEL
When an endocardial cell and a Purkinje cell in a composite are coupled, via a heterocellular coupling [10,11],
at a Purkinje-ventricular junction site with strength κ, the
transmembrane potentials Ve and Vp for the endocardial
and Purkinje cells, respectively, obey the following ordinary
differential equations:
*
Formerly at Robert Bosch Centre for Cyber Physical Systems,
Division of Interdisciplinary Research, Indian Institute of Science,
Bangalore 560012, India; [email protected]
†
[email protected]
2470-0045/2017/95(2)/022405(11)
022405-1
dVe
= −Iion,e − κ(Ve − Vp ),
dt
dVp
= −Iion,p + κ(Ve − Vp ),
dt
(1)
(2)
©2017 American Physical Society
ALOK RANJAN NAYAK, A. V. PANFILOV, AND RAHUL PANDIT
Purkinje cell
Endocardial cell
Composite
R
2
PHYSICAL REVIEW E 95, 022405 (2017)
TABLE I. Parameter sets P1, P2, and P3 for an endocardial cell
in our model; here, σf is the scale factor of the time constant τf . The
remaining model parameters are the same as in their parent model
[12].
Parameter
GNa
Gkr
Gks
GpCa
GpK
sets
(nS/pF ) (nS/pF ) (nS/pF ) (nS/pF ) (nS/pF ) σf
Dj
Dee
Dpp
FIG. 1. Schematic diagram of a small part of our square simulation domain consisting of endocaridal and Purkinje cells with
R = 2; here R2 is the ratio of the total number of the endocardial (or
Purkinje) cells to the total number of sites where the Purkinje cells are
coupled to the endocardial cells. If R = 1, then every Purkinje cell is
connected directly to the endocardial cell below it. The abbreviations
Dee , Dpp , and Dj stand for diffusion constant in the endocardial
layer, diffusion constant in the Purkinje layer, and coupling strength
between an endocardial cell and a Purkinje cell in our bilayer
domain.
where κ = Dj /z2 provides the coupling strength between
endocardial and Purkinje cells with Dj the gap-junctional
diffusive coupling between these two cells [10,11]; Dj and
z are measured in mm2 /ms and mm, respectively. All the
ionic currents are normalized per unit capacitance, which is,
in our models, the same for the myocytes and the Purkinje
cells [12,13].
We use biophysically realistic ionic models for human
endocardial and Purkinje cells. In particular, we use (a)
the ventricular model developed by ten Tusscher et al. (the
TP06 model) [12], and (b) the Purkinje model developed
by Stewart et al. [13]. The equations for these models,
including the ordinary differential equations for the ionchannel gating variables and the ion dynamics, are given in
Refs. [12,13].
In our two-dimensional (2D) model, we arrange Purkinje
fibers in a sheet [14,15] that lies on top of a layer of
endocardial cells. We allow the Purkinje cells in the top
layer to be connected to the endocardial cells in the bottom
layer at a fraction 1/R2 of the total number of sites. The
connections between endocardial and Purkinje cells are at
periodically spaced points in our simulation domain; these
points are the analogs of Purkinje-ventricular junctions in
our mathematical model; R2 is the ratio of the total number
of sites to the number of Purkinje-ventricular junctions: it
measures the density of Purkinje-ventricular junctions in the
domain. Figure 1 shows a schematic diagram of a portion of
our endocardial and Purkinje composite bilayer with R = 2.
Our 2D, composite, bilayer-tissue model can be thought of
as a very simple approximation for endocardial tissue with
Purkinje fibers embedded on its surface. The simplicity of our
model allows us to examine the dynamics of spiral waves
in much greater detail than has been attempted so far in
any mathematical model for ventricular tissue with Purkinje
fibers.
The transmembrane potentials Ve and Vp of endocardial
and Purkinje cells, respectively, for such a 2D bilayer domain
can be modeled by the following discrete-reaction-diffusion
P1
P2
P3
14.838
5 × 14.838
14.838
0.172
0.153
0.153
0.441
0.392
0.392
0.8666
0.1238
0.1238
0.00219 2
0.0146 1
0.0146 1
equations [16,17]:
Dj (i,k)
∂Ve (i,k)
= −Iion,e (i,k) −
[Ve (i,k) − Vp (i,k)]
∂t
(z)2
Dee
+
[Ve (i + 1,k) − 2Ve (i,k) + Ve (i − 1,k)]
(x)2
Dee
+
[Ve (i,k + 1) − 2Ve (i,k) + Ve (i,k − 1)],
(y)2
(3)
∂Vp (i,k)
Dj (i,k)
= −Iion,p (i,k) +
[Ve (i,k) − Vp (i,k)]
∂t
(z)2
Dpp
+
[Vp (i + 1,k) − 2Vp (i,k) + Vp (i −1,k)]
(x)2
Dpp
+
[Vp (i,k + 1) − 2Vp (i,k) + Vp (i,k−1)],
(y)2
(4)
where Dee and Dpp represent, respectively, diffusion constants
in the endocardial and Purkinje layers. Dj (i,k) represents
coupling between endocardial and Purkinje cells in the bilayer
tissue. At points, in the bilayer tissue, where an endocardial
cell and a Purkinje cell are coupled to each other, its value is
equal to a constant Dj (i,k) = Dj , which is a parameter that
we vary in our simulations as we specify below; these coupling
points are periodically spaced in our simulation domain and at
these points both i and k are divisible by R; at all other points
Dj (i,k) = 0 (Fig. 1).
We use a 2D square domain consisting of two
layers with 1024 × 1024 grid points and lattice spacing
x = y = 0.25 mm, so the side of each square domain is
L = 256 mm; one of these layers contains endocardial cells
and the other Purkinje cells. These two layers are separated
by a distance z = 0.25 mm. We use a forward-Euler method
for the time evolution of the transmembrane potentials with a
time step t = 0.02 ms. We use Neumann (no-flux) boundary
conditions.
In our studies, we use three parameter sets P1, P2, and
P3 (Table I), which yield breakup, pre-breakup, and stable
spiral rotation, respectively, in our 2D endocardial layer (see
below for details). For these studies, we vary the time constant,
τf , for the f gate and the following five ionic conductances
for the endocardial cell [12]; these are (a) GNa for the fast
N a + current, INa , (b) GKr , related to the rapid-delayed
rectifier current of K+ , namely, IKr , (c) GKs , related to the
slow-delayed rectifier current of K+ , namely, IKs , (d) GpCa
for the plateau Ca2+ current, IpCa , and (e) GpK for the plateau
022405-2
SPIRAL-WAVE DYNAMICS IN A MATHEMATICAL MODEL . . .
Vp [mV]
50
(a)
0
−50
−100
0
0.5
1
1.5
2
2.5
2
2.5
κ(Ve−Vp) [pA]
t [s]
0
−0.1
(b)
−0.2
−0.3
0
0.5
1
1.5
t [s]
1.5
(c)
f [hz]
K+ current, IpK . The changes of conductances are related to
the variation of physiological conditions caused because of
either diseases or the effects of the drugs; and the variation
of τf is acceptable because it is related with the calcium
concentration that can be controlled by ryanodine as suggested
in Refs. [18,19].
The heterocellular, myocyte-Purkinje, coupling is always
lower than its homocellular counterparts (i.e., myocytemyocyte and Purkinje-Purkinje diffusive couplings); in particular, Ref. [20] uses a value for Dj that is about 6% of
the homocellular coupling. Therefore, we perform simulations
by varying Dj in the range 0 < Dj 0.1Dee , where Dee =
0.154 mm2 /ms represents the diffusive coupling between
endocardial cells [12].
We use the S1-S2 cross-field protocol [21] to initiate spiral
waves in a square simulation domain of side L = 256 mm.
In this protocol, we apply S1 and S2 stimuli with strengths
150 pA/pF for 3 ms.
To characterize the spiral state in the endocardial layer,
we record the time series of Ve (x,y,t) from 25 sites in the
endocardial simulation domain. For the power spectra E(ω)
of these time series, we use the last 2 × 10⁵ data points out
of 4 × 10⁵ data points to eliminate transients. The final state
of the endocardial layer is decided by analyzing these power
spectra and the spatiotemporal evolution of Ve .
PHYSICAL REVIEW E 95, 022405 (2017)
1
0.5
0
0
0.0005
0.001
0.0015
0.002
0.0025
Djnorm
III. RESULTS
We first describe our results for a composite endocardialPurkinje cell and then for spiral-wave dynamics in 2D square
domain.
A. A composite with an endocardial and a Purkinje cell
Purkinje cells can display autorhythmicity [9] when the
sinoatrial node fails to fire action potentials; occasionally,
premature impulses can be transmitted to the ventricles by
Purkinje fibers if a conduction delay occurs in the atrioventricular node. A Purkinje cell can fire action potential
between 15 and 40 times per minute [22]. Therefore, we
have carried out simulations to examine how the autorhythmic
activity of a Purkinje cell changes, in our composite model
described by Eqs. (1) and (2) in Sec. II, as a function of the
coupling strength Dj between the endocardial and Purkinje
cells. In Fig. 2 we show autorhythmic-activity dynamics of a
Purkinje cell in a composite; here squares () and triangles
() represent coupled Purkinje cells with Dj = 0.001Dee
and Dj = 0.003Dee , respectively, and circles ( ) are for
an uncoupled Purkinje cell. Figure 2(a) shows plots of the
Purkinje transmembrane potential Vp in a composite. We
see that, at a coupling of Dj = 0.001Dee , the frequency of
autorhythmic activity decreases; and at Dj = 0.003Dee it is
eliminated. The mechanism behind this effect is illustrated
in Fig. 2(b), which shows the current κ(Ve − Vp ) between
endocardial and Purkinje cells. We see that this current is
negative and the endocardial cell in this composite acts like
a current sink. An increase in the coupling Dj increases this
sink effect, and, at Dj = 0.003Dee , it eliminates autorhythmic
activity. Figure 2(c) shows the dependence of the frequency f
of the autorhythmic activity on the coupling Djnorm = Dj /Dee .
We observe that f decreases as Dj increases and, finally, the
FIG. 2. Autorhythmic activity of a Purkinje cell in an endocardialPurkinje composite; here squares () and triangles () represent
coupled Purkinje cells with Dj = 0.001Dee and Dj = 0.003Dee ,
respectively, and circles ( ) denote data points from an uncoupled
Purkinje cell. (a) Plots of the Purkinje action potential Vp in a
composite. (b) Plots of the current κ(Ve − Vp ) between endocardial
and Purkinje cells; such plots show that the endocardial cell in this
composite acts like a current sink. (c) Plots of the frequency f of the
autorhythmic activity of the Purkinje cell in a composite versus the
coupling Djnorm = Dj /Dee . Note that f decreases as Dj increases,
and, finally, autorhythmicity is eliminated after Dj 0.0021Dee .
Purkinje cell in a composite loses its autorhythmic activity
after Dj 0.0021Dee .
We study the action-potential behaviors of endocardial and
Purkinje cells in a composite by exciting (1) an endocardial
cell and (2) a Purkinje cell, as investigated by Huelsing et al.
[10,11] in their in vitro studies on a rabbit Purkinje cell, which
they couple to a ventricular myocyte by an electronic circuit. To
initiate action potentials, we apply a current pulse of strength
52 pA/pF to one of the cells of the composite or both for 3
ms. We also compute the conduction-delay time (t) from
the endocardial to the Purkinje cell, or vice versa, during the
onset of such action potentials. Figure 3(a) shows plots of
the Purkinje action potential Vp and the endocardial action
potential Ve when the stimulus is applied to the endocardial cell
with Dj = 0.01Dee (, ). We also compare action potentials
in uncoupled cells Dj = 0 ( , ). Figure 3(b) shows the
same plot when the stimulus is applied to the Purkinje cell.
In all cases, we find a delay between the excitation of the
cells. However, for endocardial stimulation, this delay is
022405-3
ALOK RANJAN NAYAK, A. V. PANFILOV, AND RAHUL PANDIT
PHYSICAL REVIEW E 95, 022405 (2017)
100
100
(a)
(b)
50
Vp, Ve [mV]
Vp, Ve [mV]
50
0
100
50
−50
0
100
50
−50
0
0
−50
−50
−100
50
54
−100
50
58
−100
0
100
200
300
400
0
100
t [s]
90
200
300
400
t [s]
150
150
150
100
50
(c)
100
Δt [ms]
Δt [ms]
70
−100
50
50
0
0
0.001
0.002
0
(d)
100
30
50
10
0.009
0.01
0.011
0
0
0.02
0.04
0.06
0.08
0.1
0
Djnorm
0.02
0.04
0.06
0.08
0.1
Djnorm
FIG. 3. Action potentials for endocardial and Purkinje cells in a composite and their conduction-delay times t. (a) Plots of the action
potentials Vp ( or ) and Ve ( or ), when a stimulus is applied to both uncoupled endocaridal and Purkinje cells, i.e., Dj = 0 ( , )
and the endocardial cell in our composite with Dj = 0.01Dee (, ). (b) Plots as in (a), but with a stimulus applied to the Purkinje cell in our
composite. Insets in (a) and (b) show the depolarization phases of action potentials on an expanded scale; these inset plots show the conduction
delay from an endocardial to a Purkinje cell, or vice versa, depending on whether the stimulus is applied to an endocardial cell or to a Purkinje
cell in a composite. Such inset plots show that, for a given value of Dj , the conduction delay time is more when the stimulus is applied to the
Purkinje cell than when it is applied to the endocardial cell in a composite. (c) Plots of the conduction-delay time t from the endocardial to
the Purkinje cells versus Djnorm = Dj /Dee , when the stimulus is applied to the endocaridal cell of a composite. (d) Plots as in (c) but of the
conduction delay from the Purkinje to the endocardial cell, when the stimulus is applied to the Purkinje cell of a composite. Insets in (c) and (d)
show the plots of such delay on an expanded time scale; these insets also show that, as we decrease Dj , the failure of the initiation of the action
potential in a Purkinje cell, when the stimulus is applied to the endocardial cell in a composite, occurs earlier than it does when the stimulus is
applied to the Purkinje cell in a composite.
substantially smaller. Such asymmetry in the delay arises
because of the different physiological properties of endocardial
and Purkinje cells; in particular, the threshold of a Purkinje
cell is lower than that of an endocardial cell, as suggested by
Huelsing et al. [10]. This delay as a function of the coupling
strength Djnorm = Dj /Dee is shown in Fig. 3(c) for epicardial
stimulation and in Fig. 3(d) for Purkinje-cell stimulation. Insets
show the plots on an expanded time scale. We see that not only
are the delays with Purkinje stimulation larger than those with
endocardial stimulation, but also the failure of transmission
occurs more easily for the case of Purkinje stimulation. Our
results on delays and the propagation block of the AP are in
qualitative agreement with those of Huelsing et al. [10] and
ten Tusscher et al. [23].
The restitution of the action potential duration plays an
important role in the stability of spiral waves [24–26]. It
has been shown, in both experimental and numerical studies
[24–27], that a steep slope of the action-potential-durationrestitution (APDR) curve, a plot of the action potential duration
(APD) versus the diastolic interval (DI), leads to spiral-wave
instability. Therefore, we carry out a set of simulations to
obtain such a plot for the endocardial cell in a composite
for different values of the coupling strength Dj (Fig. 4) for
three parameter sets P1, P2, and P3, which we use later to
study spiral-wave dynamics in two dimensions, corresponding
to breakup, prebreakup, and a stable spiral, respectively. We
see that for all parameter sets, represented in Figs. 4(a)–4(c),
coupling to the Purkinje cell decreases the slope of the
restitution curve. Therefore, we expect that spiral-wave dynamics in the endocardial layer can be stabilized by the
inclusion of Purkinje fibers. However, this dependence is not
monotonic: for strong coupling () Dj = 0.1Dee , the slope is
less steep than for intermediate coupling () Dj = 0.01Dee ,
as compared with an uncoupled endocardial cell ( ).
B. Wave dynamics in a two-dimensional domain
Before we start our investigation of spiral-wave dynamics in
bilayers, we present, for subsequent comparisons, spiral waves
in isolated endocardial and Purkinje layers. In Figs. 5(a)–5(c)
we show pseudocolor plots of the endocardial transmembrane
potential Ve , in a 2D domain, for the parameter sets P1, P2,
022405-4
SPIRAL-WAVE DYNAMICS IN A MATHEMATICAL MODEL . . .
(a)
(b)
(c)
1
200
0
1
100
200
300
400
100
200
300
400
100
400
200
300
400
DI [ms]
100
300
0
DI [ms]
100
200
1
0
0
DI [ms]
100
200
0
0
0
2
APD/DI
200
2
APD/DI
APD/DI
2
300
APD [ms]
300
APD [ms]
300
APD [ms]
PHYSICAL REVIEW E 95, 022405 (2017)
100
0
100
DI [ms]
200
DI [ms]
300
400
0
100
200
300
400
DI [ms]
FIG. 4. Action potential duration restitution (APDR) and its slope for an endocardial cell in a composite with different sets of endocardial
parameters; here circles ( ) represent an uncoupled endocardial cell, and squares () and triangles () are used, respectively, for an endocardial
cell in a composite with Dj = 0.01Dee and Dj = 0.1Dee . The plots in (a), (b), and (c) show the APDR for parameter sets P1, P2, and P3 (see
Table I), respectively; inset plots show the slopes of the APDR curve. The steepness of the APDR curve decreases, for all the parameter sets,
as we increase Dj in a composite. The maximum slopes of the APDR are 2.0, 1.1, and 1.1, for an uncoupled endocardial cell ( ) with
parameter sets P1, P2, and P3, respectively; however, the maximum slope of the APDR for an endocardial cell in a composite decreases as
Dj increases (,) because of the coupling to the Purkinje cell.
and P3, respectively; and in Fig. 5(d), we show pseudocolor
plot of the transmembrane potential of the Purkinje layer Vp
for the diffusive coupling Dpp = 3Dee . Such a threefold increment in Purkinje diffusion coefficient gives a biophysically
reasonable value of conduction velocity, CV 2.1 mm/ms,
in the Purkinje fibers as suggested in Refs. [28,29]. In
Figs. 5(e)–5(g) we show, respectively, the time series for the
parameter sets P1, P2, and P3, recorded from a representative
FIG. 5. Spiral-waves dynamics in isolated endocardial and Purkinje 2D simulation domains. Pseudocolor plots of the transmembrane
potential Vm for the endocardial layer with parameter sets (a) P1, (b) P2, and (c) P3, and (d) the Purkinje layer. Panels (e), (f), and (g) show,
respectively, the time series for the parameter sets P1, P2, and P3, recorded from a representative point (x = 125 mm,y = 125 mm) that is
marked by an asterisk in (a), (b), and (c); (h) the time series recorded from Purkinje layer, marked by an asterisk in (d). (i), (j), (k), and (l)
show power spectra calculated by using these time series (see Methods for the lengths of time series). The irregular time series in (e) and the
broad-band nature of the power spectrum in (i) are characteristic of a spiral-turbulence (ST) state in the endocardial layer with the parameter set
P1; the pseudocolor plot in (a) shows that this ST state is maintained by multiple waves, i.e., it is a multiple-spiral-turbulence (MST) state. For
the parameter set P2, the irregular time series in (f) and the development of subsidiary peaks in E(ω) in (j) confirm that the temporal evolution
of the state is chaotic; the pseudocolor plot in (b) shows the existence of single, meandering, spiral turbulence (SMST), in which the spiral arms
and core evolve chaotically in space and time. The pseudocolor plot in (c) shows a rotating spiral (RS) for the parameter set P3; the periodic time
series in (g) and the discrete, strong peaks in E(ω) at 4.75 Hz and its harmonics in (k) provide evidence of a single-rotating-spiral-periodically
(SRSP) for the parameter set P1. The peudocolor plot in (d), the periodic time series in (h), and discrete peaks in the power spectrum, with
fundamental frequency ωf 2.75 Hz in (l), show the existence of an SRSP in the Purkinje layer.
022405-5
ALOK RANJAN NAYAK, A. V. PANFILOV, AND RAHUL PANDIT
point (x = 125 mm, y = 125 mm), marked by asterisks in
Figs. 5(a)–5(c); and in Fig. 5(h) we show the time series of
Vp (x,y,t). In Figs. 5(i)–5(l) we show plots of the power spectra
E(ω), which we have obtained from the local time series of
Vm . The irregular time series in Fig. 5(e) and the broad-band
nature of the power spectrum in Fig. 5(i) are characteristic of
a spiral-turbulence (ST) state in the endocardial layer with the
parameter set P1; the pseudocolor plot in Fig. 5(a) shows that
this ST state is maintained by multiple waves, so we refer to it
as a multiple-spiral-turbulence (MST) state. For the parameter
set P2, the irregular time series in Fig. 5(f) and broad-band
nature of the power spectrum in Fig. 5(j) confirm that the
temporal evolution of the state is chaotic; the pseudocolor plot
in Fig. 5(b) shows the existence of single, meandering, spiral,
in which the spiral arms and core evolve chaotically in space
and time; therefore, we call this a single-meandering-spiralturbulence (SMST) state. For the parameter set P3, the plot
of Ve in Fig. 5(c) shows a single, rotating spiral; the periodic
nature of the time series in Fig. 5(g) and the discrete, strong
peaks in E(ω) at the fundamental frequency ωf = 4.75 Hz
and its harmonics in Fig. 5(k) provide additional evidence for
the periodic motion of this spiral wave; therefore, we refer to
this as a single-rotating-spiral-periodically (SRSP) state. The
pseudocolor plot in Fig. 5(d) shows the existence of a rotating
spiral in an isolated Purkinje layer. The power spectrum E(ω)
in Fig. 5(l) has discrete peaks at the fundamental frequency
ωf = 2.75 Hz and its harmonics. The resulting periodic time
series [Fig. 5(h)] and the discrete peaks in the power spectrum
give additional evidence for the existence of an SRSP state in
an isolated Purkinje layer.
We now carry out a set of simulations to study the
spatiotemporal evolutions of spiral waves, for the parameter
sets P1, P2, and P3, when an endocardial layer is coupled
with a Purkinje layer, with Dj and R in the ranges mentioned
above. We obtain spiral waves in our composite bilayer by
using the S1–S2 protocol in the endocardial layer.
In Figs. 6(a)–6(c) we show, respectively, pseudocolor plots
of Ve in the endocardial layer for the parameter set P1
with Dj = 0.1Dee and R = 1, 2, and 4; similar plots are
shown in Figs. 6(d)–6(f) for Vp in the Purkinje layer. These
psuedocolor plots of Ve show the existence of an SRSP state
in the endocardial layer of our composite bilayer for R = 1
[Fig. 6(a)] and R = 2 [Fig. 6(b)]; however, for R = 4, we
observe a state with spiral absorption (SA) in the endocardial
layer of this composite bilayer [Fig. 6(c)]. In the absence
of a Purkinje layer, an isolated endocardial layer with the
parameter set P1 displays an MST state as shown in Fig. 5(a).
An MST-SRS transitions occurs, in the presence of a Purkinje
layer, because of the suppression of the steep slope of the
APDR of a myocyte in a composite [see Fig. 4(a)]. We record
the local time series for Ve and Vp from the representative
points, in both endocardial and Purkinje layers, marked by
asterisks in Figs. 6(a)–6(f); in Figs. 6(g)–6(i), we show these
time series for Ve ( ) and Vp ( ), which lead to the plots
of E(ω) versus ω shown by
(endocardial layer) and
(Purkinje layer) in Figs. 6(j)–6(k). The plots of the time series,
in Figs. 6(g)–6(h), and power spectra, in Figs. 6(j)–6(k),
show the existence of a single-rotating-spiral state in both
endocardial and Purkinje layers; the estimated fundamental
PHYSICAL REVIEW E 95, 022405 (2017)
frequencies in both types of layers are ωe = ωp 4.75 Hz
and ωe = ωp 4.75 Hz for R = 1 and 2, respectively. Two
features are worth noting here: (1) the time series of Ve and
Vp display synchrony, insofar as they show a train of action
potentials that are in phase in the two layers, and (2) the width
of the spiral-wave arms decreases as R increases. For R = 4,
we observe an SA state in both endocardial and Purkinje layers
of our bilayer as shown in the pseudocolor plots in Figs. 6(c)
and 6(f). The time series in Fig 6(i) shows additional evidence
for the disappearance of spiral waves in both the endocardial
and Purkinje layers simultaneously at time t 5.7 s. Such an
ST state is observed because of the termination of a single,
nonstationary spiral, whose core is not stable, by collision
with one of the boundaries of the domain. However, for the
same parameter set, we may not observe an SA state if we
alter the spiral initiation process by changing the timing of the
S2 stimulus in the S1–S2 protocol. Note that an MST state
in an isolated endocardial layer [cf. Fig. 5(a)] is converted
to an SRSP or an SA state by the inclusion of Purkinje
cells.
In Fig. 7 we show the counterpart of Fig. 6 for R =
8, 16,and 32 and the parameter set P1. In the left panel of
Fig. 7, we show the pseudocolor plots of Ve [Fig. 7(a)] and
Vp [Fig. 7(d)], the local time series [Fig. 7(g)], and the power
spectrum [Fig. 7(j)] for the parameter set P1 and R = 8. The
irregular time series of Ve ( ) in Fig. 7(g) and the broad-band
nature of the power spectra ( ) in Fig. 7(j) show that the
temporal evolution of Ve is chaotic. Therefore, we confirm the
presence of an MST in the endocardial layer of the bilayer, as
shown by the pseudocolor plot in Fig. 7(a). Note that an MST
state in an isolated layer still remains in the MST state on
the inclusion of Purkinje system; this is because of the sparse
distribution of connectivity (large R) between the endocardial
and Purkinje layers of our bilayer. However, Fig. 7(d) shows
that the Purkinje layer displays periodic focal-wave activity,
because of an MST state in the endocardial layer of the bilayer.
The time series of Vp ( ) in Fig. 7(g) and the power spectra
( ) in Fig. 7(j) show additional evidence of such periodic
wave activity in the Purkinje layer. We find that the frequency
of such periodic focal-wave activity is ωp 2.35 Hz; this
frequency is close to its value in an uncoupled Purkinje layer
[see Fig. 5(l)]. Plots similar to those in the left panel of Fig. 7,
for P3 with R = 16 and R = 32, are shown, respectively,
in the middle and right panels of Fig. 7. The pseudocolor
plots in Figs. 7(b) and 7(c), the local time series of Ve ( ) in
Figs. 7(h) and 7(i), and the power spectra of this time series in
Figs. 7(k) and 7(l) show that the spiral state in the endocardial
layer of the bilayer is an MST state. However, we still see
periodic focal-wave activity in the Purkinje layer of the bilayer
as shown in the pseudocolor plots in the Figs. 7(e) and 7(f),
the periodic time series of Vp ( ) in Figs. 7(h) and 7(i), and
discrete peaks in the power spectra ( ) in Figs. 7(k) and 7(l).
We estimate the fundamental frequencies for the focal-wave
activity in the Purkinje layer of the bilayer are ωp 2.0 Hz
and ωp 1.5 Hz for R = 16 and 32, respectively. Note that
the focal-wave frequency decreases as R increases, as shown
by the power spectra in Figs. 7(j)–7(l) ( ). Furthermore, note
that an MST state in an isolated layer with R 8 still remains
in the MST state on the inclusion of the Purkinje system.
022405-6
SPIRAL-WAVE DYNAMICS IN A MATHEMATICAL MODEL . . .
PHYSICAL REVIEW E 95, 022405 (2017)
FIG. 6. Spiral-wave dynamics in our composite bilayer for the P1 parameter set for the endocardial cells with Dj = 0.1Dee and R = 1 (left
column), R = 2 (middle column), and R = 4 (right column). The first row shows pseudocolor plots of the endocardial layer transmembrane
potential Ve ; the plots in the second row are the exact analogs of these for the Purkinje-layer transmembrane potential Vp . The third row
shows plots of the time series for Ve ( ) and Vp ( ), which are recorded from the representative points (x = 125 mm, y = 125 mm), in both
endocardial and Purkinje layers; these are marked by asterisks in (a) to (f). The fourth row shows plots of the power spectra E(ω) versus the
frequency ω for the endocardial layer ( ) and the Purkinje layer ( ). A multiple-spiral-turbulence (MST) state in an isolated enocardial layer
[Fig. 5(a)] is converted to a single-rotating-spiral-periodic (SRSP) state, as shown in (a) and (b), or a spiral-absorption (SA) state, as shown
in (c), by the inclusion of Purkinje cells. The periodic time series in (g) and (h) and the regular peaks in the power spectra in (j) and (k) give
additional evidence of the existence of such SRSP states in the endocardial layer with R = 1 and 2. The time series of Ve and Vp in (i) provides
evidence for the disappearance of spiral waves in both the endocardial and Purkinje layers simultaneously at time t 5.7 s for R = 4.
We also focus on spiral-wave dynamics in the bilayer for
the parameter sets P2 and P3 when an endocardial layer is
coupled with a Purkinje layer with Dj and R in the ranges
mentioned above. With the P2 parameter set, we find that an
SMST state in an isolated endocardial layer is converted to a
single-rotating-spiral-periodic (SRSP) state, a single-rotatingspiral-quasiperiodic (SRSQ) state, a single-meandering-spiralturbulence (SMST) state, a multiple-spiral-turbulence (MST)
state, or a state with spiral-absorption (SA) by the inclusion of
Purkinje cells. We find that the SRSP state, which we obtain
for an isolated endocardial layer with the parameter set P3,
can lead to a transition to one of the above spiral states. We
present below details of the spiral states in the endocardial
layer of the bilayer with parameter sets P1, P2, and P3, and
Dj and R in the ranges mentioned above.
In Figs. 8(a)–8(c) we show, respectively, the various
spiral states for the parameter sets P1, P2, and P3, as we
vary (1) the normalized endocardial and Purkinje coupling
parameters Djnorm (i.e., Djnorm = Dj /Dee ) and (2) the number
of Purkinje-ventricular junctions, which we measure by R.
Here circles ( ), triangles (), diamonds ( ), pentagrams
(), and squares () represent, respectively, an SRSP, an
SRSQ, an SMST, an MST, and an SA state. In the absence of
the Purkinje-fiber layer, the endocardial layer displays an MST,
an SMST, and an SRSP state, respectively, for the P1, P2,
and P3 parameter sets. These stability diagrams display the
sensitive dependence of spiral-wave dynamics on (1) myocyte
parameters (in terms of parameter sets P1, P2, and P3), (2) the
endocardial and Purkinje coupling parameters Dj , and (3) the
number of Purkinje-ventricular junctions, which we measure
by R. Such sensitive dependence of the dynamics on system
parameters arises from the underlying spatiotemporal chaos in
the partial-differential-equation model that we use for cardiac
tissue.
IV. DISCUSSION AND CONCLUSIONS
Our study is the first one that uses human ionic models
of ventricular and Purkinje cells. This is important because,
in human tissue, the action-potential duration in the Purkinje
022405-7
ALOK RANJAN NAYAK, A. V. PANFILOV, AND RAHUL PANDIT
PHYSICAL REVIEW E 95, 022405 (2017)
FIG. 7. Spiral-wave dynamics in our composite bilayer for the P1 parameter set for the endocardial cells with Dj = 0.1Dee and R = 8
(left column), R = 16 (middle column), and R = 32 (right column); this figure is the analog of Fig. 6. An MST state in an isolated endocardial
layer [Fig. 5(a)] still remains in the MST state on the inclusion of Purkinje cells, as shown by the pseudocolor plots of Ve in (a)–(c). The
irregular time series obtained from a representative point in the endocardial layer [marked by asterisks in (a) to (f)] in (g)–(i) ( ) and the
broad-band power spectra of such time series in (j)–(l) ( ) confirm the existence of such MST states in the endocardial layer of our composite
bilayer. However, the Purkinje layer in the composite bilayer shows focal-wave activations as shown in the pseudocolor plots of Vp in (d)–(f);
such focal-wave activity occurs periodically as shown by the time-series plots in (g)–(i) ( ); and the focal-wave frequency decreases as R
increases, as shown by the power spectra in (j)–(l) ( ).
network is almost the same as Ref. [30] or even shorter than
that in the ventricular cells; this is different from, e.g., the rabbit
cells used in Behradfar et al. [31], and the canine cells used in
Cherry et al. [32], where the action potential in the Purkinje
network is significantly longer than that in the myocardium.
We have coupled a Purkinje cell to an endocardial cell to
study the morphology of the AP of both cells as investigated
by Huelsing et al. [10,11]. Huelsing et al. have coupled in vitro
a rabbit Purkinje cell to a ventricular myocyte by an electronic
circuit. Our results on the delays in endocardial and Purkinje
cells are in qualitative agreement with those of Refs. [10,23]. In
particular, we have found that the delays are small if we apply
a stimulus to the endocardial cell, and much longer if we apply
it to the Purkinje cell. Such a delay increases as we decrease
the diffusive coupling and eventually a failure of transmission
occurs. Our studies have also revealed that the slope of the
action-potential-duration-restitution curve of an endocardial
cell can be lowered by coupling it with a Purkinje cell.
We use a simple regular Purkinje network compared to
the detailed models of Refs. [31–34]. The simplicity of our
minimal model for the Purkinje system has enabled us to study
in detail various types of wave dynamics over a wide range
of coupling strengths and junction densities. Such a study has
not been carried out so far. Therefore, our results complement
those that have been obtained with realistic models.
The effects of such a regular network have also been used in
the context of neural-network systems to study electrical-wave
activation [35–37]. In particular, recent studies by Ma et al.
[37] have used a two-dimensional square array with nearestneighbor interactions to study defect-induced electrical-wave
propagation in a neural network.
Bordas et al. [34] have carried out numerical simulations
of electrical activation in ventricles, with a realistic, freerunning, Purkinje-network system and the bundle of His, and a
rabbit-ventricular model in an anatomically detailed geometry,
obtained from a high-resolution, magnetic-resonance data
set. These authors have shown that the inclusion of the
Purkinje system results in slightly faster and more coordinated
activation of the ventricles than in a simple, ventricular model.
Our studies produce similar results: multiple-spiral-turbulence
and meandering-spiral-turbulence states disappear when we
couple the Purkinje and endocardial layers with a high density
022405-8
SPIRAL-WAVE DYNAMICS IN A MATHEMATICAL MODEL . . .
(b)
32
32
16
16
8
8
R
R
(a)
4
4
2
2
1
01 .02 .04 .06 .08 .10
.
0
0
0
0
0
0
Djnorm
1
01 .02 .04 .06 .08 .10
.
0
0
0
0
0
0
Djnorm
(c)
SRSP
SRSQ
SMST
MST
SA
32
R
16
8
4
2
1
01 .02 .04 .06 .08 .10
0
0
0
0
0
0.
Djnorm
FIG. 8. The dependence of spiral-wave dynamics on (i) myocyte parameters, (ii) normalized endocardial and Purkinje coupling
parameters Djnorm (i.e., Djnorm = Dj /Dee ), and (iii) the number of
Purkinje-ventricular junctions, which we measure by R. (a) This
stability diagram displays various spiral states in the Djnorm and R
parameter space for the P1 myocyte parameters; circles ( ), triangles
(), diamonds ( ), pentagrams (), and squares () represent,
respectively, a single-rotating-spiral-periodic (SRSP) state, a singlerotating-spiral-quasiperiodic (SRSQ) state, a single-meanderingspiral-turbulence (SMST) state, a multiple-spiral-turbulence (MST)
state, and a state with spiral-absorption (SA); in the absence of the
Purkinje-fiber layer, the endocardial layer displays an MST state.
Panels (b) and (c) are the exact analogs of (a), but for the P2 and
P3 parameter sets, respectively, for endocardial cells. An isolated
endocardial layer displays SMST and SRSP states, respectively, for
the P1 and P2 parameter sets.
of junctions (low values of R; see Figs. 6 and 8). Cherry
et al. [32] have investigated electrical-wave propagation in a
2D canine ventricular tissue model coupled with a Purkinje
system. Their study has shown that the Purkinje network can
either terminate or promote wave breakup. Our studies have
shown that the Purkinje layer can eliminate spiral waves in both
endocardial and Purkinje layers depending on the initial conditions and interlayer coupling strength and density (Fig. 8).
In addition, we observe focal waves, in the Purkinje layer, that
enhance spiral-wave dynamics in the endocardial layer.
Studies by Behradfar et al. [31] have used a fractal
method to develop a Purkinje-fiber network in an anatomically
realistic rabbit-ventricular model with a biophysically realistic
description of ion-channel dynamics and a bidomain model.
This study has been motivated by the experimental study of
ablation on the Purkinje network and its effect on the dynamics
of ventricular fibrillation [38]. The authors have investigated
the effects of the Purkinje-myocardium coupling strength and
the Purkinje-ventricular junction density on reentry dynamics
PHYSICAL REVIEW E 95, 022405 (2017)
in their model. They have observed that, for large junctional
resistances, an increase in the Purkinje-ventricular junction
density increases the mean firing rate in the Purkinje system,
the fraction of successful retrograde conduction at Purkinjeventricular junctions, and the incidence of wave break on the
epicardium; but the mean firing of the ventricles is unchanged.
Clear trends do not emerge if the junctional resistances are
low. Our studies show that the firing rate of the Purkinje layer
of the bilayer increased as the density of junctions is increased
(Fig. 7); this is consistent with the studies by Behradfar
et al. [31]. However, the probability of spiral breakup in
the endocardial layer of a composite bilayer decreases as
we increase the density of junctions (Fig. 8). This can be
explained by analyzing the plots in Fig. 4, where we observe
that the slope of the action-potential-duration-restitution plots
of an endocardial cell, in a composite, decreases as the
junctional strength increases. There is an additional decrease
when we increase the density of junctions between Purkinje
and endocardial layers. Therefore, we do not observe spiral
breakup for high densities of junctions.
Our observations from our numerical studies are consistent
with in vitro studies [38–40]. For example, Arnar et al. [39]
have studied the origin of focal electrical activities that lead
to ventricular tachycardia, in canine cardiac tissue, by using
an activation-mapping technique. They have shown that in
more than 60% of the cases of such ventricular tachycardia
originate from the Purkinje-fiber system. In most cases, we
find that the spiral waves in the endocardial layer change
significantly when the endocardial layer is coupled to the
Purkinje network. Studies by Tabereaux et al. [40] have shown
that electrical activation can appear focally in the endocardial
layer of a canine heart because of autorhythmic activities in
the Purkinje system; such focal activation in the endocardial
layer may help to produce abnormal or trigger activities,
which can maintain preexisting ventricular fibrillation in the
ventricular myocardium. In our composite-bilayer studies, we
also observe autorhythmic excitation in the Purkinje layer for
low densities of junctions (Fig. 7); and these excitations also
disturb wave patterns in the endocardial layer.
The methods of nonlinear dynamics that we use help us
to elucidate the spatiotemporal evolution of wave activation
in our model for endocardial and Purkinje-fiber layers.
In particular, we find sensitive dependence of spiral-wave
dynamics on myocyte cell parameters and Purkinje-myocyte
coupling conditions, in terms of both the diffusive coupling
and the spatial distribution of Purkinje-ventricular junctions
(see Fig. 8). Such sensitive dependence of the dynamics on
system parameters is a signature of spatiotemporal chaos
[6,41]; this sensitive dependence has not been explored
hitherto in any mathematical model with coupled Purkinje
fibers and myocytes in cardiac tissue. Furthermore, our study
highlights the challenging, nonlinear-dynamics problems that
can be found in cardiac-tissue models, whose study is of
direct relevance to life-threatening cardiac arrhythmias. The
detailed application of the methods of nonlinear dynamics
to myocyte-Purkinje fiber systems, which we have presented
here, can be extended to realistic models for cardiac tissue
with, e.g., bidomain models [42,43], muscle-fiber orientation [44,45], and anatomical realistic simulation domains
[46,47].
022405-9
ALOK RANJAN NAYAK, A. V. PANFILOV, AND RAHUL PANDIT
In our spiral-wave studies, we have used a square simulation
domain whose linear size is larger than that of a typical human
heart. Such a large simulation domain is required, as used
in other studies [6,12], to avoid the frequent termination of
spiral waves by collisions with the boundaries of the simulation
domain. However, a domain of size comparable to a typical
human heart can be used to get the same qualitative dynamics,
but then only by using a scaling factor as suggested in
Refs. [48–51].
[1] A. Zaikin and A. Zhabotinsky, Nature (London) 225, 535 (1970).
[2] K. Agladze, V. Krinsky, and A. Pertsov, Nature (London) 308,
834 (1984).
[3] M. Bär, N. Gottschalk, M. Eiswirth, and G. Ertl, J. Chem. Phys.
100, 1202 (1994).
[4] A. Pande and R. Pandit, Phys. Rev. E 61, 6448 (2000).
[5] R. R. Aliev and A. V. Panfilov, Chaos Solitions Fractals 7, 293
(1996).
[6] T. Shajahan, A. R. Nayak, and R. Pandit, PLoS One 4, e4738
(2009).
[7] R. A. Gray, A. M. Pertsov, and J. Jalife, Nature (London) 392,
75 (1998).
[8] J. Jalife, R. A. Gray, G. E. Morley, and J. M. Davidenko, Chaos
8, 79 (1998).
[9] M. E. Mangoni and J. Nargeot, Physiol. Rev. 88, 919 (2008).
[10] D. J. Huelsing, K. W. Spitzer, J. M. Cordeiro, and A. E. Pollard,
Am. J. Physiol.-Heart Circ. Physiol. 274, H1163 (1998).
[11] D. J. Huelsing, K. W. Spitzer, J. M. Cordeiro, and A. E. Pollard,
Am. J. Physiol.-Heart Circ. Physiol. 276, H572 (1999).
[12] K. Ten Tusscher and A. Panfilov, Am. J. Physiol.-Heart Circ.
Physiol. 291, H1088 (2006).
[13] P. Stewart, O. V. Aslanidi, D. Noble, P. J. Noble, M. R. Boyett,
and H. Zhang, Phil. Trans. R. Soc. A 367, 2225 (2009).
[14] P. W. Oosthoek, S. Viragh, W. Lamers, and A. Moorman, Circ.
Res. 73, 482 (1993).
[15] J. Tranum-Jensen, A. Wilde, J. Vermeulen, and M. Janse, Circ.
Res. 69, 429 (1991).
[16] A. V. Panfilov, Phys. Rev. Lett. 88, 118101 (2002).
[17] A. R. Nayak, T. Shajahan, A. Panfilov, and R. Pandit, PloS One
8, e72950 (2013).
[18] H. Sun, N. Leblanc, and S. Nattel, Am. J. Physiol.-Heart Circ.
Physiol. 272, H1625 (1997).
[19] J. J. Mackrill, Biochem. Pharmacol. 79, 1535 (2010).
[20] I. Schafferhofer-Steltzer, E. Hofer, D. J. Huelsing, S. P. Bishop,
and A. E. Pollard, IEEE Trans. Biomed. Eng. 52, 1522
(2005).
[21] A. R. Nayak and R. Pandit, Front. Physiol. 5, 207 (2014).
[22] C. Porth, Essentials of Pathophysiology: Concepts of Altered
Health States (Lippincott Williams & Wilkins, Philadelphia,
PA, 2011).
[23] K. Ten Tusscher and A. Panfilov, Prog. Biophys. Mol. Biol. 96,
152 (2008).
[24] F. H. Fenton, E. M. Cherry, H. M. Hastings, and S. J. Evans,
Chaos 12, 852 (2002).
[25] A. Garfinkel, Y.-H. Kim, O. Voroshilovsky, Z. Qu, J. R. Kil,
M.-H. Lee, H. S. Karagueuzian, J. N. Weiss, and P.-S. Chen,
Proc. Natl. Acad. Sci. USA 97, 6061 (2000).
PHYSICAL REVIEW E 95, 022405 (2017)
ACKNOWLEDGMENTS
We thank the Council for Scientific and Industrial Research
(CSIR), Department of Science and Technology (DST),
and University Grants Commission (UGC), India, and the
Robert Bosch Centre for Cyber Physical Systems (IISc) for
support, and the Supercomputer Education and Research
Centre (SERC, IISc) for computational resources. A.V.P. and
R.P. acknowledge support under the Utrecht-Asia Visiting
Professor Programme of the University of Utrecht.
[26] Z. Qu, J. N. Weiss, and A. Garfinkel, Am. J. Physiol.-Heart Circ.
Physiol. 276, H269 (1999).
[27] A. Karma, Chaos 4, 461 (1994).
[28] D. Durrer, R. T. Van Dam, G. Freud, M. Janse, F. Meijler, and
R. Arzbaecher, Circulation 41, 899 (1970).
[29] R. E. Ideker, W. Kong, and S. Pogwizd, Pacing Clin. Electrophysiol 32, 283 (2009).
[30] F.-Y. Lee, J. Wei, J.-J. Wang, H.-W. Liu, T.-C. Shih, and C.-I.
Lin, J. Heart Lung Transplant. 23, 737 (2004).
[31] E. Behradfar, A. Nygren, and E. J. Vigmond, PloS One 9, e88000
(2014).
[32] E. M. Cherry and F. H. Fenton, Nonlin. Dyn. 68, 365
(2012).
[33] O. V. Aslanidi, P. Stewart, M. R. Boyett, and H. Zhang, Biophys.
J. 97, 20 (2009).
[34] R. Bordas, K. Gillow, Q. Lou, I. Efimov, D. Gavaghan, P. Kohl,
V. Grau, and B. Rodriguez, Prog. Biophys. Mol. Biol. 107, 90
(2011).
[35] K. Arai, E. L. Keller, and J. A. Edelman, Neural Netw. 7, 1115
(1994).
[36] S. E. Folias and P. C. Bressloff, Phys. Rev. Lett. 95, 208107
(2005).
[37] J. Ma, Y. Xu, J. Tang, and C. Wang, Comm. Nonlin. Sci. Numer.
Simul. 34, 55 (2016).
[38] D. J. Dosdall, P. B. Tabereaux, J. J. Kim, G. P. Walcott, J. M.
Rogers, C. R. Killingsworth, J. Huang, P. G. Robertson, W. M.
Smith, and R. E. Ideker, Am. J. Physiol.-Heart Circ. Physiol.
295, H883 (2008).
[39] D. O. Arnar, J. R. Bullinga, and J. B. Martins, Circulation 96,
2421 (1997).
[40] P. B. Tabereaux, G. P. Walcott, J. M. Rogers, J. Kim,
D. J. Dosdall, P. G. Robertson, C. R. Killingsworth,
W. M. Smith, and R. E. Ideker, Circulation 116, 1113
(2007).
[41] T. K. Shajahan, S. Sinha, and R. Pandit, Phys. Rev. E 75, 011929
(2007).
[42] M. Potse, B. Dubé, J. Richer, A. Vinet, and R. M. Gulrajani,
IEEE Trans. Biomed. Eng. 53, 2425 (2006).
[43] Y. Bourgault and C. Pierre, INSMI hal:00545888 (2010).
[44] R. Majumder, A. R. Nayak, and R. Pandit, PloS One 6, e18052
(2011).
[45] R. Majumder, A. R. Nayak, and R. Pandit, PloS One 7, e45040
(2012).
[46] A. V. Panfilov and J. Keener, Chaos Solitions Fractals 5, 681
(1995).
[47] N. A. Trayanova and B. M. Tice, Drug Disc. Today: Dis. Models
6, 85 (2009).
022405-10
SPIRAL-WAVE DYNAMICS IN A MATHEMATICAL MODEL . . .
[48] S. F. Noujaim, O. Berenfeld, J. Kalifa, M. Cerrone, K.
Nanthakumar, F. Atienza, J. Moreno, S. Mironov, and J. Jalife,
Proc. Natl. Acad. Sci. USA 104, 20985 (2007).
[49] S. Alonso, M. Bär, and B. Echebarria, Rep. Prog. Phys. 79,
096601 (2016).
PHYSICAL REVIEW E 95, 022405 (2017)
[50] A. V. Panfilov, Heart Rhythm 3, 862 (2006).
[51] K. H. Ten Tusscher, A. Mourad, M. Nash, R. H. Clayton, C. P. Bradley, D. J. Paterson, R. Hren, M. Hayward, A. V. Panfilov, and P. Taggart, Exp. Physiol. 94, 553
(2009).
022405-11
© Copyright 2026 Paperzz