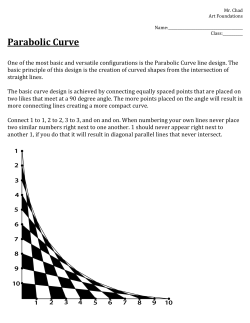
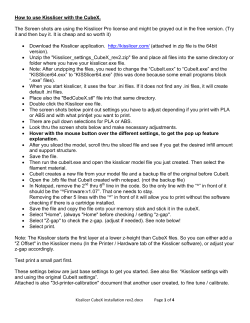
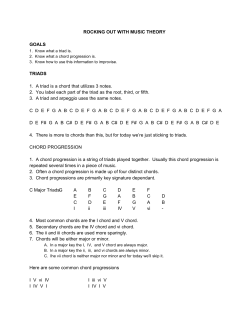
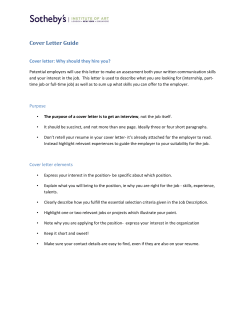
Hong Kong Diploma of Secondary Education Examination Physics and Combined Science (Physics) School-based Assessment Sample Tasks (Practical Related Tasks) Teachers may use the sample tasks for non-profit making educational and research purposes with proper acknowledgement. й¦™жёЇиЂѓи©¦еЏЉи©•ж ёе±Ђ 保留版權 2 01 0 В© Hong Kong Examinations and Assessment Authority All Rights Reserved 2010 TABLE OF CONTENT Task Title E1 Relationship between pressure and volume of a gas E2 Newton’s second law of motion E3 Centripetal force E4 Focal length of a convex lens E5 Internal resistance of a battery Physics and CS(Physics) Sample SBA Task Practical Skills ( %) Reporting %) ( Total E1 Relationship between Pressure and Volume of Gas Name : Class : No.: Date : Objectives: To investigate the relationship between pressure and volume of air in a syringe. Apparatus: 60 cm3 plastic syringe Bourdon gauge rubber tubing vaseline Theory: Boyle's law states that pressure is inversely proportional to the volume of a gas, provided that the mass and temperature of the gas remain constant. This relationship can be demonstrated by a syringe of air. The syringe is connected to a Bourdon gauge to measure the pressure. The volume of the gas can be estimated by reading the scale on the syringe. Procedures: 1. Take out the piston of the syringe. Put a little vaseline evenly on top of piston. Fit the piston back to the syringe. 2. Set the volume of air inside the syringe to roughly 25 cm3. 3. Connect the syringe to the Bourdon gauge with rubber tubing. Put a little vaseline on the surface of connectors before fitting in the rubber tubing. Bourdon gauge syringe rubber tubing piston 4. The Bourdon gauge should read roughly 1.0 Г— 105 Pa (approximately equal to atmospheric pressure). As the pointer of the Bourdon gauge may get stuck due to the friction of the mechanical parts inside, tap the Bourdon gauge slightly every time before you take a reading. Student Handoutв€’E1(P) page 1 of 5 Physics and CS(Physics) Sample SBA Task 5. Adjust the piston until the Bourdon gauge reading is 1.0 Г— 105 Pa. Record the volume of the gas inside the syringe. 6. Pull out the piston slowly until the pressure is reduced to 0.9 Г— 105 Pa. Keep this pressure and hold the piston for 15 seconds. Take the reading of the volume of the gas inside the syringe. 7. Repeat step 6 by further pulling out the piston and reducing the pressure by 0.1 Г— 105 Pa each time. Remember to keep the pressure and hold the piston by 15 seconds before the volume is read. 8. When the pressure is reduced to 0.7 Г— 105 Pa, repeat the experiment by returning the piston to 1.0 Г— 105 Pa in steps of 0.1 Г— 105 Pa. 9. The volume after the pressure is returned to 1.0 Г— 105 Pa should be roughly the same as the initial volume. If there is a large difference, check the apparatus and repeat the experiment. 10. Repeat the experiment by pushing in the piston and increasing the pressure to 1.1 Г— 105 Pa, 1.2 Г— 105 Pa, 1.3 Г— 105 Pa and 1.4 Г— 105 Pa. Then repeat the experiment by returning to 1.0 Г— 105 Pa. Remember to hold the piston for 15 seconds before taking each reading. Results: Pulling out the piston: Pressure (p) / 105 Pa 1.0 0.9 0.8 0.7 0.8 0.9 1.0 1.0 1.1 1.2 1.3 1.4 1.3 1.2 Volume (V) / cm3 Pressing in the piston: Pressure (p) / 105 Pa 1.1 1.0 Volume (V) / cm3 For a particular pressure, take the mean of volumes when the pressure is increased and decreased. Complete the table below. Pressure (p) / 105 Pa 0.7 0.8 0.9 Mean Volume (V) / cm3 1/p /10-5 Pa-1 Student Handoutв€’E1(P) page 2 of 5 1.0 1.1 1.2 1.3 1.4 Physics and CS(Physics) Sample SBA Task Plot a graph of volume (V) of the gas against 1/pressure (1/p) at room temperature. Student Handoutв€’E1(P) page 3 of 5 Physics and CS(Physics) Sample SBA Task Discussion: 1. Do the points in the graph lie on a straight line ? Does the line/curve pass through the origin ? Give a reason for the discrepancy of the result from the Boyle's law. ________________________________________________________________________ ________________________________________________________________________ ________________________________________________________________________ ________________________________________________________________________ ________________________________________________________________________ 2. What is the purpose of adding vaseline on the piston of the syringe ? ________________________________________________________________________ ________________________________________________________________________ ________________________________________________________________________ 3. Why is it necessary to hold the piston for 15 seconds before each reading is taken ? ________________________________________________________________________ ________________________________________________________________________ ________________________________________________________________________ ________________________________________________________________________ 4. Why do we repeat the experiment by returning the piston back to the initial position, so that two volumes are taken for each pressure ? ________________________________________________________________________ ________________________________________________________________________ ________________________________________________________________________ ________________________________________________________________________ ________________________________________________________________________ ________________________________________________________________________ Student Handoutв€’E1(P) page 4 of 5 Physics and CS(Physics) Sample SBA Task Further Investigation: From the graph, find the volume of air inside the rubber tubing and the Bourdon gauge. Derive the formula you used. (The y-intercept of the graph should be equal to -Vd, where Vd is the dead volume of the air in the rubber tubing and the Bourdon gauge, since p(V + Vd) = constant.) Remark for teachers: 1. In textbook Boyle's law experiment usually takes volume as the independent variable. As Bourdon gauges usually do not have fine scale, it will not be easy to read gas pressure to an acceptable precision. Here the volume on the syringe is read while pressure is the independent variable. Moreover if the dead-volume of the tube and Bourdon gauge is wanted, it is essential to plot V against 1/p. 2. It is not recommended to use glass syringe for safety reason. 3. As the diameter of the plastic syringe outlet does not fit the inlet of Bourdon gauge, two layers of rubber tubing are required. 4. If the dead-volume is too large, the initial volume (25 cm3) should be reduced. 5. The main error of this experiment is the leakage of air, which depends very much on the age and condition of the syringe. Student Handoutв€’E1(P) page 5 of 5 Hong Kong Diploma of Secondary Education School-Based Assessment for Physics Mark Sheet for Assessment of Performance in Practical Work (Practical skills) Group No. / Experiment No. Gp.В 1В Exp.E1 Gp.В 2В Exp.E1 Gp.В 3В Exp.E1 Gp.В 4В Exp.E1 Gp.В 5В Exp.E1 Student No. Assessment Criteria / Teacher's Remarks (1) (2) (3) (4) (5) The procedure for practical work is carried out safely. AlertВ ofВ theВ safetyВ concernВ inВ anВ experimentВ whichВ requiresВ applyingВ considerableВ amountВ ofВ force,В particularlyВ potentialВ hazardВ onВ eyes.В ExcessВ forceВ isВ notВ used.В (10%)В Work is done in an organized and efficient way. SetupВ isВ tidyВ andВ easyВ toВ follow.В AppropriateВ flowВ ofВ procedures.В GraphВ isВ plottedВ duringВ theВ experimentВ toВ checkВ forВ unexpectedВ result.В (20%) Apparatus are handled competently. SetВ upВ theВ apparatusВ accordingВ toВ instructions.В AchieveВ airВ tightВ withВ vaseline.В CanВ holdВ aВ steadyВ pressureВ duringВ theВ volumeВ isВ read.В (30%) Instruments are used in appropriate ways to make accurate readings and measurements. CanВ takeВ accurateВ readingВ withВ theВ syringeВ andВ BourdonВ gauge.В FollowВ theВ requirementВ toВ holdВ forВ 15В s.В TapВ theВ BourdonВ gaugeВ beforeВ readingВ isВ taken.В (30%)В Positive attitude towards scientific investigation. GoodВ cooperationВ amongВ theВ students.В DoubleВ checkВ andВ evaluateВ theВ resultВ afterВ theВ experiment.В MakingВ certainВ investigationВ afterВ /В duringВ experiment.В (10%)В В В В В В В В В В В В В В В В В В В В В В В В В В В В В В В В В В В В В В В В В В В В В В В В В В В В В В В В Remarks : (e.g. students' strength/weaknesses) В E1В RelationshipВ betweenВ pressureВ andВ volumeВ ofВ aВ gasВ В Group Total Student Total Note : В В В В В В В В В В В В В В В В В В В В В В В В В The marks for individual students within a group may not be the same as teacher's observation on individual students and questioning during experiment are taken into account. Marking Schemeв€’E1(P) page 1 of 2 E1 Relationship between Pressure and Volume of Gas Marking Scheme (Reporting) Results: Table of data on pulling out the piston. пїЅ Reasonable readings of volume. пїЅ Consistent reading between increasing and decreasing sessions. Table of data on pushing in the piston. пїЅ Reasonable readings of volume. пїЅ Consistent reading between increasing and decreasing sessions. Table of Mean Volume and 1/p. пїЅ Correct mean from the first two tables. пїЅ Correct 1/p. A graph of V against 1/p is plotted with пїЅ correctly labeled axes with units, пїЅ correct data points, пїЅ a best fit line. (2) (2) (2) (4) Total: 10 Discussion: 1. The points lie roughly on a straight line, but the line does not pass through the origin. It is because there is some air in the rubber tube and Bourdon gauge not included in V. (3) 2. To keep the syringe air tight. (1) 3. As the temperature should be kept constant, the gas is allowed to return to the room temperature after the air is expanded or compressed. (2) 4. To check whether there is significant air leakage during the action of piston. (May consider other answers, e.g., if the two readings of the volume are not consistent, the experiment should be repeated.) Overall: Presentation and communication (2) Total: 2 Full marks: 20 Marking Schemeв€’E1(P) (2) Total: 8 page 2 of 2 Physics and CS(Physics) Sample SBA Task Practical Skills ( %) Reporting %) ( Name : E2 Newton’s second law of motion Class : No.: Date : Total Objective: To investigate the relation of the mass, acceleration and net force acting on an object. Apparatus: data-logger interface with a motion sensor elastic threads (unstretched length about 20 cm) Г— 4 friction-compensated runway trolley 0.5 kg weights / additional trolleys Г— 3 electronic balance (optional if the mass of the trolley is known) Part A—Net force and acceleration Procedures: 1. Prepare a set-up to record the motion of a trolley on a runway as shown below. While necessary, adjust the runway for friction compensation. 2. Start data-logging. Use 1 elastic thread to pull the trolley along the track. The thread should be stretched by the same amount throughout. 3. From the slope of the velocity-time graph generated by the data-logging program, find the acceleration of the trolley. 4. Take one more confirmatory trial and obtain the mean value of the acceleration of the trolley. 5. Repeat steps 2–4 with 2, 3 and 4 elastic threads respectively. The threads should be stretched by the same amount as before. 6. Plot a graph of the acceleration a of the trolley against the number of elastic threads N used. Student Handoutв€’E2(P) page 1 of 6 Physics and CS(Physics) Sample SBA Task Results: Mass of the trolley m = __________ kg Acceleration a / m sв€’2 Number of threads N 1st trial 1 2 3 4 A graph of a against N: Student Handoutв€’E2(P) page 2 of 6 2nd trial Mean Physics and CS(Physics) Sample SBA Task Discussion: 1. With the aid of a free body diagram, explain the meaning of friction compensation in step 1 of the procedures above. Describe briefly the experimental steps to show that the runway is friction compensated. 2. State the control variable(s), dependent variable(s) and independent variable(s) in this experiment. 3. What physical quantity does the number of threads N represent ? From the graph plotted above, what can you say about the relation of the mass, acceleration and net force acting on an object ? 4. While you pull the trolley, the thread should be stretched by the same amount throughout. Explain briefly why it is important in this experiment. Student Handoutв€’E2(P) page 3 of 6 Physics and CS(Physics) Sample SBA Task Part B—Mass and acceleration Procedures: 1. Prepare the same set-up as Part A to record the motion of a trolley on a runway. While necessary, adjust the runway for friction compensation. 2. Start data-logging. Use 2 elastic threads to pull the trolley along the track. The thread should be stretched by the same amount throughout. 3. From the slope of the velocity-time graph generated by the data-logging program, find the acceleration of the trolley. 4. Take one more confirmatory trial and obtain the mean value of the acceleration of the trolley. 5. Repeat steps 2–4 with additional weights placed on the trolley. The threads should be stretched by the same amount as before. 6. Plot a graph of the acceleration a of the trolley against 1 where m is the total mass of the trolley. m Results: Number of threads N = __________ Total mass of the trolley m / kg Student Handoutв€’E2(P) 1 ( ) / kgв€’1 m page 4 of 6 Acceleration a / m sв€’2 1st trial 2nd trial Mean Physics and CS(Physics) Sample SBA Task A graph of a against 1 : m Discussion: 1. State the control variable(s), dependent variable(s) and independent variable(s) in this experiment. 2. From the graph plotted above, what can you say about the relation of the mass, acceleration and net force acting on an object ? Hence, together with the results from Part A, suggest a general relation among them. Student Handoutв€’E2(P) page 5 of 6 Physics and CS(Physics) Sample SBA Task 3. Discuss TWO major sources of errors in this experiment and way(s) for improvement. 4. Now, if the runway were inclined at an angle greater than that required for friction compensation, how would the graphs obtained in Part A and Part B be affected ? Assume that the friction is unchanged throughout. Student Handoutв€’E2(P) page 6 of 6 Hong Kong Diploma of Secondary Education School-Based Assessment for Physics Mark Sheet for Assessment of Performance in Practical Work (Practical skills) Group No. / Experiment No. Gp.В 1В Exp.E2 Gp.В 2В Exp.E2 Gp.В 3В Exp.E2 Gp.В 4В Exp.E2 Gp.В 5В Exp.E2 Student No. Assessment Criteria / Teacher's Remarks (1) The procedure for practical work is carried out safely. ApparatusВ correctlyВ setВ upВ В TrolleysВ areВ pulledВ withВ care.В (15%)В Work is done in an organized and efficient way. FrictionВcompensatedВ runwayВ isВ setВ up.В FrictionВcompensationВ isВ tested.В WorkВ isВ doneВ efficiently.В (25%) (3) Apparatus are handled competently. DataВloggingВ interfaceВ canВ beВ connectedВ correctly.В DataВloggingВ softwareВ canВ beВ setВ upВ correctly.В (20%) В В В В В В В В В В В В В В В В В В В В В В В В В В В В В В В В В В В В В В В В В В В В В В В В В В В В В В В (2) (4) Instruments are used in appropriate ways to make accurate readings and measurements. ElasticВ stringsВ areВ pulledВ withВ sameВ extensionВ everyВ time.В GraphsВ canВ beВ obtainedВ fromВ theВ software.В SlopeВ ofВ vВtВ graphВ canВ beВ obtainedВ fromВ theВ softwareВ accurately.В (30%)В (5) Positive attitude towards scientific investigation. GoodВ cooperationВ amongВ theВ students.В (10%)В Remarks : (e.g. students' strength/weaknesses) В E2В Newton’sВ secondВ lawВ ofВ motionВ Group Total Student Total Note : В В В В В В В В В В В В В В В В В В В В В В В В В The marks for individual students within a group may not be the same as teacher's observation on individual students and questioning during experiment are taken into account. Marking Schemeв€’E2(P) page 1 of 3 E2 Newton’s second law of motion Marking Scheme (Reporting) Part A—Net force and acceleration Results: Mass of the trolley m is measured / stated correctly. Values of acceleration are filled in the table with suitable significant figures. A graph of a against N is plotted with пїЅ correctly labeled axes with units пїЅ correct data points пїЅ a best fit line (3) Total: 5 Discussion: 1. weight component along the runway is equal to the friction acting on the trolley a free body diagram is correctly drawn experimental set-up description constant speed verified in the data-logging system 2. 3. 4. (1) (1) (4) control variable: mass of the trolley dependent variable: acceleration of the trolley independent variable: no. of threads (3) N represents the net force acting on the trolley When m is kept constant, a is proportional to F (2) To ensure the force acting on the trolley is constant throughout the experiment. Overall: Presentation and communication (2) Total: 2 Full marks: 17 Marking Schemeв€’E2(P) (1) Total: 10 page 2 of 3 Part B—Mass and acceleration Results: Number of threads N is stated correctly. Values of acceleration are filled in the table with suitable significant figures. A graph of a against пїЅ пїЅ пїЅ (1) (1) 1 is plotted with m correctly labeled axes with units correct data points a best fit line (3) Total: 5 Discussion: 1. control variable: no. of threads dependent variable: acceleration of the trolley independent variable: mass of the trolley 2. When F is kept constant, a is proportional to Hence, a is proportional to 3. (3) 1 m F or F is proportional to ma m The thread was not stretched by the same amount. (2) (1) Friction was not exactly compensated throughout. Or friction was not constant throughout. 4. (1) The net force acting on the trolley is increased. The acceleration will be larger. The graphs will be shifted upwards. (3) Total: 10 Overall: Presentation and communication (2) Total: 2 Full marks: 17 Marking Schemeв€’E2(P) page 3 of 3 Physics and CS(Physics) Sample SBA Task Practical Skills ( %) Reporting %) ( Name : E3 Centripetal force Class : No.: Date : Total Objective: To measure the centripetal force of whirling a mass round a horizontal circle and compare it with the theoretical value. Apparatus: rubber bung glass tube about 15 cm long slotted weights, with hanger 12 Г— 0.02 kg nylon thread 1.5 m paper marker adhesive tape metre rule stop watch Procedures: 1. Attach one end of a 1.5 m length of nylon thread to a rubber bung and thread the other end through a glass tube, a paper marker and a number of weights as shown. L m rubber bung glass tube glass tube 1.5 m length of nylon thread paper marker paper marker slotted weights M 2. M rubber bung First adjust the position of the paper marker so that it is at one end of the glass tube, and the length of the thread L from the other end of the glass tube to the rubber bung is, say, 0.8 m. Fix the position of the paper marker using adhesive tape if necessary. First start with M = 0.12 kg (i.e. 120 g). 3. Holding the glass tube vertically, whirl the bung around above your head in a horizontal circle. that the nylon thread need not be horizontal.) (Note Increase the speed of the bung gradually and allow it to move out (i.e. let L increases) until the paper marker is just below the glass tube without touching it. Student Handoutв€’E3(P) page 1 of 4 Physics and CS(Physics) Sample SBA Task 4. Try to keep the angular speed constant so that the paper marker is just below the tube throughout. Ask your partner to time 20 revolutions of the bung using a stop watch. Remember to start the stop watch at 0 and stop it at 20. Take one more confirmatory reading and obtain the mean time for 20 revolutions. Calculate the tension T in the string and the angular velocity П‰. 5. Repeat the procedures using different masses M. Remember to check confirmatory reading for each value of M. 6. Measure the mass m of the rubber bung. 7. Plot a suitable graph to find the relation between П‰ and T. Results: Mass of the rubber bung m = __________ kg Length of the thread L = __________ m Time for 20 revolutions 20t / s M / kg Angular speed T = Mg / N st 1 trial Student Handoutв€’E3(P) nd 2 trial page 2 of 4 Mean П‰= 2ПЂ t / rad s-1 Physics and CS(Physics) Sample SBA Task Discussion: 1. The string may not be horizontal as the rubber bung moves around. Show that 2. 2 (i) the tension T in the string is equal to mП‰ L; (ii) the angle Оё is independent of the angular velocity П‰. From the graph plotted above, what can you say about the relation between П‰ and T ? Calculate the slope of the graph. What is the physical significance of the slope ? Compare the experimental value and the theoretical value of the slope. 3. In step 3 of the procedures above, the marker should be just below the glass tube without touching it. Explain briefly why it is important in this experiment. Student Handoutв€’E3(P) page 3 of 4 Physics and CS(Physics) Sample SBA Task 4. Discuss TWO major sources of errors in this experiment. Further Investigation: 1. Design an experiment to find the relation between П‰ and L. Student Handoutв€’E3(P) page 4 of 4 Hong Kong Diploma of Secondary Education School-Based Assessment for Physics Mark Sheet for Assessment of Performance in Practical Work (Practical skills) Group No. / Experiment No. Gp.В 1В Exp.E3 Gp.В 2В Exp.E3 Gp.В 3В Exp.E3 Gp.В 4В Exp.E3 Gp.В 5В Exp.E3 Student No. Assessment Criteria / Teacher's Remarks The procedure for practical work is carried out safely. RubberВ bungВ isВ farВ fromВ anyВ objectВ orВ people.В В (10%)В В (2) Work is done in an organized and efficient way. AssemblyВ ofВ screwВ nuts,В glassВ tube,В nylonВ stringВ andВ rubberВ bung.В RepeatВ theВ experimentВ byВ usingВ appropriateВ lengthsВ ofВ string.В (20%)В В В В В В В В В В В В В В В В В В В В В В В В В В (1) (3) Apparatus are handled competently. CanВ useВ aВ stopВ watchВ toВ takeВ theВ timeВ forВ 20В revolutions.В CanВ useВ aВ balanceВ toВ findВ theВ massВ ofВ theВ rubberВ bung.В (20%)В Instruments are used in appropriate ways to make accurate readings and measurements. SettingВ theВ lengthВ L/appropriateВ positionВ ofВ theВ marker.В WhirlingВ theВ rubberВ bungВ uniformlyВ inВ aВ horizontalВ circle.В HoldingВ theВ glassВ tubeВ verticallyВ inВ anВ approx.В fixedВ position.В StartВ countingВ whenВ steadyВ situationВ reached.В (40%)В В (5) Positive attitude towards scientific investigation. GoodВ cooperationВ amongВ theВ students.В MakingВ certainВ investigationВ afterВ /В duringВ experiment.В (10%)В В В В В В В В В В В В В В В В В В В В В В В В В В В В В В В (4) В Remarks : (e.g. students' strength/weaknesses) В E3В CentripetalВ forceВ В Group Total Student Total Note : В В В В В В В В В В В В В В В В В В В В В В В В В The marks for individual students within a group may not be the same as teacher's observation on individual students and questioning during experiment are taken into account. Marking Schemeв€’E3(P) page 1 of 2 E3 Centripetal force Marking Scheme (Reporting) Results: Mass of the rubber bung m is measured to within 5% difference from the teacher’s value. Length of the thread L is stated and the value is appropriate. (1) (1) Values filled in the table (M, T, t and П‰) are of suitable significant figures. (1) A graph of П‰2 against T is plotted with • correctly labeled axes with units • correct data points • a best fit line (4) Total: 7 Discussion: 1. (i) T sin Оё = mП‰ 2L sin Оё (ii) T cos Оё = mg 2. (2) П‰2 is directly proportional to T slope correctly calculated slope = 1 mL experimental value and the theoretical value of the slope compared 3. 4. (4) T may not be equal to the weight of the slotted weights if the marker is touching the glass tube. (1) Any 2 below: (2) • • • friction between the string and the glass tube the plane of rotation may not be horizontal the glass tube may not be at a fixed position Total: 9 Overall: Presentation and communication (2) Total: 2 Full marks: 18 Marking Schemeв€’E3(P) page 2 of 2 Physics and CS(Physics) Sample SBA Task Practical Skills ( %) Reporting %) ( Name : E4 Focal length of a convex lens Total Class : No.: Date : Objective: To measure the focal length of a spherical convex lens. Apparatus: spherical convex lens with holder lamp housing white screen (opague/translucent) metre rule Part A—Forming image of a distant object Procedures: 1. Place a convex lens with a holder near a window. Move the opaque/translucent screen to a position where a sharp image of a distant object is formed as shown below. the inverted image of the building convex lens parallel rays coming from a far away building screen f 2. Measure the distance between the lens and the screen. This is the focal length of the lens. Results: The focal length found in Part A, f1 = __________ cm Discussion: 1. State the nature of the image formed. 2. If the screen is removed, can you see the image of the distant object ? Student Handoutв€’E4(P) page 1 of 5 Physics and CS(Physics) Sample SBA Task Part B—Plane mirror method Procedures: 1. Put an opaque screen side by side with a lamp housing (with a letter F). Attach a plane mirror to a convex lens with holder and place them in front of the lamp housing and the screen as shown below. lamp housing opaque screen convex lens metre rule plane mirror 2. Move the lens-mirror combination until a sharp image is formed on the opaque screen. 3. Measure the object/image distance, i.e. the distance between the lens and the screen. This is the focal length of the lens. Results The focal length found in Part B, f2 = __________ cm Discussion 1. State the nature of the image formed. 2. Will the result be different if the distance between the plane mirror and the lens is changed ? Student Handoutв€’E4(P) page 2 of 5 Physics and CS(Physics) Sample SBA Task Part C—Using lens formula Procedures 1. Prepare the set-up shown below. Set the distance between an illuminated object and the lens, i.e. the object distance u, to a value close to 2f1 (or 2f2). translucent screen lamp housing convex lens in holder image distance v object distance u 2. Adjust the position of the translucent screen until a sharp image is formed on it and measure the distance between the lens and the screen, i.e. the image distance v. 3. Change the object distance u to some values larger than 2f1 and repeat the measurement to obtain 3 more pairs of u and v. 4. Change the object distance u to some values smaller than 2f1 and repeat the measurement to obtain 3 more pairs of u and v. 5. Plot a graph of 1 1 against . The focal length can be obtained from the y-intercept of the graph. v u Results: u / cm v / cm u < 2f1 u ≈ 2f1 u > 2f1 Student Handoutв€’E4(P) page 3 of 5 1 / cm–1 u 1 / cm–1 v Physics and CS(Physics) Sample SBA Task The focal length found in Part C, f3 = __________ cm Discussion: 1. State the nature of the images formed in steps 2, 3 and 4. 2. The focal length of a concave lens cannot be found by this method. Why ? Student Handoutв€’E4(P) page 4 of 5 Physics and CS(Physics) Sample SBA Task 3. By using the lens formula y- intercept of the 4. 1 1 1 = + , show how the focal length of the lens is obtained from the f u v 1 1 against graph. v u If half of the lens is covered by a cardboard, describe any changes of the image formed. Further Investigation: 1. Repeat the experiment with other lenses of different thickness. Find out how the thickness of a lens affects its focal length. 2. In Part C, what is the minimum distance between the object and the image ? Student Handoutв€’E4(P) page 5 of 5 Hong Kong Diploma of Secondary Education School-Based Assessment for Physics Mark Sheet for Assessment of Performance in Practical Work (Practical skills) Group No. / Experiment No. Gp.В 1В Exp.E4 Gp.В 2В Exp.E4 Gp.В 3В Exp.E4 Gp.В 4В Exp.E4 Gp.В 5В Exp.E4 Student No. Assessment Criteria / Teacher's Remarks The procedure for practical work is carried out safely. TheВ lampВ houseВ shouldВ notВ beВ movedВ afterВ itВ hasВ beenВ switchedВ on.В В HandlingВ theВ convexВ lensВ withВ care.В В (20%)В В (2) Work is done in an organized and efficient way. AlignmentВ ofВ theВ rulersВ isВ correctВ inВ PartВ A,В BВ andВ C.В RepeatВ theВ experimentВ byВ usingВ appropriateВ objectВ distancesВ inВ PartВ C.В (25%)В В В В В В В В В В В В В В В В В В В В В В В В В В (1) (3) Apparatus are handled competently. CanВ measureВ theВ objectВ andВ imageВ distancesВ correctly.В (20%)В Instruments are used in appropriate ways to make accurate readings and measurements. AВ sharpВ imageВ canВ beВ formedВ onВ theВ screen.В MeasurementВ isВ takenВ onlyВ whenВ aВ sharpВ imageВ isВ formed.В (25%)В В (5) Positive attitude towards scientific investigation. GoodВ cooperationВ amongВ theВ students.В MakingВ certainВ investigationВ afterВ /В duringВ experiment.В (10%)В В В В В В В В В В В В В В В В В В В В В В В В В В В В В В В (4) В Remarks : (e.g. students' strength/weaknesses) В E4В FocalВ lengthВ ofВ aВ convexВ lensВ Group Total Student Total Note : В В В В В В В В В В В В В В В В В В В В В В В В В The marks for individual students within a group may not be the same as teacher's observation on individual students and questioning during experiment are taken into account. Marking Schemeв€’E4(P) page 1 of 3 E4 Focal length of a convex lens Marking Scheme (Reporting) Part A—Forming image of a distant object Results: f1 is measured to within 10% difference from teacher’s value. f1 is measured to within 5% difference from teacher’s value. Discussion: 1. real, inverted, diminished 2. (1) Yes (1) Total: 2 Part B—Plane mirror method Results: f2 is measured to within 10% difference from teacher’s value. f2 is measured to within 5% difference from teacher’s value. Discussion: 1. real, inverted, same size 2. (1) (1) Total: 2 (1) No Marking Schemeв€’E4(P) (1) (1) Total: 2 (1) Total: 2 page 2 of 3 Part C—Using lens formula Results: Values of u and v are filled in the table with suitable significant figures. Values of 1 1 and are calculated correctly. u v A graph of the пїЅ пїЅ пїЅ (1) (1) 1 1 against is plotted with v u correctly labeled axes with units correct data points a best fit line (3) f3 is measured to within 10% difference from teacher’s value. (1) f3 is measured to within 5% difference from teacher’s value. (1) Total: 7 Discussion: 1. Step 2: real, inverted, same size Step 3: real, inverted, diminished Step 4: real, inverted, magnified (3) 2. The image formed by a concave lens is not real and cannot be formed on a screen. (1) 3. 1 1 1 =в€’ + v u f (1) Comparing with the equation y = mx + c, (1) the slope should be -1 while the y intercept should be 4. 1 . f The whole image can still be seen But it is dimmer. (2) Total: 8 Overall: Presentation and communication (2) Total: 2 Full marks: 25 Marking Schemeв€’E4(P) page 3 of 3 Physics and CS(Physics) Sample SBA Task Practical Skills ( %) Reporting %) ( Name : E5 Internal Resistance of a Battery Class : No.: Date : Total Objective: To determine the internal resistance of a battery. Apparatus: battery (3 Г— 1.5 V AA dry cells) voltmeter (5 V) ammeter (1 A) rheostat R fixed resistor R' connecting wires switch Theory: A real battery always has internal resistance. Simple theory regards a real battery as an ideal battery of e.m.f. Оµ in series with the internal resistance r. Оµ r I V When a current I passes the battery, the potential difference V across the battery is given by V = Оµ – Ir If V is plotted against I, the internal resistance and e.m.f. of the battery can be found. Procedures: 1. Connect the circuit as shown in the diagram below. V R' R A Student Handoutв€’E5(P) page 1 of 4 Physics and CS(Physics) Sample SBA Task 2. Keep the switch turned off. Take the reading of the voltmeter. This is the initial electromotive force (e.m.f.) of the battery. 3. Set the rheostat to zero. Turn on the switch and take the ammeter and voltmeter readings. Turn off the switch once the readings are taken. 4. Increase the resistance of the rheostat. Turn on the switch and adjust the rheostat until the current is roughly 0.1 A below the value in (3). Take the ammeter and voltmeter readings. Remember to turn off the switch once the readings are taken. 5. Repeat step 4 by decreasing the current in steps of 0.1 A. Plot a graph of the voltage V against the current I. Results: Initial electromotive force of the battery = ___________________ V Ammeter reading I/A Voltmeter reading V/V Plot a graph of V against I. Student Handoutв€’E5(P) page 2 of 4 Physics and CS(Physics) Sample SBA Task From the graph above, how can you find the internal resistance and e.m.f. of the battery ? Derive the formulae you used. ___________________________________________________________________________ ___________________________________________________________________________ ___________________________________________________________________________ ___________________________________________________________________________ ___________________________________________________________________________ ___________________________________________________________________________ Conclusion: The internal resistance of the battery is _____________________ О©. The e.m.f. is _____________________ V. Discussion: 1. Why is it necessary to turn off the switch after each reading is taken ? ________________________________________________________________________ ________________________________________________________________________ ________________________________________________________________________ ________________________________________________________________________ ________________________________________________________________________ 2. Do you think that the resistance of the connecting wire is a significant error in this experiment ? Explain briefly. ________________________________________________________________________ ________________________________________________________________________ ________________________________________________________________________ ________________________________________________________________________ ________________________________________________________________________ ________________________________________________________________________ Student Handoutв€’E5(P) page 3 of 4 Physics and CS(Physics) Sample SBA Task 3. The battery contains three identical dry cells in series. What are the e.m.f. and internal resistance of each dry cell ? Explain briefly. ________________________________________________________________________ ________________________________________________________________________ ________________________________________________________________________ ________________________________________________________________________ ________________________________________________________________________ ________________________________________________________________________ Further Investigation: Set the resistance of the rheostat to zero. Turn on the switch for roughly 10 minutes. 3 to 5 and plot another V - I graph. Repeat steps What happen to the internal resistance and e.m.f. after the battery has been discharged for 5 minutes ? Suggest what happens inside the dry cells while they are discharging ? (Internal resistance increases and e.m.f. decreases. It is because there is chemical reaction inside the dry cells. The concentration of the active ingredients drops and gas bubbles are formed on the electrodes.) Remark for teachers: 1. The typical internal resistance of the battery (3 Г— 1.5 V AA dry cells) is 1 О©. With a 1 A ammeter, the typical voltage drop due to the internal resistance is about 0.1 to 1 V. Therefore the percentage error of this experiment is quite large. 2. The fixed resistor R' is used for protection and control of the maximum current. A 3.3 О© 5 W ceramic resistor should be suitable for most cases. A 10 О© rheostat (typical model that can be found in most school) is suitable for R. 3. Alkaline cells or rechargeable cells should not be used in this experiment. Their internal resistances are lower and cannot be measured easily. 4. The e.m.f. and internal resistance of dry cells change significantly when they discharge. To get a more standardized result, fresh dry cells should be used. Before fresh dry cells are used, a brief discharge is preferred so that the initial e.m.f. can be more steady. 5. In order to get good results, the duration of discharging must be kept as short as possible. If this technique is too difficult for some students, a resistor may be added as an artificial internal resistance. However the students should be reminded that the value they measured is not the realistic value of dry cells. Student Handoutв€’E5(P) page 4 of 4 Hong Kong Diploma of Secondary Education School-Based Assessment for Physics Mark Sheet for Assessment of Performance in Practical Work (Practical skills) Group No. / Experiment No. Gp.В 1В Exp.E5 Gp.В 2В Exp.E5 Gp.В 3В Exp.E5 Gp.В 4В Exp.E5 Gp.В 5В Exp.E5 Student No. Assessment Criteria / Teacher's Remarks (1) (2) (3) (4) (5) The procedure for practical work is carried out safely. PolaritiesВ ofВ theВ ammeterВ andВ voltmeterВ areВ checked.В AmmeterВ isВ notВ overloaded.В CircuitВ isВ openedВ whenВ leftВ unattended.В В (10%)В Work is done in an organized and efficient way. CircuitВ isВ connectedВ inВ aВ tidyВ andВ easyВ toВ followВ manner.В AppropriateВ flowВ ofВ procedures.В GraphВ isВ plottedВ duringВ theВ experimentВ toВ checkВ forВ unexpectedВ result.В (20%) Apparatus are handled competently. CorrectВ connectionВ ofВ theВ circuit.В ConnectВ theВ voltmeterВ directlyВ acrossВ theВ batteryВ toВ minimizeВ error.В CanВ adjustВ theВ rheostatВ appropriatelyВ accordingВ toВ theВ instructions.В (30%) Instruments are used in appropriate ways to make accurate readings and measurements. CanВ takeВ accurateВ readingВ withВ ammeterВ andВ voltmeter.В ShowВ concernВ toВ minimizeВ theВ timeВ forВ allowingВ theВ currentВ toВ flow.В (30%)В В Positive attitude towards scientific investigation. GoodВ cooperationВ amongВ theВ students.В DoubleВ checkВ andВ evaluateВ theВ resultВ afterВ theВ experiment.В MakingВ certainВ investigationВ afterВ /В duringВ experiment.В (10%)В В В В В В В В В В В В В В В В В В В В В В В В В В В В В В В В В В В В В В В В В В В В В В В В В В В В В В В В Remarks : (e.g. students' strength/weaknesses) В E5В InternalВ resistanceВ ofВ aВ batteryВ Group Total Student Total Note : В В В В В В В В В В В В В В В В В В В В В В В В В The marks for individual students within a group may not be the same as teacher's observation on individual students and questioning during experiment are taken into account. Marking Schemeв€’E5(P) page 1 of 2 E5 Internal Resistance of a Battery Marking Scheme (Reporting) Results: Initial e.m.f. of the battery. (1) 5 to 8 sets of V and I with reasonable values and appropriate significant figures. I is varying in roughly steps of 0.1 A. (2) A graph of V against I is plotted with пїЅ correctly labeled axes with units, пїЅ correct data points, пїЅ a best fit line. (4) Derive how e.m.f. and internal resistance are obtained from the graph. (3) Conclusion: Values of the e.m.f. and internal resistance. Discussion: 1. The e.m.f. and internal resistance change as the battery discharges. To get a consistent result, the battery should not be allowed to discharge continuously. (May consider other answers, e.g., safety reason or saving energy.) 2. 3. No. As the voltage is taken directly across the terminals of the battery, the resistance of the wires does not affect the voltmeter reading. As the ammeter is in series with the wires, the resistance of the wires also has no effect on ammeter reading. (May consider other answers, e.g., resistance of connecting wires are far smaller than r.) (2) Total: 12 (2) (2) Let the internal resistance and e.m.f. of each cell be Оµ' and r'. As the cells are in series, Оµ = 3Оµ' r = 3r' (2) ∴ Оµ' = …, r = … Total: 6 Overall: Presentation and communication (2) Total: 2 Full marks: 20 Marking Schemeв€’E5(P) page 2 of 2
© Copyright 2026 Paperzz