第 6 回豊田ビームライン研究発表会
(第 12 回 SPring-8 産業利用報告会)
期間: 2015 年 9 月 3 日(木)・4 日(金)
会場: 川崎市産業振興会館
主催: 産業用専用ビームライン建設利用共同体、兵庫県、
(株)豊田中央研究所、(公財)高輝度光科学研究センター
共催: SPring-8 利用推進協議会
協賛: フロンティアソフトマター開発専用ビームライン産学連合体、
SPRUC 企業利用研究会、光ビームプラットホーム、
(一財)総合科学研究機構 東海事業センター、
(一財)高度情報科学技術研究機構、茨城県、
あいちシンクロトロン光センター
1
目 次
ご挨拶
・ ・ ・ ・ 3
堂前 和彦
第6回豊田ビームライン研究発表会
(口頭発表)
TO-01
小角/広角X線散乱法を用いた射出成形機金型内における熱可塑性樹脂の
結晶化過程その場観察
松永 拓郎, 片桐 好秀, 森下 卓也, 村岡 慶美, 原田 雅史, 福森 健三
TO-02
・ ・ ・ ・4
放射光 X 線を用いた Li イオン電池正負極反応の同時測定
岡 秀亮, 牧村 嘉也, 西村 友作, 野中 敬正, 奥田 匠昭, 川浦 宏之,
宇山 健, 近藤 広規, 佐々木 厳
・ ・ ・ ・10
(ポスター発表)
T-01
X線吸収分光法による排気浄化用 Pd 触媒の硫黄被毒機構解析
田辺 稔貴 1), 長井 康貴 1), 堂前 和彦 1), 田中 淳 2), 三浦 真秀 2)
(原著論文投稿予定)
1) 豊田中央研究所, 2) トヨタ自動車
T-02
マイクロビーム走査型 3DXRD 顕微鏡へ向けた高エネルギーマイクロビームの形成
林 雄二郎
T-03
・ ・ ・ ・16
放射光ラミノグラフィによる部品内部微小領域の形態計測
宇山 健, 木村 英彦, 浅田 崇史, 山口 聡, 林 雄二郎, 加納 大樹
T-04
・ ・ ・ ・21
摩擦面その場時分割X線回折法を用いた各種鋼材の焼付き現象解析
泉 貴士 1), 三田 修三 1), 山口 聡 1), 池端 秀哲 2), 余語 康宏 2),
八木 和行 2), 小屋町 潤 2), 杉村 丈一 2), 斉藤 浩二 3)
(原著論文投稿予定)
1) 豊田中央研究所, 2) 九州大学, 3) トヨタ自動車
T-05
化学蓄熱材料の時分割・その場 X 線回折測定技術の構築
岸田 佳大, 青木 正和, 水谷 陽介, 野中 敬正, 堂前 和彦
T-07
・ ・ ・ ・25
マイクロビームによる固体酸化物形燃料電池電極の結晶構造解析
藤田 悟, 野崎 洋, 松尾 秀仁, 山口 聡, 林 雄二郎, 天野 久美, 加藤 雄一
T-08
XAFS によるジスプロシウム鉱物の局所構造解析
畠中 孝彰, 高木 秀樹, 野中 敬正, 石田 亘広
T-09
・ ・ ・ ・30
(原著論文投稿予定)
反復 EXFS 解析法による 2 次元系ナノ微粒子の 3 次元原子分布解析
西村 友作, 濱口 豪, 山口 聡, 高木 秀樹, 堂前 和彦, 野中 敬正, 長井 康貴
(原著論文投稿予定)
1
T-10
球状カーボン/SnO2 複合体の XAFS 解析
龍田 成人, 矢野 和久, 加藤 晃彦, 西村 友作, 野中 敬正
・ ・ ・ ・35
2015 年豊田ビームライン関係原著論文(再掲載)
・ ・ ・ ・40
2015 年豊田ビームライン研究発表一覧
・ ・ ・ ・51
2
ご挨拶
2016 年1月
株式会社 豊田中央研究所
分析部 量子ビーム解析研究室 堂前和彦
第 6 回の豊田ビームライン研究発表会のプロシーディングスを発刊いたします。この
発表会は 2015 年 9 月 3 日,4 日に川崎市産業振興会館にて開催されました第 12 回
SPring-8 産業利用報告会の一部として行われました。今回の発表では、口頭発表 2 件
とポスター発表 10 件の発表が行われました。本冊子には、すでに他誌に投稿された発
表を除いた7件を掲載しています。
豊田ビームラインは 2009 年に高速 XAFS 測定法を主要技術として利用を開始しまし
た。その後の設備導入で、小角散乱法、局所ひずみ測定法、ラミノグラフィ測定等の技
術を導入してきました。また、ビームライン建設以来、技術開発をしてきた操作型3次
元 X 線回折顕微鏡も昨年度にほぼ完成しており、波及技術として 50keV の高エネルギ
ーX 線マイクロビームの利用も可能となっています。今年度の発表を見返すと、XAFS
関係の発表が半分を占めていますが、徐々に XAFS 以外の利用も増加しています。さ
らに、近年の特徴として、材料解析だけでなく、部品に対する形態・構造観察が増えて
きていることが挙げられます。これらは、企業利用ビームラインとして放射光の応用先
の広がりを意味しており、好ましい展開と考えています。今回の発表では技術開発に関
連した発表が4件あり、測定・解析技術開発においても常に新規技術への取組みができ
ていると考えています。ただ、これまでの取組みは、in situ,時分割および複合技術化
が中心でした。豊田ビームラインも稼働して 7 年が経過しており、次の新規な測定手法
の導入を検討すべき時期になっていると考えています。
今後とも、関係者皆様のご指導・ご協力をよろしくお願い申し上げます。
以上
3
豊田ビームライン研究発表会プロシーディングス 6, (2015) 4-9
2014A7003, 2014B7003
BL33XU
小角/広角 X 線散乱法を用いた射出成形機金型内における
熱可塑性樹脂の結晶化過程その場観察
In-situ Observation of Crystallization Process for Thermoplastic Resin in
an Injection Mold by means of Small- and Wide-Angle X-ray Scattering
松永 拓郎, 片桐 好秀, 森下 卓也, 村岡 慶美, 原田 雅史, 福森 健三
Takuro Matsunaga, Yoshihide Katagiri, Takuya Morishita,
Yoshimi Muraoka, Masashi Harada, Kenzo Fukumori
(株)豊田中央研究所
Toyota Central R&D Labs., Inc.
熱可塑性樹脂材料の射出成形過程における結晶化挙動のその場観察により、最終的な構造だけ
でなく構造形成メカニズムを明らかにすることを目的とし、放射光 X 線散乱法を用いた射出成形
プロセスのその場観察システムを構築した。本システムを用いて、カーボンナノチューブ(CNT)
を添加したポリフェニレンサルファイド(PPS)の結晶化過程を観察した。CNT 添加により高分
子の結晶化度が増大するだけでなく、分子配向が促進されること、結晶化速度が劇的に上昇する
ことがわかった。
キーワード: 小角/広角 X 線散乱、熱可塑性樹脂、射出成形、その場観察
背景と研究目的
射出成形過程において、熱可塑性樹脂は温度ジャンプ(溶融温度から金型温度)
、溶融・射
出時のせん断力、金型内でのせん断流動場、保圧といった複合的な外部刺激を受ける。非平
衡状態で構造の形成・凍結が起こるために、金型内で形成される構造が必ずしも最適でなく、
また安定でないことがある。実際に、結晶の相変化、再結晶化、配向緩和などを目的に、射
出成形後にアニール処理が施されることがある。成形過程-構造-物性が明確化されることに
より、工程の簡略・短縮化、射出成形条件の最適化による的確な構造制御が可能となり、さ
らに成形体(製品)の長期信頼性保証につながる。
実験
PPS はクレハ製 W202A を用いた。溶融混練により PPS に多層 CNT(保土ヶ谷化学製 NT-7)
を 0.5, 1.0, 3.0 vol%添加した組成の PPS/CNT 複合体試料を作製した。射出成形条件は、溶融
温度(バレル設定温度)300℃とし、金型温度は 140℃とした。各試料について金型内結晶化
過程のその場観察を行った。X 線散乱実験は SPring-8 BL33XU(豊田ビームライン)小角/広
角 X 線散乱システムを用いた。射出成形にはダンベル形状金型を用いた。ダンベル平行部の
中心位置に X 線ビームを照射し、透過散乱 X 線を検出器にて計測した。X 線のエネルギーは
、カメラ長は 4.5 m(小角 X 線散乱:SAXS)および 20 cm(広角 X
15 keV(波長λ: 0.826 Å)
線散乱:WAXS)を使用した。X 線散乱のデータは、SAXS, WAXS ともに 50 ミリ秒間隔(露
光時間:45 ミリ秒)で 1000 点(50 秒間)時分割測定を行った。
結果および考察
1. 広角 X 線散乱(WAXS)測定結果
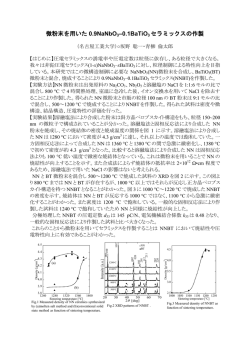
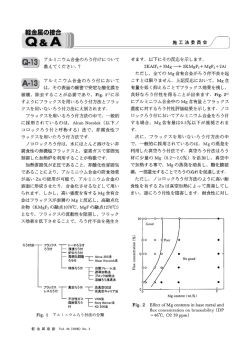
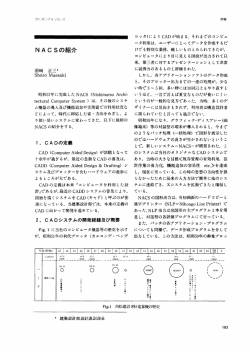
Fig. 1 に各試料の金型内で PPS の結晶化が十分に進んだ時点(約 45 秒後)における WAXS
4
豊田ビームライン研究発表会プロシーディングス 6, (2015) 4-9
二次元散乱像を示す。樹脂の流動方向は図中矢印で示した(検出器面に対して上から下)
。ど
の試料においても PPS の結晶構造に対応するピークが観測されたが、PPS 単体(CNT: 0 vol%)
では散乱パターンが等方的であるのに対し、CNT: 0.5, 1, 3 vol%複合体では流動方向に対して
垂直方向に散乱強度が強い異方性パターンが得られた。これは、CNT 存在下で PPS 分子が樹
脂流動方向に対して平行に配向して結晶化していることを示している。PPS は流動性が高く
単体では配向しないが、CNT 添加により分子配向が生じることがわかった。
CNT: 0 vol%
CNT: 0.5 vol%
CNT: 1 vol%
CNT: 3 vol%
Clow
5irection
isotropic
anisotropic
anisotropic
anisotropic
Figure 1. WAXS images for PPS and CNT/PPS composites (ca. 45 sec after injection)
Fig. 2 に WAXS 二次元散乱像において最も散乱強度が高い回折(200 面と 111 面)
(q = 1.43
Å )の方位角方向(検出器面内の角)の散乱強度を抽出した結果を示す。樹脂流動方向を 0°
とした。方位角 0°と 90°の散乱強度比を算出した結果を Table 1 に示す。CNT 添加量の増
加とともに散乱強度の異方性が大きくなった。
-1
Table 1. Scattering inteisity ratio of 90°
to 0° (azimuthal angle)
CCNT
【vol%】
Anisotropic
Factor
0
1.01
0.5
1.26
1
1.34
3
1.36
Figure 2. Azimuthal plots (q = 1.43 Å-1) for PPS and
CNT/PPS composite
散乱強度が高く検出された流動方向に対して垂直方向(±5°)に扇形平均をとり、WAXS ス
ペクトル(散乱強度 vs.散乱ベクトル)を求めた。散乱ベクトルは q≡4πsinθ / λ(2θ : 散乱角、
λ: X 線波長)で定義される。Fig. 3 に PPS 単体の WAXS スペクトルの時間変化を示す。縦
軸:X 線散乱強度、横軸:散乱ベクトル、奥行軸:時間(X 線照射位置に樹脂が流れてきた
時間を 0 とする)として示した。流入直後は非晶を示すハローのみが観測され、徐々に結晶
5
豊田ビームライン研究発表会プロシーディングス 6, (2015) 4-9
構造に由来するピークが現れた。ハローおよびピークを分離することにより結晶化度(相対
値)を算出した。相対結晶化度χc = 結晶ピーク面積 / 全散乱面積とした。
Figure 3. WAXS spectra during injection molding process for PPS
各試料に対して、扇形平均散乱強度を算出し、ピーク分離を行い相対結晶化度の時間変化を
調べた結果を Fig. 4 に示す。CNT 添加の効果として、1. 最終的な結晶化度の増大、2. 結晶
化開始時間の短縮、3. 結晶化速度の増大(結晶化完了時間が短い)があることがわかった。
特に、結晶化速度は CNT 添加量の少ない 0.5vol%においても劇的に変化しており、
これは CNT
の存在により PPS 結晶成長メカニズムが変化したことを示唆している。
Figure 4. Time evolution of χC for PPS and PPS/CNT composites in the injection molding process
Fig. 4 に示した結晶化度の時間変化について、Avrami プロット(縦軸:log{-ln(1-χC)}、横
軸:log t、t:時間)を行った結果を Fig. 5 に示す。また、得られた Avrami プロットの直線の
傾きから算出した Avrami 指数を Table 2 に示す。PPS 単体では Avrami 指数は 2 程度であるの
に対して、PPS/CNT 複合体においては、1.5 程度となった。これは、PPS のみでは均一核生
6
豊田ビームライン研究発表会プロシーディングス 6, (2015) 4-9
成だが、CNT 添加により不均一核生成による機構で結晶核が生成、成長をしていることを示
唆しており、PPS 中で CNT は結晶核剤として機能していると推察される。また、アスペクト
比が大きい CNT が流れに対して配向し、その後 CNT 周辺の PPS が結晶化していくと仮定す
ると、Fig. 1 に示した PPS 結晶構造の異方性に関しても説明可能である。
Table 2. Avrami index
CCNT
Avrami index
0
2.03
0.5
1.40
1
1.34
3
1.46
Figure 5. Avrami plots for PPS and PPS/CNT composites
2. 小角 X 線散乱(SAXS)測定結果
Fig. 6 に各試料の金型内で PPS の結晶化が十分に進んだ時点(約 45 秒後)における SAXS
二次元散乱像を示す。
CNT: 0 vol%
CNT: 0.5 vol%
CNT: 1 vol%
CNT: 3 vol%
Clow
5irection
Figure 6. SAXS images for PPS and CNT/PPS composites (ca. 45 sec after injection)
Fig. 1 の WAXS 二次元散乱像と異なり、SAXS では流動方向に散乱強度が強い異方性パター
ンが観測された。SAXS 領域で観察されるなだらかなピークは、板状結晶子間距離(ラメラ
間距離、長周期と呼ばれる)に対応する。WAXS スペクトルより PPS 分子鎖が流動方向に平
行に並び結晶化することが示されており、集合体であるラメラは流動方向に並ぶことにより
長周期のピークは流動方向に散乱強度が強く観測されたと考えられる。Fig. 6(結晶化が十分
に進んだ時点: 約 45 秒後)の SAXS スペクトルを Fig. 7 に示す。SAXS スペクトルは流動方
向に対して平行方向(散乱強度が強く出る方向に)±5°の扇形平均をとることで算出した。
縦軸は散乱強度に散乱ベクトルの二乗(q2)を乗じ、ラメラのピーク情報のみのスペクトル
とした。CNT 添加によりラメラのピーク位置(ラメラ間距離)、ピーク強度(ラメラ数、散
乱コントラスト)に変化がみられた。
7
豊田ビームライン研究発表会プロシーディングス 6, (2015) 4-9
Figure 7. SAXS curves for PPS and PPS/CNT composites
Fig. 8 に射出成形時の金型内における SAXS スペクトルから求めた散乱ピーク強度および
(左図)ピーク強度は流動方向に並んだ(±
ラメラ間距離(D = 2π / qpeak)の時間変化を示す。
5°の幅で)ラメラの数に対応する。CNT 添加の有無により大きな違いがあり、WAXS の結果
(相対結晶化度)と対応する。PPS 単体では、流入から約 3 秒後ピークが現れ、約 20 秒かけ
て成長したのに対し、PPS/CNT 複合体では、流入後すぐにラメラの生成および成長が進み、
結晶化度が 50%を超えて結晶/非晶のコントラストが逆転し、散乱強度が低下する現象がみら
れた。Fig. 8 右図にラメラ間距離の変化を示す。CNT 添加の有無に関わらず約 5 秒で距離の
変化は終了し、結晶化の進行とは関係がないことがわかる。また CNT 添加により PPS 単体
と比べて、形成されるラメラ長周期が大きいことがわかった。これは WAXS による結晶化度
の増大と対応する結果と考えられる。流入直後の挙動に関しても CNT 添加の有無で異なって
おり、PPS 単体では、ラメラ間距離は徐々に大きくなるのに対し、PPS/CNT 複合体では徐々
にラメラ間距離が小さくなりながら構造が凍結されており、Fig. 5 で示した核生成機構の違
いを支持する結果となった。PPS 単体では、核生成・成長の過程においてラメラ周期が大き
くなるが、PPS/CNT 複合体では、初期段階から大きなドメイン(周期)が出現し、徐々に小
さくなりながらラメラ間距離がある距離に収束する相分離的な挙動が観測された。
Figure 8. (left) Lamellar long period and (right) scattering intensities changes for PPS and
PPS/CNT composites in the injection mold
8
豊田ビームライン研究発表会プロシーディングス 6, (2015) 4-9
まとめ
放射光 X 線散乱法により PPS/CNT 複合体の射出成形機金型内結晶化挙動のその場観察を
行った。CNT 添加による PPS 結晶化挙動への影響として以下の 3 点がわかった。1. CNT 添
加により PPS 結晶構造に異方性が現れた。樹脂の流れ方向に対して水平方向に PPS 鎖が優先
的に配向した。2. CNT 添加により最終的な結晶化度が向上するのみならず、結晶化開始時間
が早まり、また結晶化速度も向上した。3. CNT 添加により PPS ラメラ間距離も変化し、また
ラメラ形成機構にも違いがあることがわかった。
9
豊田ビームライン研究発表会プロシーディングス 6, (2015) 10-15
2014A7008,2014B7008,2015A7008
BL33XU
放射光 X 線を用いた Li イオン電池正負極反応の同時測定
Operando measurements of positive and negative electrodes using
synchrotron X-ray
岡 秀亮, 牧村 嘉也, 西村 友作, 野中 敬正, 奥田 匠昭,
川浦宏之, 宇山健, 近藤広規, 佐々木厳
Hideaki Oka, Yoshinari Makimura, Yusaku F Nishimura, Takamasa Nonaka, Chikaaki Okuda,
Hiroyuki Kawaura, Ken Uyama, Hiroki Kondo, Tsuyoshi Sasaki
(株)豊田中央研究所
Toyota Central R&D Labs. Inc.
Li イオン電池は高い安全性・信頼性が求められており、正負極活物質と電解液の反応挙動を定
量的に理解することが重要である。そこで、放射光を利用した X 線吸収微細構造解析(XAFS)-X
線回折(XRD)同時測定技術により過充電領域の正負極構造変化を評価し、温度上昇による正規反
応と副反応への影響について検討した。その結果、温度上昇時には、正極では Co の酸化領域にお
いて副反応が増加すること、負極では充電初期から副反応が生じることが明らかになった。
キーワード: リチウムイオン二次電池、副反応、XAFS、XRD、in-situ
背景と研究目的
Li イオン電池は、携帯電話やポータブル PC などのモバイル用途に加えて、ハイブリッド
自動車や電気自動車など車載用途への展開が活発になされている。このような車載用途では、
モバイル用途に比較して電流・電圧・温度など過酷な条件で使用されることが予想される。
そのため、電池を長く、安全に使用するためには、通常使用範囲内における電池劣化解析に
加えて、さらに一歩踏み込んだ異常領域での電池解析が必要であると考え、異常領域におけ
る正極および負極の挙動について報告をしてきた。例えば、電池を高温で使用した際には、
正極活物質粒子表面に劣化相が生成することを定量的に解析した[1]。また、電池が熱暴走す
ることを想定した 500℃付近までの昇温時における正極活物質の電子状態変化および結晶構
造を、XAFS-XRD を組み合わせた技術により明らかにした[2]。電圧軸では、正極を過充電し
た際の構造変化挙動を検討した結果、通常の充放電では出現しない過充電劣化相が生成する
ことを解明した[3]。
また、電池内の状況を熱と電気化学を連成させた計算機シミュレーションを用いて把握す
る取り組みも進めている[4]。電池が過充電された際の挙動についてモデル化するためには、
熱挙動、抵抗変化と合わせて副反応挙動を解明する必要がある。特に電池内の副反応につい
ては、電池が過充電された際の物質組成変化をもたらすだけでなく、副反応のジュール熱自
体が電池発熱要因となる。そのため、過充電時の正規反応(活物質からの Li 脱離/活物質へ
の Li 挿入)と副反応(電解液の酸化/還元分解など)を定量的に把握することが重要である。
電池を解体して電極を分析することで副反応量を見積もることは可能であるが、過充電状態
の電極は非常に不安定であり、解体して得た電極は電池内とは状態が変化する可能性が高い。
充放電とともに in-situ で XAFS と XRD を行う技術は報告されているが[5]、さらに温度制御
と組み合わせた技術については過去に報告例がない。そこで我々は、充放電に伴う正負極の
構造変化を「同時」に「同一箇所」で「温度制御」下で評価することが可能な in-situ XAFS-XRD
測定技術を開発した。本報告では、室温から 100℃まで温度を制御した際の過充電時の正極
10
豊田ビームライン研究発表会プロシーディングス 6, (2015) 10-15
と負極の構造変化に関して検討した結果を報告する。
実験
測定用ラミネートセルの作製
正極活物質として LiNi0.75Co0.15Al0.05Mg0.05O2 を、負極として非晶質炭素コート天然黒鉛を、
電解液として 1M-LiPF6 in EC/DMC/EMC=30/40/30vol.%を用いた。正極塗工部を 16mmφ、負
極塗工部を 17mmφ とし、集電用のタブの幅を 6mm として可能な限り電解液と集電箔未塗工
部の接触面積を低減した。正負極の間にポリエチレン製セパレータを挟み、溶着テープ付き
のタブをそれぞれの電極に溶接した。Ar 雰囲気グローブボックス内で電解液 150μl を注入し、
シールすることで密閉セルを作製した。また、評価セルは正負極それぞれに電流・電圧端子
を設置した 4 端子セルとして、電流線と電圧線を対角で接続して、電極内で均一に反応する
ようにした。さらに、温度を上げて過充電試験を実施する際には、電解液分解などの副反応
によりガスが発生し、ラミネートセルが膨れて破裂あるいは電極対向部における極間距離増
加の可能性がある。そこで、電極拘束部(40mm×40mm)の外側の空間を広くしてガス溜め
とすることで、ガス発生時にも上記の懸念を払拭できるようにした。作製したラミネートセ
ルは、数サイクルのコンディショニング充放電(4.1 – 3.0V、C/5 レート)を実施して充放電
容量を確認してから、過充電試験に供した。
過充電 in-situ XAFS-XRD 測定
放射光測定は、SPring-8 の豊田ビームライン(BL33XU)で行った。X 線光路上に設置し
た強度モニターから吸光度を算出して XAFS 測定を、ラミネートセルからの回折線を高速二
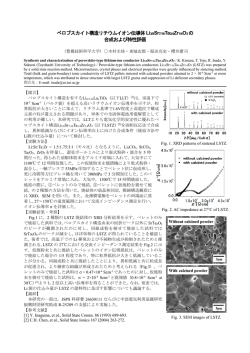
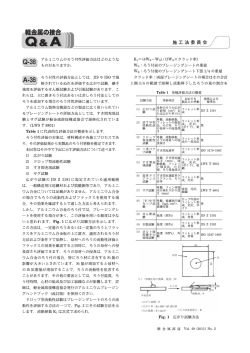
次元 X 線検出器で検出して XRD 測定を実施した。測定系の模式図、および写真を Fig.1 に示
す。3V に定電流-定電圧放電を行い SOC を 0%に調整したラミネートセルを昇温用治具に固
定した後、規定の温度(30℃(室温)
、50℃、80℃、100℃)に制御した。過充電試験条件は、
2
2mA/cm (2C レート)の電流で、充電時間 66 分(SOC220%相当)あるいは上限電圧 10V の
いずれかを終止条件とした。XAFS 測定を 40 秒、XRD 測定を 80 秒として、XAFS-XRD を 1
セット測定する時間を 120 秒とした。XAFS 測定では Ni-K、Co-K 吸収端付近(7.398~
8.924keV)で実施した。Ni については規格化後の吸収係数 50%の吸収端エネルギーを用いて
Ni 価数を評価可能なことが報告されており[6]、今回もこの値を用いて検討した。Co につい
ては 50%吸収端エネルギーと合わせて XANES スペクトルのピークトップエネルギーも検討
した。XRD 測定は 8.0478keV(Cu-Kα)のエネルギーで測定し、黒鉛への Li 挿入脱離で層方
向の秩序構造に由来し特徴的な変化を示す 002 反射ピークが含まれる 2θ=23~27º 付近を測定
Laminate Cell
範囲とした。
Potentiostat
2D X-ray
detector
Heating Air
XRD
(002) reflection of graphite
⇒Li contents of NE
X-ray
Laminate Cell
Detector : I0
Detector : I
XAFS
Absorbance: ln(I0/I)
Valence (Ni, Co)
⇒Li contents of PE
Be plate
Degradation
Positive electrode(PE)
Negative electrode(NE)
Figure 1. (Left) Schematic drawing of setting for in-situ XAFS-XRD measurement, (Right) Picture of
heating apparatus.
11
豊田ビームライン研究発表会プロシーディングス 6, (2015) 10-15
結果および考察
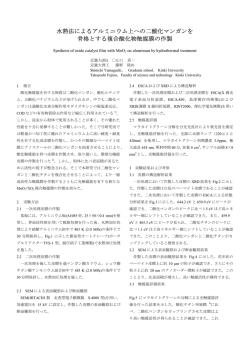
in-situ XAFS-XRD 測定時に得られた過充電曲線の温度依存性を Fig.2 に示す。SOC100%以
上で温度による過充電曲線の変化が大きく、温度上昇により過充電領域での電圧が低下する
ことが分かった。
Figure 2. Charging curves of laminate cells at 30, 50, 80, and 100°C.
XAFS 測定で得られる X 線吸収端近傍構造(XANES)スペクトルの一例(室温)を Fig.3
に示す。Ni-K については充電に伴い高エネルギー側へのシフトを、Co-K については充電に
伴いスペクトル形状の複雑な変化を示した。
Charging
Charging
(b) Co-K
Peak top
energy
Intensity / a.u.
(a) Ni-K
50% Absorption energy
50%Absorption energy
Figure 3. XANES spectra of (a) Ni-K and (b) Co-K during charging at 30ºC.
XANES スペクトルから算出した過充電時 Ni-K 吸収端エネルギー変化の温度依存性を
Fig.4 に示す。SOC100%付近までは充電に伴い Ni-K 吸収端エネルギーが増加しており、Li
脱離に伴う価数補償は Ni が担うことが確認された。また、30℃(室温)~100℃では Ni-K
吸収端エネルギー変化に大きな違いは見られなかった。
過充電時 Co-K 吸収端エネルギー変化の温度依存性を Fig.5(a)に示す。SOC100%以上で
Co-K 吸収端エネルギーが変化しており、その挙動に温度による影響は無いように見える。し
かし、Fig.3(b)で分かるように、Co-K の 50%吸収端エネルギーは充電による変化が非常に小
さく、詳細な検討を行うことが難しい。そこで、Co の価数変化については、充放電に伴うエ
12
豊田ビームライン研究発表会プロシーディングス 6, (2015) 10-15
ネルギー変化が大きいピークトップエネルギーも合わせて検討した。過充電時 Co-K 吸収端
ピークトップエネルギー変化の温度依存性を Fig.5(b)に示す。SOC100%までの Ni 酸化領域に
おいて Co-K ピークトップエネルギーも変化を示すが、これは Ni の価数変化に伴うイオン半
径変化により近傍に存在する Co の電子状態が影響を受けたためであり、この領域では Co の
酸化は生じていないと考えらえる。一方、SOC100%以上の Co 酸化領域に注目をすると、温
度が高くなるにつれて傾きが低下することが明らかになった。つまり、SOC100%以上におい
て正極で副反応が生じ、温度上昇とともに副反応量が増大するため、正極活物質からの Li
脱離が抑制され Co の価数上昇の傾きが低下したものと考えられる。Co-K ピークトップエネ
ルギー変化の傾きから、80℃では約 9%、100℃では約 18%の電流が副反応に費やされている
ことが示唆された。
Ni-K edge absorption energy / eV
8344
8343.5
8343
8342.5
30℃
50℃
80℃
100℃
8342
Co-redox
Ni-redox
8341.5
0
50
100
150
SOC / %
200
250
Figure 4. Ni-K absorption energies of Li1-xNi0.75Co0.15Al0.05Mg0.05O2 during charging
at 30, 50, 80, and 100°C.
(a)
7721.5
7729.5
Co-K 50% absorption energy
7721
7720.5
7720
7719.5
7719
Ni-redox
7718.5
0
(b)
7729
Co-K peak top energy / eV
Co-K edge absorption energy / eV
7722
50
Co-redox
100
150
SOC / %
30℃
50℃
80℃
100℃
30℃
50℃
80℃
100℃
7728.5
7728
7727.5
7727
7726.5
Ni-redox
7726
200
250
Co-K peak top energy
0
50
Co-redox
100
150
SOC / %
200
250
Figure 5. (a) Co-K absorption energies and (b) Co-K peak top energies of Li1-xNi0.75Co0.15Al0.05Mg0.05O2
during charging at 30, 50, 80, and 100°C.
次に、負極での副反応を定量的に解明するために、XAFS と同時に同一箇所で測定した
XRD 測定結果を示す。充電時、黒鉛 002 反射ピーク変化の温度依存性を Fig.6 に示す。充電
開始時には Li が挿入されていない黒鉛のピークが観測され、複数の相変化を経て C12Li 相が
生成し、さらに充電が進行すると C6Li 相が生成した。温度を 30~100℃と変化させた場合に
おいては、相変化挙動自体は大きく変化しないことが分かる。
13
豊田ビームライン研究発表会プロシーディングス 6, (2015) 10-15
C6Li
SOC200%
C12Li
SOC100%
graphite
SOC0%
(a) 30℃
(b) 50℃
(c) 80℃
(d) 100℃
Figure 6. In-situ XRD profiles of laminate cells during charging at (a) 30, (b) 50, (c) 80, and (d) 100ºC.
さらに詳細に副反応について検討をするため、Fig.6 の XRD プロファイルにおける C12Li
から C6Li への相変化の速度に注目をした。C12Li と C6Li のピーク強度より、黒鉛への Li 挿
入状態の指標となる値 H を以下の式で算出した。
H = Int(C6Li) / {Int(C6Li) + Int(C12Li)} * 100
C6Li 相が生成し始めると H 値が増加し、黒鉛に Li が挿入して全て C6Li となると H 値が 100
となる。各温度における H 値変化を Fig.7 に示す。SOC100%前後で C6Li 相が生成し始め、
C12Li 相の減少とともに C6Li 相が増加する。最終的には 50、80℃では H=100 となるが、30、
100℃では H=100 まで到達せずに終了している。
120
30℃
100
50℃
80℃
H value
80
②
100℃
60
40
③
20
①
0
0
50
100
150
200
250
SOC / %
Figure 7. H values calculated from in-situ XRD profiles of graphite during charging at 30, 50, 80, and 100ºC .
14
豊田ビームライン研究発表会プロシーディングス 6, (2015) 10-15
Fig.7 より明らかになった黒鉛負極での過充電挙動について以下に要点を示す。
①温度が高いほど C6Li 生成が遅れる
②100℃では充電末期に C6Li 生成が停止
③30℃では他の温度に比べて C6Li 生成速度(H 値の傾き)が低下
①について SOC100%付近の C6Li 相が生成し始める領域に注目をすると、温度が高いほど
C6Li 生成開始のポイントが高 SOC 側にずれている。これは黒鉛負極への Li 挿入以外に費
やされる電流が多いことを意味しており、負極では SOC100%までの通常使用領域で副反応
が生じることを示唆した。正極では SOC100%以上の高 SOC 領域でのみ、高温での副反応
が増加することを確認しており、正極と負極では副反応挙動が大きく異なると考えられる。
また、②で示したように、100℃では充電末期で H 値が 90 程度で変化しない、つまり充電
はしているが C6Li 相が増加しない領域が見られた。この領域では負極では全ての電流が副
反応に供されている状態と考えられる。このような挙動を示した理由は定かではないが、
正負極の副反応挙動が原因と推測される。正極では温度上昇により特に高 SOC 領域で副反
応が増加すること、つまり正極からの Li 脱離が抑制されることを示した。一方、負極では
温度上昇により低 SOC から副反応が増加する。負極での副反応としては、電解液の還元分
解による被膜生成が想定されるため、負極では Li 電解質が消費される。つまり、温度上昇
により、正極から電解液への Li 供給が減少するとともに、負極での Li 消費が増加すること
から、電解液中の Li 塩濃度が低下することが予想される。このため、100℃では充電しても
黒鉛中に Li が挿入されない挙動が生じたと考えられる。
③の 30℃での挙動については、高温での電解液分解とは異なる副反応が生じたと考えられ
る。①で注目した C6Li 相が生成する領域は、30℃で最も早い SOC から C6Li 相が生成した。
一方、その後の C6Li 相増加の傾きが低下しており、C12Li/C6Li の 2 相反応領域で特異的な
副反応が生じていることが示唆された。上記 2 相反応は 100mV vs. Li+/Li 以下の非常に卑な
電位で充放電が進行し、金属 Li の電位と近い。抵抗による分極が大きい場合は、Li 析出反
応が起こる可能性が高い。つまり、最も温度が低い 30℃では過充電領域で Li 析出反応が起
きたため、C6Li の生成速度が低下したと推測される。
今後の課題
このように in-situ XAFS-XRD 測定技術を用いて、過充電時の正規反応と副反応に対する
温度の影響を定量的に把握することを検討した。その結果、温度上昇により、正極では Co
の酸化領域において副反応が増加し、負極では充電初期から副反応が生じることが明らか
となった。今後は正規反応と副反応の定量的な解釈を進めることで、過充電時の電池熱暴
走モデル計算による電池挙動予測技術の構築を進める予定である。
参考文献
[1] T. Sasaki et al., J. Electrochem. Soc., 156, A289, (2009)
[2] Y. Makimura et al., ECS Electrochem. Lett., 3, A66, (2014)
[3] T. Sasaki et al., J. Eletctrochem. Soc., 158, A1214, (2011)
[4] M. Balasubramamian et al., J. Power Sources, 92, 1, (2001)
[5] N. Baba et al., J. Power Sources, 252, 214, (2014)
[6] O'Grady et al., J. Electrochem. Soc., 143, 1613, (1996)
15
豊田ビームライン研究発表会プロシーディングス 6, (2015) 16-20
2014B7002
BL33XU
マイクロビーム走査型 3DXRD 顕微鏡へ向けた
高エネルギーマイクロビームの形成
Installation of High-energy Microbeam Optics at the Toyota Beamline for
Scanning Three-dimensional X-ray Diffraction Microscopy
林 雄二郎
Yujiro Hayashi
(株)豊田中央研究所
Toyota Central R&D Labs., Inc.
金属材料内部の結晶方位と応力の非破壊 3 次元マッピングを可能にする走査型 3 次元 X 線回折
顕微鏡法の開発を行っている。それに向けて 50keV 放射光 X 線集光光学系を導入した。集光ビー
ムサイズ及び強度はそれぞれ垂直 1.6μm×水平 1.3μm 及び 5.9×10⁹ photons/s が得られた。
キーワード: 走査型 3 次元 X 線回折顕微鏡、高エネルギーマイクロビーム、金属材料
背景と研究目的
3 次元 X 線回折(3 Dimensional X-ray Diffraction, 3DXRD)顕微鏡法[1-2]は高エネルギー
放射光 X 線を用いて金属材料内部の各結晶粒の結晶方位及び応力を非破壊で測定することを
可能にした新しい手法である。塑性変形・疲労・クリープ中における金属材料内部の各結晶
粒の変形・損傷挙動を実際に観察できると期待されている。これまでに塑性変形中の結晶粒
分解臨界せん断応力[3]や結晶回転[4-9]、亀裂先端[10]や双晶変形中[10-13]、低温クリープ
[14]中の結晶粒分解応力分布の観察が報告されている。金属材料の強度特性を予測する結晶
塑性有限要素モデルの新しい検証方法としても注目されている。高エネルギーX 線を用いる
ため鉄鋼材料の観察が可能であるため工業的にも有用である[6, 9, 15]。
3DXRD 法は単色 X 線を多結晶試料に入射し試料を回転させながら試料透過位置に配置した 2
次元検出器により回折 X 線を検出する、言わば多結晶の回転結晶法である[1-2]。複数の結晶
粒からの回折斑点が検出器上で重ならないような実験条件とし、結晶系及び格子定数を既知
として、回折斑点がどの結晶粒によるものであるかを判別する。この判定には回折の指数付
けも同時に行われるため多結晶指数付けと呼ばれる。3DXRD 法には目的に応じていくつかの
測定モードや解析モードが提案されており異なる名称で呼ばれることもあるが、格子定数が
既知の多結晶試料から得られる回転結晶法的実験データから多結晶指数付けを行うことを共
通としている。例えば Near-field High-energy X-ray Diffraction Microscopy (nf-HEDM)[7]
と呼ばれる方法では 3 次元的な粒の形を再現するために、試料外径と同程度の幅をもったシ
ート状のビームを照射し、近接場検出器として試料近くに設置した高空間分解能 X 線カメラ
により回折 X 線を検出し、この断面の結晶粒マップを積み重ねることにより 3 次元結晶粒マ
ップを得る。いずれにしても多結晶指数付けを基本としているため異なる結晶粒からの回折
斑点が検出器上で重ならないようにする必要がある。これは試料中の結晶粒の数に制約があ
ることを意味している。そのため、これまで報告されている実験では結晶粒径を粗大化させ
た試料がよく用いられている。
豊田ビームライン[16]では自動車材料の先進分析技術の開発を目指して第 1 期としてサー
ボモータ直接駆動型液体窒素冷却コンパクト分光器による 10ms 時間分解 XAFS(Super Quick
16
豊田ビームライン研究発表会プロシーディングス 6, (2015) 16-20
XAFS)法[17]を開発した。第 2 期として 3DXRD 的手法による実用金属材料の観察技術の開発を
計画し、実用材を粗大粒化せずに大きな外径の試料を取り扱うために新たに走査型 3DXRD 法
を提案した[18]。走査型 3DXRD 法では入射ビームサイズを結晶粒径より小さくすることによ
り回折斑点の重なりを抑える。これにより nf-HEDM と比べてより小さい粒径、またはより大
きな外径の試料の取り扱いを可能にする。また、走査型 3DXRD 法では入射ビームサイズが空
間分解能を担っているため近接場検出器は必要なく、使用する検出器は遠距離場検出器のみ
である。そのため試料空間を大きくとることができ、その場観察試験機等の設置が容易とな
る。しかし、nf-HEDM と比べて試料走査軸が 1 軸増え、3 次元再構成には試料の 3 軸走査を要
する。大型放射光施設の限られたマシンタイムの中で 3 軸走査を実現するためには、検出器
の露光時間を短く、すなわち入射 X 線ビーム強度を大きくすることが鍵である。また、なる
べく大きな外径の金属試料を透過させるため高エネルギーX 線である必要がある。そこで走
査型 3DXRD 法による外径 1×1mm の鋼試料の観察を目指して 50keV マイクロビーム集光光学系
を導入し、2014B 期において集光実験を行った。また、冷間圧延軟鋼板 1mm 厚を試料として X
線回折パターンを短露光時間で測定し 3 軸走査の可能性を探った。
実験
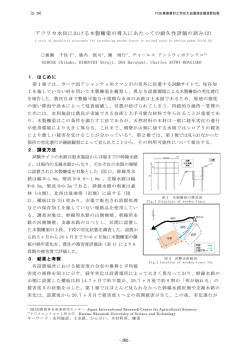
導入した 50keV マイクロビーム光学系を図 1 に示す。液体窒素冷却 2 結晶分光器 Si(311)
により 50keV に単色化したアンジュレータ放射光を仮想光源用スリットを通して、
Kirpatrick and Baez (KB)配置ミラーにより集光する。垂直及び水平方向の集光をそれぞれ
第 1 及び第 2KB ミラー(JM400, JTEC)によって行う。第 1 及び第 2KB ミラーの基材は共に Si
単結晶 400mm 長で Pt をコーティングし、入射角は約 1.3mrad である。KB ミラーはサブ 50nm
レベル集光精度 KB ミラーマニピュレーションシステム[19](JM2000-400, JTEC)に搭載し位置
合わせを行う。仮想光源スリットから第 2KB ミラー下流端までの距離、及び第 2KB ミラー下
流端から集光位置までの距離は、それぞれ 82,140mm 及び 360mm である。垂直及び水平方向
の縮小倍率はそれぞれ 1/81.5 及び 1/146 である。
集光ビームサイズ評価のため、集光位置に設置したナイフエッジによりエッジスキャンを
行った。得られたエッジスキャンプロファイルを誤差関数によりフィッティングし、誤差関
数曲線の微分に相当するガウス曲線の半値全幅(FWHM)を求めた。また、集光ビーム強度測定
にはイオンチャンバ(31cm, Kr)を用い、イオンチャンバの電流値からフラックスへの変換に
は Hephaestus Ver. 0.18 を用いた。仮想光源スリットの開口を垂直 80μm×水平 140μm と
し、集光ビームサイズ設計値を 1.0×1.0μm とした。
マイクロビームを冷間圧延鋼板 SPCC (JIS G 3141) 1mm 厚に垂直に入射し、試料透過位置
に設置した CMOS フラットパネル検出器により X 線回折パターンを測定した。SPCC 試料中α
Fe の平均粒径は約 15μm である。
フラットパネル検出器の露光時間は 30ms、受光面積は 230mm
×291mm、試料・検出器間距離は約 410mm である。
結果および考察
垂直及び水平方向のエッジスキャンプロファイルをそれぞれ図 2 及び図 3 に示す。垂直及
び水平方向の FWHM はそれぞれ 1.6μm 及び 1.3μm である。集光ビームサイズが設計値より
も大きくなっているのは、集光装置の調整不足によるものや KB ミラーの振動が原因であると
考えられる。集光ビーム強度は 5.9×10⁹ photons/s であった。次に、X 線回折パターン画
像の結果を図 4 に示す(集光ビーム位置は画像ほぼ中央である)
。3DXRD 解析が可能な程度の
斑点状の回折パターンが得られている。回折強度が十分得られているかどうかを評価するに
は、試料を 1×1mm 程度の角棒状に切り出し回転させて 3DXRD 解析しなければならないが、こ
れについては 2015A,B 期に実施した。2016 年度以降に報告の予定である。
17
豊田ビームライン研究発表会プロシーディングス 6, (2015) 16-20
今後の課題
30ms 露光で 1 つの回折パターンを得ることができたため、今後は、1 つの 3D 測定にかかる
時間を 12 時間を目安として試料 3 軸走査システムを構築する予定である。これにより実用鋼
の 3D 結晶方位及び応力マッピングを目指す。
謝辞
K-B ミラー集光装置の導入にあたり(公財)高輝度光科学研究センター大橋治彦博士、湯
本博勝博士に多大なるご協力を頂きました。深くお礼申し上げます。なお、本研究は JSPS
科研費 26870932 の助成を受けたものです。
参考文献
[1] H. F. Poulsen, Three-Dimensional X-ray Diffraction Microscopy (Springer, Berlin, 2004).
[2] H. F. Poulsen, J. Appl. Cryst. 45, 1084-1097 (2012).
[3] N. Y. Juul, G. Winther, and J. Oddershede, "Deformation-induced microstructural changes in austenitic
steel", 8th International Conference on Mechanical Stress Evaluation by Neutrons and Synchrotron
Radiation (MECASENS 2015), Grenoble, September 30, 2015.
[4] L. Margulies, G. Winther, and H. F. Poulsen, Science 291, 2392-2394 (2001).
[5] H. F. Poulsen, L. Margulies, S. Schmidt, and G. Winther, Acta Mater. 51, 3821-3830 (2003).
[6] J. Oddershede, J. Wright, L. Margulies, X. Huang, H. F. Poulsen, S. Schmidt, and G. Winther,
Proceedings of the 31st Riso International Symposium on Materials Science, edited by N. Hansen, D.
Juul Jensen, S. F. Nielsen, H. F. Poulsen, and B. Ralph, 329-366 (2010), DTU Press.
[7] S. F. Li, J. Lind, C. M. Hefferan, R. Pokharel, U. Lienert, A. D. Rollett, and R. M. Suter, J. Appl. Cryst.
45, 1098-1108 (2012).
[8] R. Pokharel, J. Lind, A. K. Kanjarla, R. A. Lebensohn, S. F. Li, P. Kenesei, R. M. Suter, and A. D.
Rollett, Annu. Rev. Condens. Matter Phys. 5, 317-346 (2014).
[9] J. Oddershede, J. P. Wright, A. Beaudoin, and G. Winther, Acta Mater. 85, 301-313 (2015).
[10] J. Oddershede, B. Camin, S. Schmidt, L. P. Mikkelsen, H. O. Sorensen, U. Lienert, H. F. Poulsen and
W. Reimers, Acta Mater. 60, 3570-3580 (2012).
[11] C. C. Aydiner, J. V. Bernier, B. Clausen, U. Lienert, C. N. Tome and D. W. Brown, Phys. Rev. B 80,
024113 (2009).
[12] L. Wang, J. Lind, H. Phukan, P. Kenesei, J. S. Park, R. M. Suter, A. J. Beaudoin and T. R. Bieler,
Scripta Mater. 92, 35-38 (2014).
[13] H. Abdolvand, M. Majkut, J. Oddershede, J. P. Wright and M. R. Daymond, Acta Mater. 93, 246-255
(2015).
[14] J. V. Bernier, P. Shade, and T. J. Turner, "Quantifying the mechanical response of polycrystalline
materials at the mesoscale via 3D-XRD", 8th International Conference on Mechanical Stress
Evaluation by Neutrons and Synchrotron Radiation (MECASENS 2015), Grenoble, October 2, 2015.
18
豊田ビームライン研究発表会プロシーディングス 6, (2015) 16-20
[15] J. Oddershede, S. Schmidt, H. F. Poulsen, H. O. Sorensen, J. P. Wright, and W. Reimers, J. Appl. Cryst.
43, 539-549 (2010).
[16] T. Nonaka, K. Dohmae, Y. Hayashi, T. Araki, S. Yamaguchi, Y. Nagai, Y. Hirose, T. Tanaka, H.
Kitamura, T. Uruga, H. Yamazaki, H. Yumoto, H. Ohashi, and S. Goto, "Toyota beamline (BL33XU)
at SPring-8", AIP Conf. Proc., in press.
[17] T. Nonaka, K. Dohmae, T. Araki, Y. Hayashi, Y. Hirose, T. Uruga, H. Yamazaki, T. Mochizuki, T.
Tanida, and S. Goto, Rev. Sci. Instrum. 83, 083112 (2012).
[18] Y. Hayashi, Y. Hirose, and Y. Seno, J. Appl. Cryst. 48, 1094-1101 (2015).
[19] S. Matsuyama, H. Mimura, H. Yumoto, H. Hara, K. Yamamura, Y. Sano, K. Endo, Y. Mori, M.
Yabashi, Y. Nishino, K. Tamasaku, T. Ishikawa, and K. Yamauchi, Rev. Sci. Instrum. 77, 093107
(2006).
図 1. 豊田ビームラインにおける高エネルギーマイクロビーム集光光学系
図 2. 垂直方向エッジスキャンプロファイル. プロットは実験結果、点線は誤差関数によるフィッ
ティング結果. 誤差関数の微分に相当するガウシアンの半値全幅は 1.6μm である.
19
豊田ビームライン研究発表会プロシーディングス 6, (2015) 16-20
図 3. 水平方向エッジスキャンプロファイル. プロットは実験結果、点線は誤差関数によるフィッ
ティング結果. 誤差関数の微分に相当するガウシアンの半値全幅は 1.3μm である.
図 4. 冷間圧延軟鋼板 SPCC 1mm 厚の X 線回折パターン. 露光時間は 30ms.
20
豊田ビームライン研究発表会プロシーディングス 6, (2015) 21-24
2014A7012, 2014B7012
BL33XU
放射光ラミノグラフィによる部品内部微小領域の形態計測
Internal Morphology Measurement of Microscopic Volume
in Large Electronic Board by Synchrotron Laminography
宇山 健 a、木村 英彦 a、浅田 崇史 a、山口 聡 a、林 雄二郎 a、加納 大樹 a
Takeshi Uyamaa, Hidehiko Kimuraa, Takashi Asadaa, Satoshi Yamaguchia,
Yujiro Hayashia and Taiki Kanoa
a
a
(株)豊田中央研究所
Toyota Central Research and Development Labs., Inc.
機械部品や電子部品では、損傷が内部で発生する場合があり、その信頼性評価には非破壊計測
による内部形態の把握が重要である。本実験では、放射光ラミノグラフィにより、大型の市販電
子基板を切断せずフルサイズ(約 300×190 mm)のまま計測し、内部のミクロな 3 次元形態を可
視化できるか検証した。その結果、はんだ内に存在する約 4 µm の微小な残留ボイドを鮮明に 3
次元で可視化できた。熱疲労などの損傷過程において内部で変化する損傷挙動の追跡計測に有用
な技術といえる。
キーワード: 放射光イメージング、ラミノグラフィ、エレクトロニクス、内部形態、損傷、非破
壊計測
背景と研究目的
機械部品や電子部品の多くは、金属や無機材料などの異種材料を接合して作られるため、
線膨張係数の差や使用時の温度分布等により、内部に応力が発生し、そのために損傷が引き
起こされる場合がある。これらを評価するために部品を切断すると、損傷の過程を追跡計測
できなくなり、また拘束状態が変化するため正確な応力や損傷を測定できないという課題が
あった。新部品の開発において高い信頼性を確保するため、非破壊計測による内部の応力お
よび形態の可視化技術が必要とされている。そこで我々は、内部応力の計測については、鈴
木らの回転スリットを用いた回折法 [1]を改良して、さらに時空間分解能を高めた計測法を
提案し、その場負荷装置も開発して、SPring-8 の BL33XU(豊田ビームライン)にて、その
場負荷下での Al 合金の内部ひずみ分布計測などを行ってきた[2]。また、内部の形態計測に
ついては、部品を切断せずに高分解能な 3 次元計測を実現できる放射光ラミノグラフィが有
用であり[3, 4]、小型のパワーデバイス等で計測条件の探索を行ってきた[5]。本研究では、豊
田ビームラインにラミノグラフィ計測系を立上げ、大型の部品を切断せずに計測し、ミクロ
ン・オーダーで内部形態を可視化できるか検証した。
実験
計測試料は市販のパソコン用大型電子基板であり、切断せずにフルサイズ(約 300×190
mm)のまま計測した。基板上のチップ抵抗が実装された位置を計測対象とした。
豊田ビームラインにおける放射光ラミノグラフィ計測のセットアップを図 1 に示す。放射
光のエネルギーは試料中の Sn の吸収端を考慮して 29 keV とし、試料は垂直軸から 30 度傾け
た回転ステージ上に設置した。360°回転させながら 0.1°間隔で 3600 枚の透過像を撮影した。
21
豊田ビームライン研究発表会プロシーディングス 6, (2015) 21-24
撮影には CMOS カメラを使用し、画像の解像度は約 1.3 µm/pixel とした。
Figure 1 Experimental set-up of synchrotron
laminography measurement for full-size circuit board
at BL33XU, TOYOTA beam line, of SPring-8.
結果および考察
再構成した 3 次元像の斜視図を図 2 に示す。黒点線で示したチップ抵抗の両端がはんだフ
ィレットで、基板内の配線のスルーホールなど 3 次元の形態を取得できた。白点線で示した
仮想断面(xy 面)におけるはんだ内のスライス像を図 3 に示す。チップ抵抗の下の位置に比
較的多く残留ボイドが観察される。本試料は市販パソコン用基板の未使用品であるが、はん
だ内には製造工程等で発生したボイドの残留が確認され、これらの初期形状と分布を考慮し
た損傷許容設計が重要になると考えられる。
本計測では、高輝度な放射光によりフルサイズ基板内で約 4 µm(3 pixel 程度)のボイド
を視認できた。別の計測では、約 0.33 µm/pixel の画像分解能で計測を行った結果、約 1 µm
の析出粒子を可視化できた。
Figure 2 Perspective view of reconstructed 3D
image of chip resistor, solder and wiring with
through-hole in commercial circuit board.
Figure 3 Virtual cross-section of reconstructed
3D image in solder under chip resistor at white
dotted section lines in Fig. 2.
22
豊田ビームライン研究発表会プロシーディングス 6, (2015) 21-24
別のチップ抵抗下のはんだ内における再構成像を図 4 に示す。直上のチップ抵抗のエッジ
位置を黒点線で示した。チップ抵抗の接合部にボイドが集中していることがわかる。また、
図 4 は図 3 よりもチップ抵抗下のボイドが密であり形態が異なる。同じ製造履歴を受ける同
一基板上のチップ抵抗においても、はんだ内の残留ボイドには差異が見られることがわかっ
た。はんだの微視組織や基板上の微視的な拘束条件の違いが影響していると推測される。品
質保証において、このようなボイド形態のバラつきを実測で把握することは重要である。
Figure 4 Virtual cross-section in solder under different chip resistor.
図 4 に示したはんだ断面において、ボイドのサイズやボイド間距離を算出した。結果をチ
ップ抵抗の直下の部分(図 4 の黒点線内)と、それ以外のフィレット部分に分けて図 5 に示
す。平均ボイド粒径はそれぞれ 13 µm および 40 µm であり、チップ抵抗下でははんだ厚さが
小さいためボイドサイズが抑制されていると考えられる。一方、ボイド間の平均距離はそれ
ぞれ 22 µm および 134 µm であり、チップ下の方がボイドが近接している。ボイド密度を算
チップ下はフィレット部の 36 倍となる。
出すると、
それぞれ 1,800 および 50 個/mm2 であり、
使用時に熱応力が発生すると、チップ下では近接するボイドによりひずみ集中場が重畳する
可能性があり、単独ボイドよりも損傷が大きくなる可能性が考えられる。
(a) Void diameter and distance between voids under
chip resistor and in the rest of solder fillet.
(b) Void density under chip resistor
and in the rest of solder fillet.
Figure 5 Distribution of size, distance and density of voids in solder in Fig. 4.
23
豊田ビームライン研究発表会プロシーディングス 6, (2015) 21-24
放射光ラミノグラフィにより、フルサイズの電子基板のまま非破壊ではんだ内部のミクロ
なボイドを可視化できた。ボイドの実形状と実配置がわかれば、使用時にはんだ内に発生す
る負荷の算出に有用である。また、試料は切断せず稼動可能な状態のまま計測できるため、
熱疲労過程で逐次非破壊計測を行うことにより、内部で発生する熱疲労損傷を追跡すること
ができる。これらの実測結果は、高精度な熱疲労寿命の予測や、信頼性の高い部品の開発に
役立つと考えられる。
今後の課題
放射光ラミノグラフィの 3 次元再構成像では、一般的な CT 法と同様な同心円状アーティ
ファクトに加え、放射光の入射方向に筋状のアーティファクトが発生する。これらは内部形
態の 3 次元抽出の支障となる場合があるため、その低減と影響度の定量化が今後の課題であ
る。また、鉄鋼が主となる部品では高エネルギーが、樹脂が主となる部品では低エネルギー
が必要となるため、これらの条件で高分解能計測を実現する計測条件の探索も今後の課題で
ある。
謝辞
放射光ラミノグラフィの基礎実験(課題No. 22013B1563)では、(公財)高輝度光科学研究
センターの上杉氏および星野氏にご助言とご協力を頂きました[5]。ここに感謝を申し上げま
す。
参考文献
[1] 鈴木賢治, 菖蒲敬久, 城 鮎美, 豊川秀訓, 保全学, Vol. 11, No. 2, pp. 99-106, (2012).
[2] 瀬戸山大吾, 木村英彦, 広瀬美治, 山口 聡, 第5回豊田ビームライン研究発表会プロシー
ディングス, pp. 3-8, (2014).
[3] M. Hoshino, K. Uesugi, A. Takeuchi, Y. Suzuki, and N. Yagi, The Review of scientific instruments,
Vol.82, No. 7, 073706, (2011).
[4] 星野真人, 上杉健太朗, 竹内晃久, 鈴木芳生, 八木直人, 放射光, Vol.26, No.5, pp. 257-265,
(2013).
[5] 木村英彦, 浅田崇史, 山口 聡, 加納大樹, 星野真人, 上杉健太朗, SPring-8利用研究成果集,
Vol. 3, No. 1, pp. 50-52, (2015).
24
豊田ビームライン研究発表会プロシーディングス 6, (2015) 25-29
2014A7023, 2014B7023
BL33XU
化学蓄熱材料の時分割・その場 X 線回折測定技術の構築
Time-Resolved and In-Situ X-Ray Diffraction Analysis for Thermal Energy
Storage Materials
岸田 佳大 a, 青木 正和 a, 水谷 陽介 a, 野中 敬正 a, 堂前 和彦 a
Yoshihiro Kishidaa, Masakazu Aokia, Yohsuke Mizutania, Takamasa Nonakaa, Kazuhiko Dohmaea
a
a
(株)豊田中央研究所
Toyota Central R&D Labs., Inc.
アンモニア(NH3)ガスの吸放出反応を利用した化学蓄熱材料の多くは、NH3 吸収時の結晶構造
や NH3 吸放出メカニズムが明らかにされていない。その要因として、腐食性を有する NH3 環境下に
おける材料評価が困難なことが挙げられる。そこで本研究では、NH3 ガス圧力及び温度制御下にお
ける時分割 X 線回折(XRD)測定装置を BL33XU に構築した。これにより、室温・大気中では測定
困難であった NH3 吸収状態の結晶構造評価が可能となった。本報告では、塩化カルシウム(CaCl2)
の NH3 放出に伴う構造相転移を観測した結果を報告する。
キーワード: Thermal Energy Storage、NH3、In-situ X-Ray Diffraction、Time-Resolved、Calcium chloride
背景と研究目的
新興国を中心として、エネルギー消費量は世界的に増加傾向である[1]。一方、自動車や工
場等で消費されるエネルギーの一部は熱として排出され、これらは有効利用されていないこ
とから、排熱を有効利用してエネルギー効率を改善することが不可欠である。その1つの方
策として挙げられるのが蓄熱技術である。蓄熱方法としては、顕熱蓄熱、潜熱蓄熱、化学蓄
熱に大別されるが、その中でも化学蓄熱は、蓄熱密度が高いというメリットが挙げられる。
このような蓄熱技術を用いて余剰排熱を蓄え、必要なとき・場所において有効利用すること
が期待されている。
化学蓄熱材料は、水(H2O)を吸放出する酸化カルシウム(CaO) [2]や、NH3 を吸放出する金
属塩化物(CaCl2 等)[3]が挙げられる。これらの化学蓄熱材料は、H2O や NH3 等の吸放出に伴
い結晶構造変化し、大きな体積膨張・収縮を生ずる。さらに NH3 吸放出する材料においては、
NH3 が腐食性を有することにより,評価装置の腐食対策や試料のハンドリングを困難にしてい
る。これらのことから、NH3 吸放出する化学蓄熱材料は、結晶構造解析や反応メカニズムに関
する報告が乏しいのが現状である。
そこで本研究では、NH3 吸放出する化学蓄熱材料の結晶構造評価と、NH3 吸放出メカニズム
の解明を目的とし、NH3 圧力・温度制御下における時分割 XRD 評価装置を構築した。本報告で
は、構築した評価装置の詳細と、塩化カルシウム(CaCl2)の NH3 放出過程の時分割 XRD の結
果を報告する。
実験
実験1 評価装置の概要
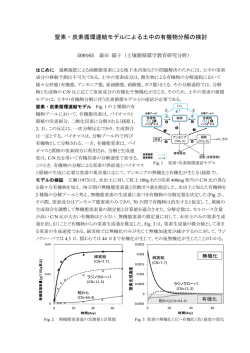
構築した評価装置を Figure 1 に示す。本評価装置は、主に試料温度を制御する電気炉
[Figure 1(b)]
、試料圧力制御部[Figure 1(c)]
、及び使用済みガスの除害装置(BL33XU 既
設装置)により構成されている。電気炉は小型の電気管状炉(幕張理化学硝子製作所製)を
用い、中心部に試料充填した石英管を設置できる構造である。また、電気管状炉の中心を X
25
豊田ビームライン研究発表会プロシーディングス 6, (2015) 25-29
線が透過できるように幅 3mm のスリットを設けた。石英管内に充填した試料の一端を XRD 測
定のために用い、他端を試料温度の測定に用いる構造となっている。
試料圧力制御部は、NH3 貯蔵容器、圧力調整容器を備えており、電磁バルブの開閉操作を実
験ハッチ外から操作可能である。この試料圧力制御部と前述の電気管状炉は、XRD 測定と連
動して制御可能であり、温度や圧力の印加を開始すると同時に時分割 XRD 測定ができるシス
テムとなっている。
Figure 1 Time-resolved and in-situ XRD apparatus. (a) Over view illustration of experiment stage
in the BL33XU. (b) Furnace with a sample cell. (c) Piping drawing of gas pressure controller and the
sample tube.
実験2 CaCl2 の NH3 放出過程の時分割 XRD 評価
CaCl2 の NH3 吸収状態は反応式(1)~(4)中に示した化学式[Ca(NH3)nCl2 (n = 8, 4, 2, 1, 0)]
で表される通り、n = 0 を除き 4 つの配位状態を示す[4]。本実験では構築した評価装置を用
い、Ca(NH3)nCl2 の NH3 放出(n = 8 から n = 0 になる)過程における時分割 XRD 測定を実施し
た。
はじめに、石英試料管(外形 1.5875mm×内径 1.0mm)に CaCl2 試薬とカーボンファイバー
の混合粉末を充填した。カーボンファイバーは、CaCl2 の NH3 吸収に伴う体積膨張によって試
料管が破裂するのを抑制するために混合した。なお、CaCl2 は潮解性を有するため、これらの
作業は Ar 置換グローブボックス中でおこなった。試料充填した後、石英試料管を電気管状炉
に設置し、試料を大気曝露することなく試料圧力制御部の配管と接続した。次に、石英試料
管内の Ar を真空排気した後、NH3 を約 510kPa(abs)加圧充填することで NH3 吸収させ、
Ca(NH3)8Cl2 とした。そして、圧力一定のまま室温から 400℃まで 20℃/min.で昇温しながら 1
秒毎の XRD 測定(X 線エネルギー:28keV、検出器:PILATUS300K)を実施した。なお、同時
に試料粉末の温度と試料管内の圧力測定もおこなった。
Ca(NH3)8Cl2
Ca(NH3)4Cl2
Ca(NH3)2Cl2
Ca(NH3)Cl2
⇄
⇄
⇄
⇄
Ca(NH3)4Cl2
Ca(NH3)2Cl2
Ca(NH3)Cl2
CaCl2
+
+
+
+
4NH3
2NH3
1NH3
1NH3
26
・・・
(1)
・・・
(2)
・・・
(3)
・・・
(4)
豊田ビームライン研究発表会プロシーディングス 6, (2015) 25-29
結果および考察
室温にて NH3 を 510kPa(abs)加圧することで Ca(NH3)8Cl2 を作製した後、圧力一定のまま 20℃
/min.で昇温した際の、試料温度と電気炉温度の差分ΔT、試料管内圧力を、それぞれ電気炉
温度に対してプロットした図を Figure 2 に示す。Figure 2(a)より、4 段階の吸熱反応が生
じていることが確認できた。これらは、式(1)~(4)に対応する吸熱反応である。また、
Figure 2(b)より、
吸熱反応する温度域において 10kPa 程度の圧力上昇が確認された。
これは、
[4]
試料からの NH3 放出に伴い配管内の圧力が上昇したためである。以上より、既報 のとおり 4
段階の吸熱反応を再現できていることが確認された。
Figure 2 (a) Difference of temperature of furnace and sample. (b) The NH3 gas pressure in the
sample tube. Each plot indicates observed value, and the solid red line indicates the moving average
line.
次に、室温から 400℃まで昇温した際に、結晶相転移が観測された温度域の時分割 XRD パ
ターンを Figure 3 に示す。Ca(NH3)nCl2 (n = 8, 4, 2, 1, 0)において、n = 8[5], 2[4], 0[6]
は既知構造である。時分割 XRD パターンのうち、n = 8, 2, 0 に相当する室温、122℃、342℃
におけるリートベルト解析をおこなったところ、いずれも既報の構造モデル[4-6]によく一致す
ることを確認した(Figure 4)
。Figure 3 (a)に示した通り、Ca(NH3)8Cl2 と Ca(NH3)2Cl2 の中
間相として Ca(NH3)4Cl2 と推定される XRD パターンが観測された。また、Figure 3 (b)におい
ても同様に、Ca(NH3)2Cl2 と CaCl2 の中間相である Ca(NH3)Cl2 と推定される XRD パターンを観
測できた。各相の境界においては、2 相共存領域が見られ、この領域における各相の回折線
角度について、昇温に伴う顕著な変化は観測されなかった。これは各相の間に非化学量論組
成の結晶相[Ca(NH3)nCl2 (n ≠ 整数)]が存在しないことを示唆しており、既報[4]を支持す
る結果である。
まとめと今後の課題
今回の評価装置構築により、これまで観測されていなかった Ca(NH3)nCl2 (n = 4, 1)と推
定される XRD パターンを観測することができた。しかしながら、本評価装置は広角度範囲の
測定がおこなえないため、詳細な構造解明は今後の課題である。これらの構造を解明し、今
回取得した時間分解データと合わせて解析することで、NH3 放出メカニズムの解明につなげる
予定である。
27
豊田ビームライン研究発表会プロシーディングス 6, (2015) 25-29
Figure 3 Time-resolved XRD patterns. (a) The temperature ranges from 60 to 88℃, it indicates the
phase change from Ca(NH3)8Cl2 to Ca(NH3)2Cl2 via Ca(NH3)4Cl2. The XRD patterns show every
1sec. (b) The temperature ranges from 221 to 280℃, it indicates the phase change from Ca(NH3)2Cl2
to CaCl2 via Ca(NH3)Cl2. The XRD patterns show every 2sec.
Figure 4 Rietveld refinement of (a) Ca(NH3)8Cl2 in room temperature, (b) Ca(NH3)2Cl2 in 122℃
and (c) CaCl2 in 342℃. The excluded region around 7.5 deg. are diffraction of the carbon fiber and
other excluded region in (b) are small impurity peaks of Ca(NH3)Cl2.
28
豊田ビームライン研究発表会プロシーディングス 6, (2015) 25-29
参考文献
[1] 資源エネルギー庁,平成 24 年度エネルギーに関する年次報告(エネルギー白書 2013),
145 (2013).
[2] 藤井,空気調和・衛生工学会論文集 4, 21-27 (1977).
[3] W. E. Wentworth, C. F. Batten, J.A. Ayala, and R. Alcala, The Journal of Physical
Chemistry, 86 3483-3489 (1982).
[4] S. Westman, P. Werner, T. Schuler and W. Raldow, Acta Chemica Scandinavica A35,
467-472 (1981).
[5] 岸田,青木,化学工学会第 80 回年会講演要旨,講演番号 L316 (2015).
[6] A. K. van Bever and W. Nieuwenkamp, Zeitschrift für Kristallographie - Crystalline
Materials, 90, 374–376 (1935).
29
豊田ビームライン研究発表会プロシーディングス 6, (2015) 30-34
2014A5073, 2014B7025
BL16XU, BL33XU
マイクロビームによる固体酸化物形燃料電池電極の結晶構造解析
Analysis of Electrode for Solid Oxide Fuel Cells byμ-beam XRD
藤田 悟, 野崎 洋, 松尾秀仁, 山口 聡, 林 雄二郎, 天野 久美, 加藤 雄一
Satoru Fujita, Syuji Matsuo, Hiroshi Nozaki, Satoshi Yamaguchi, Yujiro Hayashi,
Kumi Amano, Yuicji Kato
株式会社豊田中央研究所
Toyota Central R&D Labs., Inc.
X 線マイクロビーム回折法によって市販 SOFC コインセルの空気極断面の結晶構造を調べた。耐
久前後における空気極材の格子定数および格子体積にはセル断面方向に違いがあることが分かり、
位置依存性があることが示唆された。
キーワード: 固体酸化物形燃料電池、空気極、μビーム XRD
背景と研究目的
SOFC(Solid Oxide Fuel Cells: 固体酸化物形燃料電池)は分散型電源として高効率な発
電方法として注目されている。SOFC は 700℃以上の温度で空気極から取り込んだ酸素を、酸
素イオンとして電解質を通過し、燃料極で水素および一酸化炭素と反応させることで発電す
る。SOFC は高温で動作させるため発電効率が高い反面、セル内で元素拡散による材料の劣化
(化学安定性)が問題となる。その際、セルの各部における結晶構造変化が一つの指標とな
るが、SOFC セルにおける電極(特に空気極)および電解質層は最大数十μm の厚さしかない
ため、セルの深さ方向(セル断面)の結晶構造変化を調べることは困難であった。本研究で
は、空気極の劣化機構を明確化するために、μm 間隔で測定可能なマイクロビームを用い、
空気極材の深さ方向における結晶構造変化を調べることにした。
実験
試料
市販燃料極支持型 SOFC コインセル(発電初期および耐久後*)を厚み方向にセルを切断
(Fig.1 中の点線)し、さらに断面を鏡面研磨し観察面とした(Fig.2)。Fig.2 は耐久後の
セル断面(SEM 像)を示す。またセル構成は次の通りである。
[燃料極層]:Ni+Y ドープ ZrO2(YSZ)、[電解質層]:YSZ、[反応防止層]:(Gd,Ce)O2
(GDC)、[空気極層]:(La,Sr)CoO3(LSC)、[集電層]:Pt。
*
発電評価条件 作動温度:700℃, 電流密度:0.5A/cm2, 劣化
率:4%(初期電位比較)
Fig. 1 Photograph of coin-type
SOFC
30
豊田ビームライン研究発表会プロシーディングス 6, (2015) 30-34
Fig. 2 SEM image of a polished cross section of the coin-type SOFC
マイクロビーム X 線回折測定
マイクロビーム X 線回折測定は、SPring-8 における BL16XU と BL33XU で実施した。入射
エネルギー11keV(波長:1.126Å)の X 線を入射角が 5mrad の前置ミラーで高次光を除去し
た後、0.2mm×0.2mm のスリットでビームを絞った。さらに,K-B ミラーで縦方向を 0.5μm
(BL16XU)又は 2μm(BL33XU)になるように X 線をシート状に集光し、入射角 10°で SOFC
コインセルの断面に照射し、X 線をフラットパネル検出器(FPD)で X 線回折(XRD)パター
ンを測定した。測定した各深さにおける XRD パターンを一次元化し、結晶構造解析ソフト
(Rietan-FP)で空気極層の格子定数を求めた。
組成分析測定
誘導結合プラズマ(ICP)発光分析(Rigaku:CIRIOS 120EOP )により、La、Sr、Coの元素分
析を行い空気極の組成分析を行った。さらに、セル断面の化学組成分析については、電子線
マイクロアナライザ(EPMA)(日本電子:JXA-8500F, JXA-8200)で実施した。
ラマン分光測定
ラマン分光測定(日本分光:NRS-3300)により、セル断面方向における空気極の相同定を
実施した。
結果
マイクロビーム X 線回折測定
Fig. 3 は発電耐久前後の SOFC セル断面方向の XRD パターンを示す。各層に対応して、燃
料極側から [燃料極層]:Ni+Y ドープ ZrO2(YSZ)、[電解質層]:YSZ、[反応防止層]:
31
豊田ビームライン研究発表会プロシーディングス 6, (2015) 30-34
(Gd,Ce)O2(GDC)、[空気極層]:(La,Sr)CoO3(LSC)、[集電層]:Pt の XRD パターンが検出
された。
Fig. 3 Diffraction patterns of cross section of SOFCs, before (a) and after (b) duration tests.
次に、耐久前後における空気極層(LSC)の XRD パターンをフィッティングして求めた格
子定数(a, c 軸)および格子体積(V)の位置依存性を図4に示す。両試料共に Pt 集電側から反
応防止層に向けて、LSC 相の格子体
積が小さくなっており、とくに Pt
集電体および反応防止層の界面付
近ではその変化が大きいことが分
かった。さらに、耐久後は、発電
前と比較して、格子定数および格
子体積が大きいことが分かった。
さらに、耐久後は、発電前と比較
して、格子定数および格子体積が
大きいことが分かった。
組成分析測定
Fig. 5 および Fig. 6 は、それ
ぞれ EPMA による空気極層内の元素
マッピング(La, Sr, Co)結果およ
び Sr/(La+Sr)比結果を示す。耐久
前については、Co の偏析は無く、
Sr/(La+Sr)比はほぼ一定(0.42)
であった(ICP 結果:Sr/(La+Sr)
=0.42 であり、EPMA 結果と一致す
る)。それに対し、耐久後の
Fig. 4 Lattice constants and volume of LSC before and after
duration tests
32
豊田ビームライン研究発表会プロシーディングス 6, (2015) 30-34
Sr/(La+Sr)比は耐久前のそれと比較して小さい。また、Pt 集電層側および反応防止層界面付
近では増加し、特に、反応防止層付近では、Sr/(La+Sr)比は著しく増加した(0.4→0.55)。
さらに、Co の偏析が確認(Fig. 5 (b))され、Co3O4 が析出したものと考えられる(Fig. 7:
ラマン分光結果)。しかし、XRD パターンからは Co3O4 相は確認できなかった。これは粒径が
小さい(<100nm)、絶対量が少ない(<1%)、または非晶質になっている可能性がある。
Fig. 5 Mappings of Co, Sr and La by EPMA measurement
Fig. 6 The ratio of Sr/(La+Sr) in a cathode before and after duration tests
33
豊田ビームライン研究発表会プロシーディングス 6, (2015) 30-34
Fig. 7 Raman spectra of cathode before and after duration tests
以上より、耐久試験前後における、空気極相の構造変化を以下のように推測する。
① Van Doorn らによると、La1-xSrxCoO3-の格子体積(V)は x=0-0.3 の間では増加し、0.3-0.7
では減少する[1]。このことから考察すると、本研究で測定した LSC の耐久前後で格子体
積(V)が減少している理由として、Sr/(La+Sr)比が減少したものと考えられる(EPMA 結
果と一致)。
② ただし、耐久後の反応防止層付近の格子体積(V)変化と Sr/(La+Sr)比の著しい変化との
紐付については、説明ができない。
③ 耐久試験前後とも反応防止層付近の格子体積(V)減少が生じる理由として、試料作製時
に生じた界面付近の歪みによる影響が考えられる。
④ Pt 集電層付近での格子体積(V)増加については、酸素欠損(δ)が生じると、試料全体
の価数を補償するために、Co の価数が小さくなり、イオン半径が大きくなると考えられ
る。そのため試料全体では、格子体積(V)が増大すると予測される。
今後の課題
1. マイクロビームによる空気極の結晶構造変化を確認することができた。
2. 格子体積変化が生じる要因を明らかにするために TEM や XAFS 等で微小領域の組成変化
を確認し、空気極劣化要因を明確化する。
参考文献
[1] R. H. E. van Doorn and A. J. Burggraaf, Solid State Ionics, 128 65-78 (2000).
34
豊田ビームライン研究発表会プロシーディングス 6, (2015) 35-39
2014B7028
BL33XU
球状カーボン/SnO2 複合体中の Sn の XAFS 解析
XAFS Analysis for Tin in SnO2 / Monodispersed Starburst Carbon Spheres
composites
龍田 成人, 矢野 一久, 加藤 晃彦, 西村 友作, 野中 敬正
Narihito Tatsuda, Kazuhisa Yano, Akihiko Kato, Yusaku Nishimura, Takamasa Nonaka
(株)豊田中央研究所
TOYOTA Central R&D Labs., Inc.
充放電に伴う球状カーボン/SnO2 複合体中の Sn の状態変化を XAFS により解析した。SnO2 の
量が Li 挿入により減少し、Li 脱離によって再び増加したことから、この複合体では、通常の SnO2
では不可逆反応であるコンバージョン反応(SnO2 + 4Li+ + 4e- ⇔ Sn + 2Li2O)が可逆的に起こる
ことがわかった。これが球状カーボン/SnO2 複合体の容量増大をもたらした原因と考えられる。
キーワード: XAFS、Sn、Mesoporous Carbon、Li ion battery
背景と研究目的
SnO2 は理論容量 1494 mAh/g と高く、Li イオン電池の負極材料として注目されているが、
SnO2 が還元して生成する Sn が充放電時に最大で 400%程度の大きな体積変化を伴うため、
微粉化を生じやすく、サイクル特性が低いことが課題である。
これまで、我々は構造を精密に制御したメソ多孔体の研究に取り組んできており,細孔が
ヘキサゴナルの対称性をもちながら放射状に成長した単分散球状メソポーラスシリカ
(Monodispered Mesoporous Silica Spheres: MMSS)の合成に成功している[1,2]。また、MMSS
を鋳型にして細孔内に炭素源を導入して転写することで、球状カーボン多孔体(Monodispered
Starburst Carbon Spheres: MSCS)を合成できることも報告している[3,4]。
現在、この MSCS の細孔内に SnO2 や Si のナノ結晶を析出させて複合化することで、これ
らの材料の課題である充放電時の微粉化に伴う容量劣化を軽減する取り組みを行っている。
これまでに、この手法で複合体を作製すると、Sn 系材料のサイクル特性を大幅に改善できる
ことを報告している[5]。
一般に、SnO2 を Li+を含む電解液で充放電を行うと、式(1)と(2)で示されるコンバージョン
反応と、式(3)で示される Li と Sn との合金化反応が起こると言われており、これらの反応の
理論容量は 合計で 1494 mAh/g である。
(1)
SnO2 + 2Li+ + 2e- → SnO + Li2O
+
(2)
SnO + 2Li + 2e → Sn + Li2O
+
(3)
Sn + 4.4 Li + 4.4 e → Li4.4Sn
しかし、式(1)と(2)で示されるコンバージョン反応は不可逆反応であると言われており、
SnO2 の可逆容量は式(3)の合金化反応による寄与のみで 782 mAh/g と報告されている[6]。しか
しながら、MSCS/SnO2 では電気容量が 1000 mAh/g 以上を示し、コンバージョン反応も可逆
的に反応しているものと推察された。
当初、X 線回折を用いて、Sn の状態変化を解析しようと試みたが、電気化学反応を起こす
前には観察された 2~3 nm 程度の SnO2 に帰属されるブロードな回折線が、充放電過程で消失
し、Sn の状態変化を把握することができなかった。そこで、XAFS 解析を用いて、充放電に
伴う球状カーボン/SnO2 複合体(以下、MSCS/SnO2)中の Sn の状態変化を評価した。
35
豊田ビームライン研究発表会プロシーディングス 6, (2015) 35-39
実験
1)MMSS の合成
界面活性剤 n-Hexadecyltrimethylammonium Choloride(C16TMACl)を鋳型として、以下の
手順で MMSS を合成した。
精製水 809.2 g、
メタノール(MeOH)754 g の混合溶媒に C16TMACl
7.04 g を溶解し、25℃に保ち撹拌した。次に、1M NaOH 6.84 g、MeOH 30 g で希釈した TEOS
6.86 g と APTES 0.38 g を加えた。さらに、約 8 時間撹拌,一晩静置し、ろ過と精製水への再
分散とを 2 回繰り返した後、45℃で乾燥して、未焼成の MMSS 3.5 g を得た。
2)MMSS の細孔径拡大
未焼成の MMSS 2.0 g を、H2O 66 g、EtOH 42.7 g、TMB 10 g からなる混合溶媒中に分散さ
せた後、この分散溶液を、容量 200 mL のオートクレーブにいれ、100℃で 3 日間水熱処理し
た。水熱処理後に、オートクレーブを冷却して生成物を取り出した。得られた生成物のろ過
と EtOH への再分散を 2 度繰り返し洗浄した後 45℃で 12 時間以上乾燥した後、大気中 550℃
で 6 時間焼成し、細孔を拡大した MMSS (exMMSS)を得た。
3)MSCS の合成
exMMSS をテンプレートとして、フルフリルアルコール(FA)を炭素源に用いた液相浸透
法により、球状カーボン多孔体(MSCS)を合成した。すなわち、exMMSS 2.0 g を入れたテ
フロン製容器(容量 200 mL)に細孔容量と同量の FA を注ぎ、容器を密閉して、良く振動さ
せ、細孔内に FA が浸透するようにした。この容器を熱風乾燥機に入れ、150℃、24 時間加温
して、FA の重合を進めた。得られた粒子を、窒素雰囲気下で 500℃、6 時間熱処理して、FA
の炭化を進めた。次に、熱処理後の粒子の細孔容量を窒素吸着法により求めた。得られた粒
子の細孔容量に相当する FA を加え、上記の方法と同様にして、細孔内への FA の浸透、FA
の重合、500℃での炭化を行った後、さらに、窒素雰囲気下で 900℃、6 時間、熱処理して、
球状カーボン/シリカ複合体を得た。この複合体を HF 水溶液に分散し、SiO2 を溶解し、MSCS
を得た。MSCS の細孔容量を窒素吸着法により求めたところ、1.132 mL/g であった。
4)MSCS への SnO2 の導入
MSCS のナノ細孔内に SnO2 の微結晶を析出させることで、球状カーボン/SnO2 複合体
(MSCS/SnO2)を合成した。すなわち、MSCS 0.1 g を 500 mL のビーカー内で精製水 250 g およ
び濃塩酸(35wt.%) 4 mL、SnCl2 5.0 g の混合溶液に分散させ、25℃に保ちながら、4 時間撹拌
した。その後、分散液の濾過と精製水への再分散とを 2 回繰り返した後、45℃で乾燥し、
MSCS/SnO2 を得た。さらに、MSCS/SnO2 を N2 雰囲気中で 350℃、6 時間熱処理した。なお、
MSCS/SnO2 中の SnO2 の占める割合は、熱重量分析により、68 wt.%と同定された。これは、
MSCS 1 g に対して SnO2 2.12 g が析出したことを示しており、SnO2 の密度を 6.95 g/mL とす
ると、その真の体積は、MSCS 1 g あたり、0.306 mL/g(carbon)である。これは、MSCS の細孔
容量 1.13 mL/g の 27%にあたる。充放電に伴い、式(1)(2)により、MSCS 1 g 中の SnO2 2.12
g から Sn 1.67 g と Li2O 0.45 g が生成する。これらの体積は、それぞれの密度を 7.365 g/mL、
2.01 g/mL とすると、0.227 mL、0.224 mL となる。Sn が 400%体積膨張した場合の体積は、0.227
mL×4+0.224 mL = 1.132 mL であり、MSCS の細孔容量(1.132 mL/g)に等しい。すなわち、Sn
が 400%まで体積膨張しても吸収できる程度の空隙が残っているものと考えられる。
5)XAFS 用試料の作製
前述の方法で得られた MSCS/SnO2 から、以下の方法を用いて電極を作製した。すなわち、
MSCS/SnO2 0.475 g、ケッチェンブラック 0.025 g、ポリフッ化ビニリデン(PVDF) 0.1 g、N-メ
36
豊田ビームライン研究発表会プロシーディングス 6, (2015) 35-39
チル-2-ピロリドン(NMP) 1 g を混合した後、Cu 箔上に塗工し、120 ℃で真空乾燥を 8 時間行
った後、ロールプレスで加圧、さらに円形に打ち抜いて、電極を得た。これを作用極として、
対極に金属リチウム、セパレータに多孔質ポリプロピレンフィルム、電解液に 1M LiPF6 の エ
チレンカーボネート(EC)/ジメチルカーボネート(DEC)(1/1(v/v))を用いた半電池を作製し
た。
充放電試験では、以下のような CC-CV モードを用いて、各電位における試料を調整した。
すなわち、SnO2 あたり 200 mA/g の定電流密度で、自然電位から Li の挿入、脱離を行い(CC
モード)、所定の電位(Li の挿入過程では 1.0、0.5、0.02 V、Li の脱離過程では、0.9、1.8、3.0
V)に到達した後に、その電位において 24 時間以上保持した(CV モード)。なお、本報告では、
Li の挿入方向を放電、Li の脱離方向を充電と表記する。また、試料は、保持した電圧に、Li
の挿入方向では D を、Li の脱離方向では C を加えて表記する。例えば、挿入過程で 0.5 V に
保持された試料は、0.5VD と表記する。
これらの半電池をグローボックス(Ar)中で解体し、DEC で洗浄後、Al とポリマーの多
層フィルム中に封入して、XAFS 用試料とした。
6)XAFS を用いた Sn の解析
XAFS 測定は、放射光(SPring-8, BL33XU)を用い、透過法で、Sn K-edge を測定領域とし
た。標準試料として、金属 Sn、SnO、SnO2 についても測定した。得られた XANES スペクト
ルに対して線形結合フィッティング解析を行い、標準試料の各成分の割合を求めた。また、
その割合の加重平均から、平均価数も求めた。
結果および考察
1)充放電曲線
各電位の状態を調べるために、CC-CV モードで MSCS/SnO2 を作用極に用いた半電池の充
放電曲線を Fig.1 に示す。各試料において、電圧を一定に保持するまでの充放電曲線および
電圧変化はほぼ一致しており(Fig.1)、試料間の充放電特性のばらつきは、ほとんどないこ
とがわかった。充放電試験終了時の電流は、CC モードの電流値の 2 %以下まで減少しており、
各電位における定常状態にかなり近づいているものと思われる。
0.9VC の試料では、Li 脱離に 630 mAh/g(CCCV モード)の電荷が使われていた。これは
合金化反応(式(3)
)の理論等量 782 mAh/g の 81%に相当し、大部分の LixSn が Sn まで酸化
されているものと考えられる。1.8VC の試料では、Li 脱離に 1219 mAh/g の電荷が使われてお
り、これは合金化反応(式(3))にコン
バージョン反応の一部(式(2))を加え
た 1138 mAh/g に近い。1.8VC の試料で
は、一部の Sn がコンバージョン反応によ
り、SnO や SnO2 などの酸化物に変化して
いるものと予想される。3.0VC の試料は、
Li 脱離に 1659 mAh/g の電荷が使われてお
り、これは合金化反応(式(3))に全コ
ンバージョン反応(式(1)
、
(2))を加え
た 1493 mAh/g よりも大きい。3.0VC の試
料では、大部分の Sn がコンバージョン反
応により、SnO や SnO2 などの酸化物に変
化しているものと予想される。
Figure 1 Discharge / charge profiles.
37
豊田ビームライン研究発表会プロシーディングス 6, (2015) 35-39
2) XAFS 解析
各電位で保持した試料、及び、標準試料として用いた、金属 Sn、SnO、SnO2 の XANES
スペクトルを Fig.2 に示す。得られた XANES スペクトルに対して線形結合フィッティング解
析を行い、金属 Sn、SnO、SnO2 の割合を求めた結果を Fig.3 に、それに基づいて求めた平均
価数の変化を Fig.4 に示す。
充放電試験を行う前の SnO2 電極の XANES スペクトルは、ほぼ標準試料の SnO2 のものと
一致し、Sn の価数は 4 価であることが確認された。Li 挿入過程では、1.0 V、0.5 V と電位が
下がるにつれて、XANES スペクトルは、低エネルギー側にシフトした。SnO2 の還元が進ん
でいることを反映していると思われる。線形結合フィッティング解析の結果によると、Sn の
状態は、初期の SnO2 から還元され、1.0 V では 39%が、0.5 V では 79%が金属 Sn になってい
ると評価された。0.02 V で保持した試料の XANES スペクトルは、0.5 V よりも高エネルギー
側にピークがあるが、
線形結合フィッティング解析から得られた Sn 量は 92%とさらに多く、
還元がさらに進んでいることが確認できた。
Li 脱離過程においては、0.9 V 以上の電位で、Sn は酸化され、酸化物の割合が大きくなる
ことがわかった。すなわち、0.9 V では、91%が金属 Sn であり、酸化物の割合は 9%(SnO
と評価)に過ぎないが、1.8 V では、Sn が 37%程度まで減少し、SnO および SnO2 の割合が、
それぞれ 38%、25%まで増加する。3.0 V では、さらに酸化が進み、Sn、SnO および SnO2 の
割合は、9%、10%、 81%となり、
平均価数は 3.4 と評価された。これ
から、MSCS/SnO2 では、コンバー
ジョン反応が可逆的に起きている
ことを確認できた。
一方で、Li と Sn の合金化が進ん
でいる 0.9 V 以下の電位領域の評価
については課題が残った。例えば、
0.02 V と 0.9 V の状態を比較すると、
0.9 V の価数の方が低く評価されて
しまう。実際のスペクトルを比較す
ると、電気化学的により還元されて
いるはずの 0.02 V の試料の XANES
スペクトルの方が、0.9 V や金属 Sn
のスペクトルよりも高エネルギー
側で立ち上がっている。これから、
Li と Sn との合金の XENES スペク
トルはより高エネルギー側で立ち
上がると推察される。
今回の評価では、標準試料として、
Sn、SnO、SnO2 を用いてフィッティ
ングをかけており、金属 Sn よりも
高エネルギー側で立ち上がる
XANES スペクトルでは、SnO2 の増
大として評価されるため、合金化領
域の評価での誤差が大きいものと
考えられる。
Figure 2 Sn K-edge XANES spectra of MSCS / SnO2 composites.
(a) Lithiation and (b) Delithiation process.
38
豊田ビームライン研究発表会プロシーディングス 6, (2015) 35-39
Figure 3 Redox status of Sn in MSCS / SnO2
Figure 4 Averaged valence obtained from redox
composites.
status.
まとめ
各電位で保持した試料中の Sn の XANES スペクトルを評価することで、
MSCS/SnO2 では、
コンバージョン反応が可逆的に起きていることをわかった。これが、MSCS/SnO2 が、Sn が
合金化する場合の理論当量よりも高い可逆容量を示す原因である。
今後の課題
Sn と Li との合金の XANES スペクトルも測定し、Sn、SnO、SnO2 に加え、これらの合金
のスペクトルも標準試料に加えてフィッティングを行うことにより、Sn と Li とが合金を形
成する領域の精度を向上させる予定である。
参考文献
[1] K. Yano, and Y. Fukushima, J. Mater. Chem. 13, 2577 (2003).
[2] K. Yano, and Y. Fukushima, J. Mater. Chem. 14, 1579 (2004).
[3] T. Nakamura, Y. Yamada, and K. Yano, Chem. Lett. 35, 1436 (2006).
[4] N. Tatsuda, and K. Yano, Carbon, 51, 27 (2013).
[5] J. Chen, and K. Yano, ACS Appl. Mater. Interfaces, 5, 7682 (2013).
[6] I. A. Courtney, and J. R. Dahn, J. Electrochem. Soc , 144, 2045 (1997).
39
Tribol Lett (2015) 57:6
DOI 10.1007/s11249-014-0443-8
ORIGINAL PAPER
In Situ X-Ray Diffraction Study of Phase Transformation of Steel
in Scuffing Process
Seiji Kajita • Kazuyuki Yagi • Takashi Izumi
Jun Koyamachi • Mamoru Tohyama •
Koji Saito • Joichi Sugimura
•
Received: 11 April 2014 / Accepted: 13 October 2014 / Published online: 10 January 2015
Ó Springer Science+Business Media New York 2014
Abstract We developed a novel in situ observation
method associated with synchrotron radiation X-ray diffraction (XRD) that enables us to simultaneously monitor
structural changes of materials, images at frictional interfaces, friction force and temperature with a time resolution
on the order of tens of milliseconds. The in situ method
was applied to study scuffing process of martensitic steel
under a dry condition. The result shows that during scuffing, martensite to austenite phase transformation occurred
with plastic flow. The generated austenite phase disappeared when the shear test was stopped. The austenite was
present at a surface temperature lower than the nominal
austenitisation temperature. After intermittent occurrences
of the austenitisation with local plastic flow, the scuffing
feature showed a larger amount of austenite, higher friction
and greater plastic flow. The XRD spectra suggest that
some metallurgical properties of the near-surface material
of the steel may change at the scuffing-mode transition.
Keywords In situ observation X-ray diffraction Scuffing Steel Phase transformation Austenite
1 Introduction
Scuffing is a sudden catastrophic process occurring at the
frictional surfaces of machine elements in operation. Several different mechanisms of initiation of scuffing have
been proposed, such as critical contact temperature, thermoelastic instability, roughening of surfaces, metal adhesion and formation/removal of oxide layers [1–5]. A
majority of the proposed models in these studies assume
that scuffing criteria are derived from insufficient lubrication and initiation of solid contact. For example, an
increase in temperature at the frictional interface decreases
the viscosity of the lubricant and softens the surfaces.
These effects enhance the frequency of direct solid contact
with adhesion, leading to roughening of the surfaces; these
mechanisms definitely provoke scuffing because of an
increase in the severity of friction. However, adhesion at a
real contact area cannot be always claimed to result in
scuffing. Experiments have shown that friction tests can be
conducted without scuffing under not only the conditions of
lubricant starvation but also under dry conditions [4].
Characteristic changes in the near-surface material are
likely to be key elementary processes for the initiation of
scuffing because material near the solid surface resists
attacks of the counter asperities when coming into direct
contacts with solid asperities. Indeed, subsurface cracks
due to plastic deformation [6, 7] and a metallurgically
altered layer called the white layer on the surface [8, 9]
S. Kajita (&) T. Izumi M. Tohyama
Toyota Central R&D Labs., Inc., 41-1, Yokomichi, Nagakute,
Aichi 480-1192, Japan
e-mail: [email protected]
K. Yagi J. Sugimura
Department of Mechanical Engineering, Faculty of Engineering,
International Institute for Carbon-Neutral Energy Research
(I2CNER) Kyushu University, 744 Motooka, Nishi-ku,
Fukuoka 819-0395, Japan
e-mail: [email protected]
J. Koyamachi
Department of Hydrogen Energy Systems, Graduate School
of Engineering, Kyushu University, 744 Motooka, Nishi-ku,
Fukuoka 819-0395, Japan
K. Saito
Toyota Motor Corporation, 1 Toyota-cho, Toyota,
Aichi 471-8571, Japan
Reprinted from Tribology Letters vol. 57, pp.361-368, (http://
dx.doi.org/10.1007/s11249-014-0443-8), © 2015
123
40
6
Page 2 of 11
Tribol Lett (2015) 57:6
accompanies a phase transformation of the steel in the
scuffing process.
have been observed on the surfaces of scuffed parts. Ajayi
et al. [10–12] and Hershberger et al. [9] have proposed a
scuffing criterion based on adiabatic shear instability,
which is a critical point at which the thermal softening
exceeds work hardening due to plastic deformation in the
near-surface material at the sliding contact interface. In this
study, we focus on changes in the near-surface material to
clarify scuffing process.
The main difficulty in clarifying scuffing may stem from
the fact that only a few in situ methods allow the direct
observation of the frictional interface, primarily, because
any observation path towards the interface is blocked by
the sliding materials themselves. Enthoven and Spikes [13]
used an infrared microscope and a video camera to observe
the temperature and capture visible images of a scuffed
surface on a rotating steel ball rubbed with a sapphire disc.
They observed that scuffing is triggered by the accumulation of wear debris at the inlet of the contact area, which
causes starvation of the lubricant, rather than being triggered by a critical maximum temperature. Recently, Yagi
et al. [14] and Li et al. 15] used a colour digital chargecoupled device (CCD) camera to record high-resolution
images and the friction force of the contact area between a
rotating sapphire disc and a stationary steel ball during
scuffing. They observed sudden expansions of the contact
surface due to plastic deformation and studied the precise
behaviour of the wear debris during scuffing. Chandrasekaran et al. [16–18] used an X-ray imaging technique in
a friction test apparatus for in situ observations of the
transfer and bonding behaviours at the frictional interface
between a steel specimen and an Al disc. The ability to
observe the wear process at the microscale and nanoscale
in situ has advanced remarkably [19–23]; however, a link
is missing with respect to bridging the scale gap between
the phenomena on such a small scale and that on the
practical scale of the sliding machine elements. As illustrated above, some challenges remain with respect to
accessing the frictional interface directly; in situ methods
are still scarce and limited at the present.
This paper describes an in situ observation method to
access the frictional interface by combining in situ X-ray
diffraction (XRD) with Yagi’s [14] friction testing apparatus; this combination allows structural change of the
contacting material, friction data and images of the contacting surface to be obtained simultaneously. In this
apparatus, a rotating sapphire ring makes frictional contact
with a stationary steel pin. An X-ray beam directly illuminates the contact area of the pin passing through the
sapphire ring. A synchrotron was used as the X-ray beam
source to perform XRD measurements with a time resolution on the order of tens of milliseconds. Having applied
the method to tempered SUJ2 steel, which is equivalent to
AISI 52100, we report that plastic deformation
2 Methods
2.1 Apparatus
A pin-on-ring-type friction apparatus, shown in Fig. 1a,
was used in the experiments. The pin specimen was cut
from the centre of a 25.4-mm-diameter ball of SUJ2 steel.
The diameter of the pin was 4 mm. As the counter sliding
ring, we used a specially shaped sapphire ring integrated
with a sapphire disc (details of the ring are provided in the
next subsection). The disc portion was embedded in the
holder and rotated by an AC servo motor. Sliding contact
was made between the tip of the steel pin and the ring of
the rotating sapphire disc. Notably, the curvature radius of
the tip of the pin was the same as that of the original steel
ball. The contact begins as a point and then changes to
surface contact as wear progresses; the curvature is needed
to prevent unstable partial contact.
AC servo motor
(a)
pulley
microscope
timing belt
pulley
load cell for load
sappire ring
air cylinder
linear guide
load cell for friction
SUJ2 steel pin
microscope
(b)
2D detector
sappire ring
X-ray
-ray
dX
acte
diffr
2θ
9 deg.
thermocouples
SUJ2 steel pin
Fig. 1 Schematic images of a test apparatus and b shear rig
123
41
Tribol Lett (2015) 57:6
Page 3 of 11 6
Load was applied on the sapphire ring via an air cylinder. Frictional force was transmitted through the apparatus arm and measured by a load cell. A microscope was
set above the sapphire ring to acquire images of the contact
area. The images were recorded by a colour digital CCD
camera at 30 frames per second. The digital camera had
two CCD arrays for visible light and near-infrared light
(temperature analysis using the near-infrared light will be
presented elsewhere). A xenon flashing light was used as
the light source for the microscope, which was operated
simultaneously with the camera. The half bandwidth of the
flashing time was approximately 2.5 ls.
To detect the temperature of the steel pin, thermocouples were embedded into the centre of the pin at distances
of 1, 2, 4 and 205 mm from the surface of the pin.
intensity due to absorption by the sapphire can be suppressed. To avoid a strong XRD spot on the detector from
the sapphire, we carefully examined the occurrence of
XRD spots from the rotating sapphires by changing surface
orientations. Consequently, a (0001) sapphire was selected
as the friction surface because it did not exhibit any XRD
spots at an incident angle of 9°.
2.2.3 XRD Analysis
As will be discussed later, the XRD spectrum shows bcc
and fcc peaks, which are attributable to the martensite
structure of the SUJ2 parent material and the austenite
structure, respectively. We focused on three variables: the
area, width and shift of the XRD peaks. To determine the
amount of austenite, we fit the corresponding XRD peak
with a Gaussian function and estimated the areas of the
martensite peak of bcc(110) (SM ) and the austenite peak of
fcc(111) (SA ). The index SA =ðSA þ SM Þ indicates the ratio
of the austenite. This index is only a rough estimation
because the correct ratio should be derived by accounting
for the diffraction intensities in the structures. The second
variable used was the Gaussian width of the martensite
peak during the test ðwM ðtÞÞ divided by the width of the
peak at the unworn state before the test, denoted by
WM ¼ wM ðtÞ=wM ðt ¼ 0Þ. The index WM reflects the time
variation of crystalline properties such as the structural
perfection of the martensitic steel [24]. The third variable
is the XRD peak shift, which is used to estimate the surface
temperature of the specimen. The incident X-ray is diffracted with a diffraction angle 2h when the Bragg equation, sin 2h ¼ nk=2d, is satisfied in a given condition of the
wavelength of the X-ray k, the lattice distance d and an
arbitrary integer n. When the original lattice distance d0 is
altered to be d and the corresponding diffraction angle
shifts from 2h0 to 2h, a relation can be derived through the
Bragg equation as
2.2 XRD Measurement
2.2.1 Set-up
The XRD experiments were conducted at the Toyota
beamline BL33XU of the synchrotron facility SPring-8.
Figure 1b is an enlarged image of the test rig. The test rig
was tilted against an incident X-ray beam direction to
irradiate the tip of the steel pin. The angle of the incident
X-ray beam against the pin was 9°. The energy of the
incident X-ray was adjusted to 30 keV by a Si 111 doublecrystal monochromator. The beam was focused in the
vertical direction by a Rh-coated mirror and a slit to make
it 60 lm in height and 1 mm in width at the sample
position. The footprint on the irradiated surface of the pin
was approximately 0:4 1 mm2 against the incident angle
of 9°. Debye–Scherrer rings were captured using a twodimensional detector (PILATUS 300 K, DECTRIS) with a
time resolution of 1/30 s, which is same as that of the CCD
camera used in the experiments. To reduce the harmful
effects of the intermodule gap of PILATUS 300 K, we
positioned the detector such that the gap was longer in the
vertical direction. The captured Debye–Scherrer rings were
numerically integrated along a circular path with the centre
on the diffraction ring to convert the two-dimensional data
into an XRD line spectrum.
d=d0 ¼ sin 2h0 = sin 2h:
ð1Þ
The heating of a specimen by friction energy leads to
thermal expansion of the material. The definition of the line
expansion coefficient of a material a is
aðT T0 Þ ¼ d=d0 1;
2.2.2 Sapphire Ring
ð2Þ
where T and T0 are the temperature at a particular point in
time and the initial temperature, respectively. Substituting
Eq. 1 into Eq. 2, we derive
Sapphire is one of the most suitable materials for our
purpose because of its good transmissibility of X-ray and
visible light. Figure 2 shows the shape of the sapphire ring.
The sapphire ring, combined with the disc part, was manufactured from bulk sapphire by grinding. Because the
incident X-ray is able to pass through the hollow centre
region to arrive at the tip of the pin, a decrease in the X-ray
aðT T0 Þ ¼ sin 2h0 = sin 2h 1:
ð3Þ
We then modify Eq. 3 to include the dependence of a on
temperature. For representing the temperature dependence,
a linear approximation of the form a ¼ aT þ b was applied
123
42
6
Page 4 of 11
Tribol Lett (2015) 57:6
Fig. 2 Schematic images of
sapphire ring
15mm
5mm
φ 50mm
4mm
Linear expansion coefficient [10-6/ C]
φ 40mm
intensity of the incident X-ray I0 , and the coefficient of
diffraction intensity c, we can derive the diffraction
intensity from the material existing over the depth z from
Rz
the surface as IðzÞ ¼ cI0 0 expðlLÞdz; and thus, the ratio
of the diffraction intensity to the total intensity is
16
15
14
13
IðzÞ=Iðz ¼ 1Þ ¼ 1 elz½1= sin hi þ1= sinð2hhi Þ :
12
In the present experiments, hi ¼ 9 ; 2h of martensite and
austenite are approximately 11.5°, and the value of l of
iron is 5:996 mm1 for an incident X-ray energy of 30 keV.
With these parameters, we can state that the XRD spectrum
primarily originated from the steel material in a depth of
7 lm, which contributes 70 % of the total diffraction
intensity.
11
0
100
200
300
400
500
600
700
800
Temperature [ C]
Fig. 3 Temperature dependence on the linear expansion coefficient.
Plots are experimental data of SUJ2 steel; the solid line indicates the
results of linear fitting
ð5Þ
2.3 Test Conditions
to a. The actual data of the temperature dependence of a for
SUJ2 steel (the data used were that of AISI 52100, which is
equivalent to SUJ2 [25]) were fitted to estimate the constants a ¼ 0:0038 106 = C2 and b ¼ 12:1 106 = C.
Figure 3 shows the result of the fitting. Inserting the linear
fitted form into Eq. 3, we obtain
The experiments were performed under a dry condition.
The initial temperature T0 of the steel pin was set to 50 °C
using a heater embedded in the pin holder. The sliding
speed of the sapphire ring was set to 2.38 m/s, and the
rotating ring was subsequently dropped onto the steel pin
with a normal load. The normal load was progressively
increased from zero to 270 N and was then maintained at
270 N. When the experiment was finished, the rotation of
the sapphire ring was stopped, while the load was
maintained.
aT 2 þ Tðb aT0 Þ ðbT0 þ sin 2h0 = sin 2h 1Þ ¼ 0:
ð4Þ
This equation was adopted to estimate the surface temperature T in this study.
2.2.4 Analytic Depth
3 Results
The analytic depth, which indicates how much of the depth
of the steel material from the surface represented in the
XRD spectrum, can be derived as follows [24]. When an
X-ray beam with an incident angle hi is irradiated on the
steel surface and is diffracted by the material at a position
z, at a depth from the steel surface, with a diffraction angle
2h, the total length of the transmission path of the X-ray in
the steel is given as L ¼ z½1= sin hi þ 1= sinð2h hi Þ.
Using the X-ray absorption coefficient of the steel l, the
Figure 4 shows an overview of the friction coefficient and
applied load as a function of test time. The contact started
at 0 s which we take as the origin of the test time. During
the initial stage of the test, some friction peaks appeared
and the friction coefficient settled at approximately 0.2. At
50–90 s, the friction peaks reappeared several times. After
90 s, the friction coefficient increased monotonically to
approximately 0.4, and we stopped the sliding at 145 s.
Characteristic friction peaks emerged prior to the
123
43
Page 5 of 11 6
Friction coefficient
300
0.4
200
0.2
100
0.1
0
0
20
40
60
80
100
120
140
0.3
300
(a)
0.2
200
0.1
100
0
0
1
0
SA/(SM+SA)
0.3
Applied Load [N]
Friction coefficient
0.5
Applied Load [N]
Tribol Lett (2015) 57:6
Test time [s]
Fig. 4 Friction coefficient and applied load variations as a function of
time
(b)
0.8
0.6
0.4
0.2
0
1
significant increase in friction coefficient after 90 s. We
divide the total time into the initial period (0–3.8 s) and the
later period (48–105 s).
Figure 5a shows the friction coefficient and applied load
during the initial period (0–3.8 s). After contact initiation,
the friction coefficient was initially 0.1; it then increased to
almost 0.3 at 1.5 s and subsequently decreased to \0.2.
The ratio of the austenite peak area in Fig. 5b indicates that
martensite, which is the original structure of SUJ2 steel, to
austenite phase transformation occurred after 1 s. The time
of the occurrence of the austenitisation corresponds to the
time at which the friction coefficient increased. The width
of the martensite peak in Fig. 5c decreased after the
austenitisation.
Figure 5d shows the shear stress and contact pressure
that are derived from the friction and applied forces divided
by the apparent contact area in the visible images (Fig. 6).
The steel pin was subjected to approximately 1.2 GPa of
contact pressure just before the initiation of the plastic
deformation.
Figure 5e shows temperatures obtained on the basis of
the martensite peak shift in the XRD spectra and the
thermocouple data. The temperatures increased as the test
proceeded. The variation of the temperatures detected by
the embedded thermocouples was slower than that estimated by the XRD shift, because the temperature of the
XRD shift represents temperature in the material within
7 lm depth that is shallower than the position where the
thermocouples measured the temperatures. The temperatures indicate that the austenite phase exists below 300 °C,
which is much lower than the nominal temperature of austenitisation; this phenomenon will be discussed in the next
section.
Figure 6 shows snapshots of the visible contact area of
the steel. Immediately after contact, the contact area
formed a circle (i.e. Hertzian contact) and generated wear
particles accumulated over the contact area, as evident
from Fig. 6a, b. Plastic deformation then occurred at the
position observed in the bright area in Fig. 6c, and the
plastic deformation propagated over the contact area as
(c)
WM
0.8
0.6
0.4
Temperature [ C]
Shear stress [MPa]
0
1200
(d)
120
800
80
400
40
0
300
Contact pressure [MPa]
0.2
0
(e)
XRD
200
thermocouples
100
0
0
0.5
1
1.5
2
2.5
3
3.5
Test time [s]
Fig. 5 a Friction coefficient and load, b ratio of the austenite peak
areas, c width of the martensite peak, d apparent shear stress and
pressure and e temperatures in the initial period. The temperatures
were obtained on the basis of XRD shift (closed circles) and
thermocouples embedded at distances of 1 mm (grey line), 2 mm
(dashed line), 4 mm (grey dashed line) and 20 mm (dotted line) from
the surface of the pin
shown in Fig. 6d. An expansion of the contact area indicates increased wear of the steel pin because the tip of the
pin is curved; thus, the contact area increases as wear
progresses, as noted in the previous section. The time of
initiation of the plastic flow appears to be very close to that
of the occurrence of the austenitisation.
Figure 7 shows the variations in friction coefficient and
applied load, the ratio of the austenite peak area, the width
of martensite peak and the temperatures in the later period
(48–105 s). The test times associated with the occurrence
of the friction coefficient peaks, the austenite ratio and the
temperature coincided well. The peaks appeared
123
44
Page 6 of 11
6
(a)
Tribol Lett (2015) 57:6
(b)
0.10 s
(c)
0.80 s
1.05 s
(d)
1.80 s
1mm
0.4
300
0.3
200
0.2
100
0.1
(a)
0
0
1
4 Discussion
(b)
0.8
SA/(SM+SA)
wear debris, which appears as a black region in the figure.
Plastic flow began at the black region of the agglomerated
wear debris, and then extended over the contact area and
disappeared.
Applied Load [N]
Friction coefficient
Fig. 6 Photographs of the contact area of the steel pin in the initial period. The sliding direction of the sapphire is from left to right
The characteristic friction peaks seen in this study have
been also observed in other works. This phenomenon has
been referred to as ‘‘microscuffing’’, which is local and
does not result in catastrophic failure [8]. Microscuffing
often occurs iteratively prior to macroscuffing; specifically, microscuffing is the precursor to macroscuffing.
Here, we use the terms microscuffing and macroscuffing,
which were observed before and after 90 s in this study,
respectively.
Two points are worth discussing. The first point is
related to the austenitisation temperature during microscuffing. We observed that the temperatures at which the
austenite peak appeared were 300 °C in the initial period
and 450 °C in the later period. These temperatures are
apparently lower than the nominal austenitisation temperature 750 °C of SUJ2 steel [26]. We again emphasise that
the temperature estimated on the basis of the XRD peak
shift represents temperature within a depth of 7 lm from
the steel surface; thus, the scheme provides the temperature
of the near-surface material that should be affected significantly by scuffing. The second point is the role of the
austenitisation during scuffing process.
0.6
0.4
0.2
0
0.7
(c)
WM
0.6
0.5
0.4
Temperature [ C]
0.3
(d)
600
400
200
0
50
60
70
80
90
100
Test time [s]
Fig. 7 a Friction coefficient and load, b ratio of the austenite peak
area, c width of the martensite peak and d temperatures in the later
period. The temperatures were obtained on the basis of XRD shifts
(closed circles) and temperatures measurements using thermocouples
embedded at a distance of 1 mm (grey line), 2 mm (dashed line),
4 mm (grey dashed line) and 20 mm (dotted line) from the surface of
the pin
4.1 Temperature Analysis of Austenitisation
In the case of macroscuffing that occurs after 90 s, the
austenitisation might have been driven by a thermal effect
because the detected temperature was high and close to the
nominal austenitisation temperature of 750 °C. One of the
interesting features is the fact that the temperature at which
the microscuffing occurs was much lower than the nominal
austenitisation temperature. We focused on the temperature
during microscuffing.
iteratively, and after approximately 90 s, the friction, the
austenite ratio and the temperatures increased monotonically. On the other hand, the width of the martensite
appeared to be independent of the iterative peaks, although
it did decrease after 90 s.
Figure 8 shows snapshots within the time period of one
of the iterative peaks. The contact area was covered with
123
45
Tribol Lett (2015) 57:6
(a)
60.05 s
agglomerated debris particles
Page 7 of 11 6
(b)
(c)
62.30 s
(d)
63.05 s
63.55 s
plastic flow
plastic flow
plastic flow
2mm
Fig. 8 Photographs of the contact area of the steel pin in the later period. The sliding direction of the sapphire is from left to right
4.1.1 Rate of Increasing Temperature and Contact
Pressure
1
Under scuffing conditions, the material near the surface of the
steel is subjected to an unusually severe environment. Indeed,
the contact pressure reached a maximum of approximately
1.2 GPa, and the heating rate of the contact area was
approximately 100 K/s, as evident in Fig. 5d, e, respectively.
Such unusual factors may change the austenitisation temperature. However, previous studies have shown that a higher
heating leads to a higher transformation temperature for austenitisation of steels [27, 28]. Furthermore, although the
transformation temperature decreases as pressure increases,
the amount of the decrease is expected to be only 10 % of the
transformation temperature under a pressure of 1.2 GPa [29].
Therefore, these factors cannot account for the observed
decrease in the austenitisation temperature.
dP/d0
0.9996
0.9988
0.9984
0
1200
1800
Fig. 9 Dependence of the ratio of lattice constants on pressure during
the static loading test. Dashed line indicates linear fitting line of the
data
ring without shear. Using Eqs. 6 and 7 and the static results
of the XRD analysis, we plotted the relation of P and dP =d0
as shown in Fig. 9 and obtained K ¼ 7:2 107 /MPa. The
definition of line expansion in Eq. 2 was then modified to
involve the correction of the dP effect as
When temperatures are estimated via XRD peak shifts,
they may be underestimated because of the contribution of
the contact pressure. As described in Sect. 2.2, we assumed
that the peak shift reflects an increase in the lattice distance
and that the increase originates only from the heat effect.
However, the contact pressure also possibly decreases the
lattice distance, in which case the value of 2h should be
higher. To remove the contribution of the contact pressure,
we modify the scheme described in Eq. 4. If we assume
that the SUJ2 steel pin was deformed elastically by contact
pressure P and that all deformations originated because of
the change in the lattice distance from d0 to dP , the relation
between the variables is
aðT T0 Þ ¼ d=d0 dP =d0 ;
and we thus obtained
aT 2 þ Tðb aT0 Þ ðbT0 þ sin 2h0 = sin 2h 1 þ KPÞ ¼ 0:
Figure 10 shows the temperature corrected using the above
equation. In the initial period, as shown in Fig. 10a,
although the corrected temperature is higher than the
uncorrected, the maximum temperature is still approximately 300 °C. In the later period, as shown in Fig. 10b,
the corrected and uncorrected temperatures are almost
identical because the increasing contact area reduces the
apparent contact pressure P and the effect becomes negligible. The resultant temperature that includes the P correction is still much lower than the nominal transformation
temperature of 750 °C; thus, we should seek other reasons
for the lower austenitisation temperature.
ð6Þ
where K is a proportional constant. The Bragg equation
leads to the equation
dP =d0 ¼ sin 2h0 = sin 2hP :
600
Pressure [MPa]
4.1.2 Possibility of Temperature Underestimation
dP =d0 ¼ 1 KP;
0.9992
ð7Þ
To determine K, we conducted a static XRD measurement in
which pressure was applied to the SUJ2 pin by the sapphire
123
46
6
Page 8 of 11
Tribol Lett (2015) 57:6
350
(a)
300
124 s
117 s
104 s
200
150
87 s
Intensity
Temperature [ C]
250
100
84 s
50
0
0
0.5
1
1.5
2
2.5
3
3.5
1.3 s
4
Test time [s]
0.1s
C
700
(b)
Temperature [ C]
12
600
A2
CC
12.5
13
C
13.5
2θ [deg.]
Fig. 11 Change of the carbide XRD peaks. The data were obtained
by accumulation of 11 shots of 1/30 s time resolution. The labels C
and A2 indicate carbide and austenite second peaks (fcc(200)),
respectively
500
400
300
50
60
70
80
90
temperature of the steel was \900 °C in the microscuffing
process, and that the temperature in the macroscuffing
exceeded the nominal transformation temperature of
750 °C for the austenitisation.
100
Test time [s]
4.1.4 Local Surface Temperature
Fig. 10 Pressure-corrected temperatures in the a initial and b later
period of the test. Open triangles indicate pressure-corrected
temperatures of those estimated on the basis of XRD peak shifts.
The closed-circle plots and other lines are the same data shown in
Figs. 5e and 7d
Here, we examine the possibility of a high temperature at the
local contact area. Figure 12a shows the XRD spectra collected during the initial period. The diffraction angles 2h ¼
11:65 and 11:35 represent the martensite structure of the
SUJ2 parent material and the austenite structure, respectively. On initial contact, the spectrum shows the martensite
structure of SUJ2 steel. As the test proceeded, the intensity
of the peak associated with the martensite structure
decreased and the peak associated with the austenite structure appeared. We estimated the temperature of the steel in
Figs. 5e and 7d on the basis of the shift of the main peak of
the martensite phase under the assumption that the austenite
phase shares the same temperature. However, in Fig. 12a,
we observe not only the main peak of the austenite but also a
shoulder at approximately 2h ¼ 11:2 (indicated by an
arrow in the figure), which is positioned in the lower-angle
region of the austenite spectrum. A shoulder in the lowerangle position means that a small portion of the austenite
may be at a temperature higher than that of the majority of
the austenite according to the estimation scheme of the XRD
shift. To precisely investigate the temperature distribution of
4.1.3 Temperature of Carbide Dissolution
The tempered SUJ2 steel used in this study inherently
contains a significant amount of carbide ðFe3 CÞ particles
that dissolve at 900 °C [30]. Thus, an assessment of the
carbide amount during the test can be an indirect method to
validate whether the mean temperature in microscuffing
process exceeded 900 °C. Figure 11 shows the time variation of the cementite peaks. Because the intensities of the
cementite peaks were weak, we accumulated 11 shots of
the XRD spectra with 1/30 s time resolution to highlight
the cementite peaks. During the microscuffing period, the
carbide peaks at 0.1, 1.3, 84 and 87 s did not decrease with
increasing test time despite the austenitisation. During the
macroscuffing period, in contrast, the intensities of the
carbide peaks decreased after 104 s and eventually disappeared. These observations indicate that the time-averaged
123
47
Tribol Lett (2015) 57:6
A
(a)
Intensity
Page 9 of 11 6
figures, have identical 2h positions. On the other hand, the
position of the main peak in the pattern of the austenite in
Fig. 12a is in close proximity to the austenite peak at 250 °C
in Fig. 12b. The shoulder of the austenite observed in
Fig. 12a at approximately 2h ¼ 11:2 indicates that the
temperature of the shoulder exceeds the transformation
temperature of 750 °C.
M
4.1.5 Stress and Strain Effects
(b)
1150 C
As discussed in the previous paragraph, the local contact
area may exhibit a higher temperature. Nevertheless, it
remains doubtful that such a small portion at a higher
temperature could generate most of the austenite peak at
approximately 300 °C. Another plausible answer is that
the transformation temperature is decreased by stress and
strain effects. An altered layer is often observed as white
colour via an optical microscope on an intensively
machined surface such as a scuffed steel surface [8].
Extensive studies on the formation of the white layer have
been reported in the field of plastic forming [31–37].
Many researchers have concluded that the temperature
can exceed the reverse-transformation temperature, which
is 750 °C in the case of SUJ2 steel, because the white
layer contains a retained austenite phase; the presence of
this phase is potential evidence that a steel has undergone
the austenitisation [8, 31–33]. However, temperature
analysis has not supported the occurrence of temperatures
that exceed the transformation temperature when the
white layer forms [34, 35]. Moreover, recently, some
researchers have suggested that the transformation temperature is decreased. Duan et al. [36] performed a theoretical prediction of the austenitisation temperature in
the cutting process of AISI 52100; they used a thermodynamics approach combined with the finite element
method. They have suggested that the phase transformation can occur even when the cutting temperature is lower
than the nominal phase transformation temperature. In
their cutting system, the transformation temperature
decreases from 750 to 450 °C, because the energies of
stress and strain complement heat energy to achieve the
phase transition. A transformation temperature lower than
the nominal transformation temperature has also been
claimed experimentally [37]. During steel scuffing, the
severe conditions may generate exceptional stress–strain
energy comparable to that in such a cutting system; thus,
the transformation temperature could be expected to
decrease.
750 C
250 C
11
11.2
11.4
11.6
11.8
12
2θ [deg.]
Fig. 12 Changes in the XRD spectra. a Black, red and grey lines
represent spectra collected at 0, 1.5 and 2.1 s, respectively. The arrow
indicates the shoulder region of the austenite peak. b Grey, red, dashed
and black lines represent spectra collected at 0, 5, 37 and 120 s after
completion of the sliding. The labels M and A indicate martensite
(bcc(110)) and austenite first peaks (fcc(111)), respectively. Numbers
above the austenite peaks indicate temperatures of the corresponding
austenite states estimated on the basis of XRD shifts. Vertical dotted
lines across a and b are guides for the eye (Color figure online)
the austenite, we calibrated the temperature on the basis of
XRD spectra collected during the cooling process after
completion of the sliding at 145 s as shown in Fig. 12b.
First, we measured the shift of the martensite peak by setting
the origin of the martensite spectrum completely inverted to
the initial temperature, which is represented by the black
line in Fig. 12b. The obtained shift was then used in Eq. 4 to
estimate the temperature of the austenite phase, because the
martensite and austenite phases can be reasonably assumed
to have identical temperatures during this natural cooling
process. In the case where the XRD spectrum contained only
an austenite peak but no martensite peak as, denoted by the
grey line in Fig. 12b, the temperature was estimated on the
basis of the shift of the austenite peaks themselves and the
line expansion coefficient of SUJ2 steel. Under this scheme,
the estimated temperature is 1,150 °C at the conclusion of
the sliding. This temperature is so high that the material is
completely transformed to an austenite phase. During the
cooling process, the temperature to revert to martensite is
approximately 750 °C. It should be noted that this temperature is consistent with the nominal transformation temperature of austenite in SUJ2 steel. Now that the temperature
calibration in the cooling process has been accomplished, we
can match the peak positions in Fig. 12a, b. We recognise
that the martensite peaks, indicated by the black lines in both
4.2 Role of Austenitisation in Scuffing Process
As shown in Fig. 7, after iterative microscuffing occurred
with austenitisation, macroscuffing occurred after 90 s. In
123
48
6
Page 10 of 11
Tribol Lett (2015) 57:6
general, the hardness of an austenite phase is inferior to
that of a martensite phase [26]. The reduction in hardness
may increase the wear rate of the steel surface in the
scuffing process, because the wear rate should conform
with the Holm–Archard wear equation, which predicts an
inverse relationship between the wear rate and hardness of
a sample [38].
In addition, a characteristic change in the width of the
XRD spectra is observed during the transition from microscuffing to macroscuffing. A comparison of the last
microscuffing at approximately 85 s with that just before
the last one in Fig. 7 reveals that the ratios between the
austenite peak intensities, friction values and temperatures
are very similar in the two events. Thus, these observables
are unlikely to be an index of the transition. However, the
width of the martensite only decreased to be approximately
half its initial width at the last event. The width appears to
be a threshold that indicates the transition to macroscuffing.
The decrease in the width can also be observed in the initial
period of the test as shown in Fig. 5.
According to the literature, the width of an XRD peak is
associated with the grain size of the sample and the perfection of its crystal structure [24]. In the present study, the
decrease in the width does not account for the grain size
because the width changes only when the grain size is
\100 nm; this grain size may be too small to realise in
steel. Furthermore, the grain size of the scuffed layer is
lower than that of unscuffed steel [8]. The finer grains
should reflect increasing width. The crystal perfection is
associated with strain and impurities. The decreasing width
might indicate that recrystallisation driven by the austenitisation removed the strain by annihilation of the dislocations and redistribution of carbon impurities in the
martensitic SUJ2 steel. The decrease in the strain and the
redistribution of the impurities leads to a reduction in work
hardening and to transformation from the martensite to the
ferrite phase; these effects tend to soften the steel and
weaken it against attacks of a sliding counter object.
Indeed, as Ajayi et al. [10–12] and Hershberger et al. [9]
mentioned, macroscuffing can be initiated when the rate of
softening exceeds the rate of work hardening, which is
called adiabatic shear instability. Although we did not find
a concrete reason for the decreasing width, we expect that
some of the aforementioned metallurgical changes are
driven by iterative austenitisation and may trigger the
transition from microscuffing to macroscuffing.
In order to clarify the mechanism and the role of the
austenitisation, further investigations for the relevance of
the agglomerated wear debris and the transferred steel film
to the initiation of the plastic flow and the definitive temperature by using near-infrared microscopy will be presented in our next study.
5 Conclusions
An in situ XRD observation method was developed and
demonstrated to study the scuffing process of martensitic
SUJ2 steel under a dry condition. The results led to the
following conclusions:
1.
2.
3.
A phase transformation from martensite to austenite
occurred with plastic flow during scuffing. The
austenitisation nearly vanished when the sliding
stopped.
Austenite was present at a surface temperature lower
than the nominal temperature for austenite transformation. The plausive mechanisms for the austenitisation are the high temperature on the local spots of the
surface and/or the lower-temperature austenitisation by
the high stress and strain effects.
At the transition from microscuffing to macroscuffing,
the width of the martensite peak in the XRD pattern
decreased. This result suggests that some metallurgical
changes, such as reduction in work hardening and/or
transformation from the martensite to the ferrite phase,
were driven by the intermittent occurrence of the
austenitisation in the scuffing process.
Acknowledgments We acknowledge Dr. Y. Hayashi at Toyota
Central R&D Labs., Inc., who performed the XRD data acquisition.
The synchrotron radiation experiments were performed at the
BL33XU line of SPring-8 with the approval of the Japan Synchrotron
Radiation Research Institute (JASRI) (Proposal No. 2013B7021).
References
1. Dyson, A.: Scuffing—a review. Tribol. Int. 8, 77–87 (1975)
2. Blok, H.: The flash temperature concept. Wear 6, 483–494 (1963)
3. Johnson, R.R., Dow, T.A., Zhang, Y.Y.: Thermoelastic instability
in elliptic contact between two sliding surfaces. Trans. ASME J.
Tribol. 110, 80–86 (1988)
4. Ludema, K.C.: A review of scuffing and running-in of lubricated
surface with asperities and oxides in perspective. Wear 100,
315–331 (1984)
5. Markov, D., Kelly, D.: Mechanisms of adhesion-initiated catastrophic wear: pure sliding. Wear 239, 189–210 (2000)
6. Sheiretov, T., Yoon, H., Cusano, C.: Scuffing under dry sliding
conditions—part I: experimental studies. Tribol. Trans. 41,
435–446 (1998)
7. Sheiretov, T., Yoon, H., Cusano, C.: Scuffing under dry sliding
conditions—part II: theoretical studies. Tribol. Trans. 41,
447–458 (1998)
8. Hershberger, J., Ajayi, O.O., Zhang, J., Yoon, H., Fenske, G.R.:
Formation of austenite during scuffing failure of SAE 4340 steel.
Wear 256, 159–167 (2004)
9. Hershberger, J., Ajayi, O.O., Zhang, J., Yoon, H., Fenske, G.R.:
Evidence of scuffing initiation by adiabatic shear instability.
Wear 258, 1471–1478 (2005)
10. Ajayi, O.O., Hersberger, J.G., Zhang, J., Yoon, H., Fenske, G.R.:
Microstructural evolution during scuffing of hardened 4340
123
49
Tribol Lett (2015) 57:6
11.
12.
13.
14.
15.
16.
17.
18.
19.
20.
21.
22.
23.
24.
25.
Page 11 of 11 6
26. Davis, J.R.: Metals Handbook: Desk, 2nd edn. ASM International, Ohio (1998)
27. Lee, Y.K., Shin, H.C., Leem, D.S., Choi, J.Y., Jin, W., Choi,
C.S.: Reverse transformation mechanism of martensite to austenite and amount of retained austenite after reverse transformation in Fe-3Si-13Cr-7Ni (wt-%) martensitic stainless steel.
Mater. Sci. Technol. 19, 393–398 (2003)
28. Danon, A., Servant, C., Alamo, A., Brachet, J.C.: Heterogeneous
austenite grain growth in 9Cr martensitic steels: influence of the
heating rate and the austenitization temperature. Mater. Sci. Eng.
A 348, 122–132 (2003)
29. Akimoto, S., Suzuki, T., Yagi, T., Shimomura, O.: Phase diagram
of iron determined by high-pressure/temperature X-ray diffraction using synchrotron radiation. High Press. Res. Miner. Phys: A
Volume in Honor of Syun-iti Akimoto, 149–154 (2013). doi:10.
1029/GM039p0149/summary
30. Bhadeshia, H.K.D.H.: Steels for bearings. Prog. Mater. Sci. 57,
268–435 (2012)
31. Kundrák, J., Gácsi, A., Gyáni, K., Bana, V., Tomolya, G.: X-ray
diffraction investigation of white layer development in hardturning surfaces. Int. J. Adv. Manuf. Technol. 62, 457–469 (2012)
32. Ramesh, A., Melkote, S.N., Allard, L.F., Riester, L., Watkins,
T.R.: Analysis of white layers formed in hard turning of AISI
52100 steel. Mater. Sci. Eng. A 390, 88–97 (2005)
33. Hosseini, S.B., Beno, T., Klement, U., Kaminski, J., Ryttberg, K.:
Cutting temperatures during hard turning—measurements and
effects on white layer formation in AISI 52100. J. Mater. Process.
Technol. 214, 1293–1300 (2014)
34. Duffy, J., Chi, Y.C.: On the measurement of local strain and
temperature during the formation of adiabatic shear band. Mater.
Sci. Eng. A 157, 195–210 (1992)
35. Cho, K.M., Lee, S., Nutt, S.R., Duffy, J.: Adiabatic shear band
formation during dynamic torsional deformation of an HY-100
steel. Acta. Metall. Mater. 41, 923–932 (1993)
36. Duan, C., Kong, W., Hao, Q., Zhou, F.: Modeling of white layer
thickness in high speed machining of hardened steel based on
phase transformation mechanism. Int. J. Adv. Manuf. Technol.
69, 59–70 (2013)
37. Han, S., Melkote, S.N., Haluska, M.S., Watkins, T.R.: White
layer formation due to phase transformation in orthogonal
machining of AISI 1045 annealed steel. Mater. Sci. Eng. A 488,
195–204 (2008)
38. Popov, V.L.: Contact Mechanics and Friction Physical Principles
and Application. Springer, Heidelberg (2010)
steel—implication for scuffing mechanism. Tribol. Int. 38,
277–282 (2005)
Ajayi, O.O., Martin, C.L., Erck, R.A., Fenske, G.R.: Scuffing
mechanism of near-surface material during lubricated severe
sliding contact. Wear 271, 1750–1753 (2011)
Ajayi, O.O., Martin, C.L., Erck, R.A., Fenske, G.R.: Analytical
predictive modeling of scuffing initiation in metallic materials in
sliding contact. Wear 301, 57–61 (2013)
Enthoven, J., Spikes, H.A.: Infrared and visual study of the
mechanisms of scuffing. Tribol. Trans. 39, 441–447 (1996)
Yagi, K., Ebisu, Y., Sugimura, J., Kajita, S., Ohmori, T., Suzuki,
A.: In situ observation of wear process before and during scuffing
in sliding contact. Tribol. Lett. 43, 361–368 (2011)
Li, H., Yagi, K., Sugimura, J., Kajita, S., Shinyoshi, T.: Role of
wear particles in scuffing initiation. Tribol. Online 8, 285–294
(2013)
Chandrasekaran, M., Batchelor, A.W., Loh, N.L.: Direct observation of frictional seizure of mild steel sliding on aluminum by
X-ray imaging Part I Methods. J. Mater. Sci. 35, 1589–1596
(2000)
Chandrasekaran, M., Batchelor, A.W., Loh, N.L.: Direct observation of frictional seizure of mild steel sliding on aluminum by
X-ray imaging Part II Mechanism. J. Mater. Sci. 35, 1597–1602
(2000)
Chandrasekaran, M., Batchelor, A.W., Loh, N.L.: Frictional seizure of aluminium observed by X-ray imaging. Tribol. Int. 35,
297–308 (2002)
Jacobs, T.D.B., Carpick, R.W.: Nanoscale wear as a stressassisted chemical reaction. Nat. Nanotechnol. 27, 108–112 (2013)
Michler, J., Rabe, R., Bucaille, J.L., Moser, B., Schwaller, P.,
Breguet, J.M.: Investigation of wear mechanisms through in situ
observation during microscratching inside the scanning electron
microscope. Wear 259, 18–26 (2005)
Ribeiro, R., Shan, Z., Minor, A.M., Liang, H.: In situ observation
of nano-abrasive wear. Wear 263, 1556–1559 (2007)
Ishida, T., Sato, T., Fujita, H.: In-situ observation of shear
deformation of gold single real contact point at the nanoscale.
Tribol. Online 7, 127–131 (2012)
Hase, A., Mishina, H., Wada, M.: Acoustic emission in elementary processes of friction and wear: in-situ observation of friction
surface and AE signals. J. Adv. Mech. Des. Syst. Manuf. 3,
333–344 (2009)
Cullity, B.D.: Elements of X-Ray Diffraction. Addison-Wesley,
Reading, MA (1956)
Japan Institute of Metals and Materials: Metal Data Book.
Maruzen, Tokyo (in Japanese) (1974)
123
50
2015 年豊田ビームライン研究発表一覧
原著論文
[1]
Seiji Kajita, Kazuyuki Yagi, Takashi Izumi, Jun Koyamachi, Mamoru Tohyama, Koji Saito, and
Joichi Sugimura, "In Situ X-Ray Diffraction Study of Phase Transformation of Steel in Scuffing
Process", Tribology Letters, 57, (2015) 361-368.
[2]
Noritake Isomura, Keita Kataoka, Kayo Horibuchi, Kazuhiko Dohmae, Hiroshi Oji, Yi-Tao Cui,
JinYong Son, Kousuke Kitazumi, Naoko Takahashi, and Yasuji Kimoto, "Thickness and Coverage
Determination of Multilayer with an Island-like Overlayer by Hard X-ray Photoelectron
Spectroscopy at Multiple Photon Energies", Surface and Interface Analysis, 47, (2015) 265-269.
[3]
Charies Roberts, Dario Prieto-Centurion, Yasutaka Nagai, Yusaku Nishimura, Ryan D. Desautels,
Johan van Lierop, Paul T. Fanson, and Justin M. Notestein, "In Situ Characterization of Highly
Dispersed, Ceria-Supported Fe Sites for NO Reduction by CO", The Journal of Physical Chemistry
C, 119, (2015) 4224-4234.
[4]
Yujiro Hayashi, Yoshiharu Hirose, and Yoshiki Seno, "Polycrystal Orientation Mapping using
Scanning Three-Dimensional X-ray Diffraction Microscopy", Journal of Applied Crystallography,
48, (2015) 1034-1101.
査読無しプロシーディングス、公開技術報告書、総説、口頭/ポスター発表等
[1]
Noritake Isomura, Keita Kataoka, Kayo Horibuchi, Kazuhiko Dohmae, Hiroshi Oji, Yi-Tao Cui,
JinYong Son, Kousuke Kitazumi, Naoko Takahashi, and Yasuji Kimoto, "Depth Profiling by Hard
X-ray Photoelectron Spectroscopy at Multiple Photon Energies", 日本放射光学会年会・放射光科
学合同シンポジウム [2015.01.10-01.12] Kusatsu, Japan.
[2]
Yusaki Nishimura, Tsuyoshi Hamaguchi, Satoshi Yamaguchi, Hideki Takagi, Kazuhiko Dohmae,
Takamasa Nonaka, and Yasutaka Nagai, "Three‐dimensional Atomic Distribution in a Bimetallic
Nanoparticle Evaluated by an Iterative EXAFS Analysis ", 第 12 回 SPring-8 産業利用報告会/第 6
回豊田ビームライン研究発表会 [2015.09.03-09.04] Kawasaki, Japan.
[3]
Yoshihiro Kishida, Masakazu Aoki, Yohsuke Mizutani, Takamasa Nonaka, and Kazuhiko Dohmae, "
In-situ and Time Resolved Crystal Structure Analysis for Thermal Energy Storage Materials ", 化学
工学会 第 47 回秋季大会 [2015.09.09-09.11] Sapporo, Japan.
[4]
Yujiro Hayashi, "マイクロビーム走査型 3DXRD 顕微鏡へ向 けた高エネルギーマイクロビームの形
成", 第 12 回 SPring-8 産業利用報告会/第 6 回豊田ビームライン研究発表会 [2015.09.03-09.04]
Kawasaki, Japan.
[5]
Yujiro Hayashi, Yoshiharu Hirose, and Yoshiki Seno, "Scanning Three-dimensional X-ray
Diffraction Microscopy using a High-energy Microbeam", International Conference on Synchrotron
Radiation Instrumentation (SRI) [2015.07.06-07.10] New York, USA.
51
[6]
Yujiro Hayashi, Yoshiki Seno, and Daigo Setoyama, "走査型 3 次元 X 線回折顕微鏡法の実用鋼板
への適用", 日本金属学会 秋期大会 [2015.09.16-09.18] Fukuoka, Japan.
[7]
Yujiro Hayashi, Daigo Setoyama, and Yoshiki Seno, "Scanning Three-Dimensional X-ray
Diffraction Microscopy with a High-Energy Microbeam at SPring-8", 8th International Conference
on Mechanical Stress Evaluation by Neutron & Synchrotron Radiation [2015.09.30-10.02] Grenoble,
France.
[8]
Takeshi Uyama, Hidehiko Kimura, Takashi Asada, Satoshi Yamaguchi, Yujiro Hayashi, and Taiki
Kano, "Internal Morphology Measurement of Microscopic Volume in Large Electronic Board by
Synchrotron Laminography", 第 12 回 SPring-8 産業利用報告会/第 6 回豊田ビームライン研究発
表会 [2015.09.03-09.04] Kawasaki, Japan.
[9]
Takamasa Nonaka, Kazuhiko Dohmae, Yujiro Hayashi, Araki Tohru, Satoshi Yamaguchi, Yasutaka
Nagai, Yoshiharu Hirose, Takashi Tanaka, Hideo Kitamura, Tomoya Uruga, Hiroshi Yamaguchi,
Hirokazu Yumoto, Haruhiko Ohashi, and Shunji Goto, "Toyota Beamline (BL33XU) at SPring-8",
International Conference on Synchrotron Radiation Instrumentation (SRI) [2015.07.06-07.10] New
York, USA.
[10]
Hideaki Oka, Chikaaki Okuda, Takamasa Nonaka, Takeshi Uyama, Hiroyuki Kawaura, Hiroaki
Kondo, Tsuyoshi Sasaki, and Youji Takeuchi, ”黒鉛負極加熱時の構造変化と発熱挙動”, 第 42 回
炭素材料学会年会 [2015.12.02-12.04] Suita, Japan.
[11]
Hideaki Oka, Yoshinari Makimura, Yusaku Nishimura, Takamasa Nonaka, Chikaaki Okuda,
Hiroyuki Kawaura, Takeshi Uyama, Hiroki Kondo, and Tsuyoshi Sasaki, ”放射光 X 線を用いた Li
イオン電池正負極反応の同時測定”, 第 12 回 SPring-8 産業利用報告会/第 6 回豊田ビームライン
研究発表会 [2015.09.03-09.04] Kawasaki, Japan.
[12]
Takaaki Hatanaka, Takamasa Nonaka, Hideki Takagi, and Nobuhiro Ishida, ”XAFS によるジスプロシ
ウム鉱物の局所構造解析”, 第 12 回 SPring-8 産業利用報告会/第 6 回豊田ビームライン研究発表
会 [2015.09.03-09.04] Kawasaki, Japan.
[13]
Narihito Tatsuta, Kazuhisa Yano, Akihiko Kato, Yusaku Nishimura, and Takamasa Nonaka, "球状カ
ーボン/SnO2 複合体の XAFS 解析", 第 12 回 SPring-8 産業利用報告会/第 6 回豊田ビームライン
研究発表会 [2015.09.03-09.04] Kawasaki, Japan.
[14]
Daigo Setoyama, Hidehiko Kimura, Satoshi Yamaguchi, and Yoshiharu Hirose, " A Rotating and
Revolving Spiral Slit System for Space-Resolved Stress Measurement with Synchrotron Radiation
and Area Detector", 8th International Conference on Mechanical Stress Evaluation by Neutron &
Synchrotron Radiation [2015.09.30-10.02] Grenoble, France.
[15]
Takamasa Nonaka, Yujiro Hayashi, and Kazuhiko Dohmae, "Key Technologies of Toyota
Beamline at SPring-8: Quick-scanning X-ray Absorption Spectroscopy and Scanning
Three-dimensional X-ray Diffraction Microscopy", R&D Review of Toyota CRDL, 46 号
(2015) 1-9.
[16]
Chikaaki Okuda, Takamasa Nonaka, Hiroyuki Kawaura, Takeshi Uyama, Tsuyoshi Sasaki, Yoji
Takeuchi, “放射光を用いた Li 二次電池用黒鉛負極の in situ 昇温 XRD 解析”, 第 56 回電池討論
会 [2015.11.11-11.13] Nagoya, Japan.
52
[17]
Yoshinari Makimura, Tsuyoshi Sasaki, Takamasa Nonaka, Yusaku Nishimura, Chikaaki Okuda,
Yuichi Itou, and Yoji Takeuchi, “LizNi0.8Co0.15Al0.05O2 (z > 0.8)の充放電挙動と捲回型電池の
高温耐久性”, 第 56 回電池討論会 [2015.11.11-11.13] Nagoya, Japan.
[18]
Takashi Izumi, Kazuyuki Yagi, Jun Koyamachi, Koji Saito, Satoshi Yamaguchi, Shuzo Sanda,
Yasuhiro Yogo, Hidenori Ikehata, and Joichi Sugimura, “Investigation of Effect of Compositions on
Scuffing Behavior of Steels by In-Situ Synchrotron X-ray Diffraction”, International Tribology
Congress [2015.09.16-09.20] Tokyo, Japan.
[19]
Takashi Izumi, Kazuyuki Yagi, Jun Koyamachi, Satoshi Yamaguchi, Shuzo Sanda, Koji Saito,
Hidenori Ikehata, Yasuhiro Yogo, and Joichi Sugimura, “In situ Time-Division X-ray Diffraction for
Frictional Surface of Various Steels under Scuffing”, 第 12 回 SPring-8 産業利用報告会/第 6 回豊
田ビームライン研究発表会 [2015.09.03-09.04] Kawasaki, Japan.
[20]
Takashi Izumi, Seiji Kajita, Kazuyuki Yagi, Jun Koyamachi, Koji Saito, Mamoru Tohyama, and
Joichi Sugimura, “In-situ Synchrotron X-ray Diffraction for Frictional Surface of Steel during
Scuffing Process”, 第 11 回 SPring-8 産業利用報告会 優秀発表賞授賞式 [2015.04.16] Kobe,
Japan.
[21]
Jun Koyamachi, Kazuyuki Yagi, Takashi Izumi, Satoshi Yamaguchi, Koji Saito, Shuzo Sanda, and
Joichi Sugimura, “In-situ Observation of Crystalline Orientation of Plastic Flow Layer during
Scuffing by Synchrotron X-ray Diffraction”, トライボロジー学会 春 姫路 [2015.05.27-05.30]
Himeji, Japan.
[22]
Kazuyuki Yagi, Takashi Izumi, Jun Koyamachi, Satoshi Yamaguchi, Koji Saito, Shuzo Sanda, and
Joichi Sugimura, “In‐situ Observation of Crystalline Orientation During Scuffing of Steel by
Synchrotron X‐ray Diffraction”, STLE Tribology Frontiers [2015.10.25-10.27] Colorado, USA.
[23]
Yujiro Hayashi and Yoshiharu Hirose, "豊田ビームラインにおける高エネルギーマイクロビームを用
いた走査型 3DXRD 顕微鏡装置の概要",日本放射光学会年会・放射光科学合同シンポジウム
[2015.01.10-01.12] Kusatsu, Japan.
[24]
Yoshihiro Kishida, Masakazu Aoki, Yohsuke Mizutani, Takamasa Nonaka, and Kazuhiko Dohmae,
“In-situ and Time Resolved Crystal Structure Analysis for Thermal Energy Storage Materials”, 第
12 回 SPring-8 産業利用報告会/第 6 回豊田ビームライン研究発表会 [2015.09.03-09.04]
Kawasaki, Japan.
[25]
Kazuhiko Dohmae, “BL33XU(豊田ビームライン)2014 年度報告”, SPring-8 利用推進協議会 研
究開発委員会 [2015.04.16] Kobe, Japan.
[26]
Kazuhiko Dohmae, “ 豊 田 ビ ー ム ラ イ ン BL33XU の 現 状 ”, SPring-8 シ ン ポ ジ ウ ム 2015
[2015.09.13-09.14] Fukuoka, Japan.
[27]
Kazuhiko Dohmae, “排ガス浄化触媒のオペランド XAFS 解析”, 東北大学金属材料研究所共同利
用ワークショップ [2015.12.14-12.15] Sendai, Japan.
[28]
Takuro Matsunaga, Yoshihide Katagiri, Takuya Morishita, Yoshimi Muraoka, Masashi Harada, and
Kenzo Fukumori, "In-situ Observation for Crystallization Behavior of Isotactic Polypropylene
during Injection Molding Process by SAXS/WAXS: Effect of Process Conditions", 高分子学会 年
次大会 [2015.05.27-05.29] Sapporo, Japan.
53
[29]
Takuro Matsunaga, Yoshihide Katagiri, Takuya Morishita, Yoshimi Muraoka, Masashi Harada, and
Kenzo Fukumori, "In-situ Observation for Crystallization Behavior of Thermoplastic Polymer
during Injection Molding Process by SAXS/WAXS", 第 12 回 SPring-8 産業利用報告会/第 6 回豊
田ビームライン研究発表会 [2015.09.03-09.04] Kawasaki, Japan.
[30]
Takuro Matsunaga, Yoshihide Katagiri, Takuya Morishita, Yoshimi Muraoka, Masashi Harada, and
Kenzo Fukumori, "In-situ Observation for Crystallization Behavior of Isotactic Polypropylene
during Injection Molding Process by SAXS/WAXS", 第 27 回 高分子加工技術討論会
[2015.10.26-10.27] Nagoya, Japan.
[31]
Takuro Matsunaga, Yoshihide Katagiri, Takuya Morishita, Yoshimi Muraoka, Masashi Harada, and
Kenzo Fukumori, "In-situ Observation for Crystallization Behavior of Isotactic Polypropylene
during Injection Molding Process", 第 24 回 ポリマー材料フォーラム [2015.11.26-11.27] Tokyo
Japan.
[32]
Masashi Harada, Takuro Matsunaga, Yoshihide Katagiri, Takuya Morishita, and Kenzo Fukumori,
"Installation for In-Situ X-Ray Scattering Measurements during Polymer Injection Molding at
Toyota Beamline", 16th International Conference on Small-Angle Scattering (SAS 2015)
[2015.09.13-09.18] Berlin, Germany.
[33]
Masashi Harada, "Application of X-rays, Neutrons, Muons and Isotopes for Polymer Science", 高分
子学会 ポリマーフロンティア 21 [2015.04.23] Tokyo Japan.
[34]
Hiroaki Wakayama, Hirota Yonekura, and Masashi Harada, "Magnetic Alignment of Block
Copolymers Doped with Metal Complexe", 日本化学会 春季年会 [2015.03.26-03.29] Funabashi
Japan.
[35]
Yuri Yamada, Atsushi Miura, Masashi Harada, and Hiroaki Wakayama, "Vertically Aligned Silica
Nano-Pillars Fabricated by Block Copolymer Lithography", 2015 MRS Fall Meeting & Exhibit
[2015.11.29-12.04] Boston, USA.
[36]
Yohei Shimizu, Masashi Harada, Kenzo Fukumori, Takuya Mitsuoka, Mototake Furuhashi, Isao
Usuki, and Kazuo Hamada, " Effect of Particle Size of Carbon Black in Rubbers on Vibration
Property", 自動車技術会 2015 年 春季大会学術講演会 [2015.05.20-05.22] Yokohama, Japan.
[37]
Shinohara Yasuhiro, Masashi Harada, Takuro Matsunaga, ,and Naoki Hasegawa, " Structure of
Non-Crosslinked Polymer Electrolyte Synthesized from Nafion", 高分子討論会
[2015.09.15-09.17] Sendai, Japan.
[38]
Atsushi Kamiya, Takuro Matsunaga, Masashi Harada, Naoki Kitano, and Naoki Hasegawa,
"Structure Evolution of Catalyst Layer for PEMFC", 高分子討論会 [2015.09.15-09.17] Sendai,
Japan.
[39]
Tomoyuki Kayama, Chikaaki Okuda, Yusaku Nishimura, Satoru Fujita, Tatsuya Hatanaka, and
Keisuke Kobayashi, "In-situ XAFS Analysis of Solid Oxide Fuel Cell Anode", 第 12 回 SPring-8 産
業利用報告会/第 6 回豊田ビームライン研究発表会 [2015.09.03-09.04] Kawasaki, Japan.
[40]
Satoru Fujita, Hiroshi Nozaki, Shuji Matuo, Satoshi Yamaguchi, and Yujiro Hayashi, " The Study of
Crystal Structure of SOFC Cathode", 第 12 回 SPring-8 産業利用報告会/第 6 回豊田ビームライン
研究発表会 [2015.09.03-09.04] Kawasaki, Japan.
54
[41]
Takashi Asada, Hidehiko Kimura, Satoshi Yamaguchi, Yujiro Hayashi, Takeshi Uyama, Masato
Hoshino, and Kentaro Uesugi, "Internal Strain Analysis for a Resin Molded Power Module Using
Volumetric Digital Image Correlation Method", 日本機械学会 2015 年度年次大会
[2015.09.14-09.16] Sapporo, Japan.
[42]
Takashi Asada, Hidehiko Kimura, Satoshi Yamaguchi, Yujiro Hayashi, and Takeshi Uyama,
"3-Dimensinal Internal Strain Analysis of Power Modules by Synchrotron Laminography and Digital
Image Correlation Method", プラスチック成形加工学会新加工技術専門委員会 [2015.12.10]
Tokyo, Japan.
[43]
Takashi Asada, Hidehiko Kimura, Satoshi Yamaguchi, Yujiro Hayashi, and Takeshi Uyama,
"Measurement of 3-Dimensional Internal Strain Field in Power Module Package by Synchrotron
Laminography and Volumetric Digital Image Correlation Method", International Conference on
Advanced Technology in Experimental Mechanics 2015, [2015.10.05-10.08] Toyohashi, Japan.
[44]
Hidehiko Kimura, Daigo Setoyama, Satoshi Yamaguchi, Yoshiharu Hirose, Yuka Kojima, and
Minoru Takahara, "Depth-resolved Strain Distribution Measurement by Synchrotron X-ray
2-dimensional Diffraction", International Conference on Advanced Technology in Experimental
Mechanics 2015, [2015.10.05-10.08] Toyohashi, Japan.
55
© Copyright 2026 Paperzz