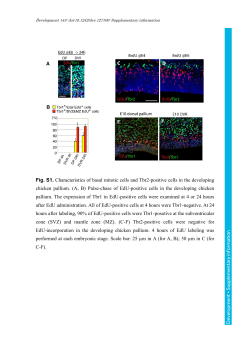
Development 143: doi:10.1242/dev.125351: Supplementary information SUPPLEMENTARY MATERIALS AND METHODS ERG recording and analysis A typical ERG trace is composed of the a-wave, which is a negative component originating from the photoreceptors, and the b-wave, which is a positive component generated by the bipolar and Müller cells complex stimulation. Two major parameters can be derived from these waves, namely the amplitude (µV) and the implicit time (ms). By convention, the amplitude of the a-wave is measured from the baseline to trough, and the b-wave amplitude is measured from the trough of the a-wave to the peak of the b-wave. The implicit time of the waves represents the number of milliseconds at which the maximal amplitude is reached. For each of the four parameters, a photopic and scotopic luminance response function (LRF) was generated, where the values of the parameters were plotted against flash luminance. Repeated measures analyses of variance with Bonferroni correction were performed to assess the difference between the three genotypes for each one of the parameters. All analyses were conducted using SPSS for Windows, version 22.0. Immunohistochemistry and immunofluorescence For immunofluorescence labeling, sections were incubated overnight with primary antibody solutions at 4ºC in a humidified chamber. After three washes in PBS, sections were incubated with secondary antibodies for 1 h at room temperature. Slides were mounted on coverslips in DAPIcontaining mounting medium (Vector Laboratories, CA). For immunohistochemistry labeling, slices were analyzed by using the Vectastain® ABC kit (Vector) according to the manufacturer instructions. Peroxidase substrates used are the Vector® VIP (Pink) (Vector), and DAB (brown) Microsystems) and images were captured with a digital camera (Retiga EX; QIMAGING; with OpenLab, ver.3.1.1 software; Open-Lab, Canada). Confocal microscopy analyses were performed using 60x objectives with an IX81 confocal microscope (Olympus, Richmond Hill, Canada), and images were obtained with Fluoview software version 3.1 (Olympus). 3D reconstructions were obtained with Fluoview software version 3.1 from 18-25 z-stack image. Primary antibodies used in this study are: sheep anti-Chx10 (1:250, Exalpha Biologicals), rabbit anti-Pax6 (1:500, Chemicon), mouse anti-Bmi1 (1:200, US Biological), rabbit anti-Bmi1 (1:150, US Biological), mouse antiSyntaxin (1:200, Sigma), mouse anti-4D2 (Rhodopsin) (1:100, R. Molday, UBC), mouse antiGad65 (1:300, BD Pharmingen), rabbit anti-CORD2 (CRX) (1:300, Abcam), rabbit anti-S-Opsin (1:200, Invitrogen), rabbit anti-M-Opsin (1:100, Chemicon), Rip3 (1:250, Santa Cruz), rabbit antiH3K9me3 (1:500, Abcam), rabbit anti-H3K9ac (1:300, Cell Signaling), rabbit anti-H3K27me3 (1:300, Cell Signaling), mouse anti-glutamine synthetase (GS) (1:100, Chemicon), rabbit anti-Pkcα Development • Supplementary information (Sigma). Observations were made under a fluorescence microscope (Leica DMRE, Leica Development 143: doi:10.1242/dev.125351: Supplementary information (1:500, Sigma), rabbit anti-Calbidin (1:500, Chemicon), rabbit anti-Recoverin (1:1000, Millipore), mouse anti-γH2Ax (1:250, Millipore), rabbit anti-Cralbp (1:500, kindly given by Dr Saari’s lab). Secondary antibodies are: donkey AlexaFluor488-conjugated anti-mouse (1:1000, Life Technologies), donkey AlexaFluor488-conjugated anti-rabbit (1:1000, Life Technologies), goat AlexaFluor594-conjugated anti-mouse IgM (1:1000, Invitrogen), donkey AlexaFluor633- conjugated anti-sheep (1:1000, Molecular Probes), goat AlexaFluor647-conjugated anti-mouse (1:1000, Life Technologies) goat AlexaFluor texas red-conjugated anti-rabbit (1:1000, Life Technologies), donkey FITC-conjugated anti-mouse (1:300, Chemicon), goat FITC-conjugated anti-rat (1:300, Caltag Laboratories), donkey Rhodamine-conjugated anti-rabbit (1:300, Chemicon). Fluorescein labeled Peanut Agglutinin (PNA) (1:200, Vector laboratories) was used to stain the outer segment of PRs. Superoxide production was measured by red fluorescence intensity as described by standard protocol indicated by manufacturer (MitoSoxRed mitochondrial superoxide indicator, Molecular Probes, U.S.). Quantitative RT-PCR Mouse primer sets used are: Tnf (F) 5' AAAATTCGAGTGACAAGCCTGTAG 3'; Tnf (R) 5' CCCTTGAAGAGAACCTGGGAGTAG 3'; Tnfrsf1a (F) 5' GCCGGATATGGGCATGAAGC 3'; Tnfrsf1a (R) 5' TGTCTCAGCCCTCACTTGAC 3'; Ripk1 (F) 5' TGTCATCTAGCGGGAGGTTG 3'; Ripk1 (R) 5' TCACCACTCGACTGTGTCTCAG 3'; Ripk3 (F) 5' CTCCGTGCCTTGACCTACTG 3'; Ripk3 (R) 5' AACCATAGCCTTCACCTCCC3'; Bmi1 (F) 5’GGAGACCAGCAAGTATTGTCCTATTTG-3’, Bmi1 (R) 5'- (R) p19Arf 5'-GCAGAAGAGCTGCTACGTGAAC-3'; p19Arf GGCTAGAGAGGATCTTGAGAAGAGG-3', (F) 5'- (R) 5'- GCCCATCATCATCACCTGGTCCAGG-3'; Sox2 (F) 5’-TAAGGGTTCTTGCTGGGTTTT-3’, Sox2 (R) 5’-AGACCACGAAAACGGTCTTG-3’; Lhx2 (F) 5’-GATCTCGCCTGGAAACAGAG 3’, Lhx2 (R) 5’-TCGCTCAGTCCACAAAACTG -3’; Otx2 (F) 5'- AGAGGAGGTGGCACTGAAAA-3', Otx2 (R) 5'-TGACCTCCATTCTGCTGTTG-3'; Lpo (F) 5'AGGTCTGTTGGCCAAGAATG-3', Lpo (R) 5'-ATGTTGATGGAAGCCAGGTC-3'; Apaf1 (F) 5'-TGCTCAGCGGATAAGAAGGT-3', Apaf1 (R) 5'TCCCAGAGCTTGAGGAAGAA-3'; Fas (F) 5'-AAACAAACTGCACCCTGACC-3', Fas (R) 5'CAACCATAGGCGATTTCTGG-3'; Nqo1 (F) 5'-TTCTCTGGCCGATTCAGAGT-3', Nqo1 (R) 5'GAGTGTGGCCAATGCTGTAA-3'; Gsta1 (F) 5'-CGCCACCAAATATGACCTCT-3', Gsta1 (R) 5'CCATGGCTCTTCAACACCTT-3'; Development • Supplementary information CTTACGATGCCCAGCAGCAATG-3'; p16Ink4a (F) 5'-CAACGCCCCGAACTCTTTC-3', p16Ink4a Development 143: doi:10.1242/dev.125351: Supplementary information Cyp24a1 (F) 5'-GGCGGAAGATGTGAGGAATA-3', 5'GTTGTGAATGGCACACTTGG-3'; Duox2 (F) Cyp24a1 (R) 5'-ACAAGGGGTGTATGCCTTTG-3', Duox2 (R) 5'-CACAGGTTGTGGTAGCGAAA-3'. Crx (F) 5'-CCTTCTGACAGCTCGGTGTT-3', Crx (R) 5'-CCACTTTCTGAAGCCTGGAG)-3'; Sesn2 (F) 5’-CCTCCTTTGTGTTGTGCTGT-3’, Sesn2 (R) 5’-ACGGTTCTCCATTTCCTCCT-3’; Opn1sw (F) 5’- CAGCCTTCATGGGATTTGTCT-3’, Opn1sw (R) 5’-CAAAGAGGAAGTATCCGTGAC-3’; Rax (F) 5′-TGGGCTTTACCAAGGAAGACG-3’, Rax (R) 5′-GGTAGCAGGGCCTAGTAGCTT-3’; Six6 (F) 5′-GCAAGTAGCCGGGGTATGTG-3’, Six6 (R) 5′- CGACTCATTCTTGTTAAGGGCTT-3’; Nrl (F) 5′-CCCAGTCCCTTGGCTATGGA-3’, Nrl (R) 5′-ACCGAGCTGTATGGTGTGGA-3’; Notch1 (F) 5′-GATGGCCTCAATGGGTACAAG-3’, Notch1 (R) 5′-TCGTTGTTGTTGATGTCACAGT-3’; Pax6 (F) 5′- TGGCAAACAACCTGCCTATG-3’, Pax6 (R) 5′-TGCACGAGTATGAGGAGGTCT-3’; Gapdh (F) 5′-AGGTCGGTGTGAACGGATTTG-3′, Gapdh (R) 5′-TGTAGACCATGTAGTTGAGGTCA3’; Human primer sets used are: PAX6 (F) 5'-AGATTTCAGAGCCCCATATTCG-3', PAX6 (R) 5'- CCATTTGGCCCTTCGATTAG-3'; ARR3 (F) 5'-CCCAGAGCTTTGCAGTAACC-3', ARR3 (R) 5'-CACAGGACACCATCAGGTTG-3'; SOX1 (F) 5'-AAAGTCAAAACGAGGCGAGA-3', SOX1 (R) 5'-AAGTGCTTGGACCTGCCTTA-3'; RAX (F) 5'-GGCAAGGTCAACCTACCAGA-3', RAX (R) 5'-GCTTCATGGAGGACACTTCC-3'; SIX6 (F) 5′- ACAGACTCCAGCAGCAGGTT-3′, (R) 5′-AGATGTCGCACTCACTGTCG-3′; TGTGCCTCTCTCCCTCATCT-3′, (R) CCCCTGCAAACTTCGTCCT-3′; (R) CDKN1A (F) (F) 5′- 5′-GGCACGTAGCAGACACAGAA-3′; (F) 5′-GATCCAGGTGGGTAGAAGGTC-3′, p16INK4A CDKN1A OPN1SW OPN1SW p16INK4A (R) 5′- 5′-CCGAAGTCAGTTCCTTGTGG-3′, 5′-GTCGAAGTTCCATCGCTCAC3′; SOX2 (F) 5′- CACAACTCGGAGATCAGCAA-3′, SOX2 (R) 5′-CGGGGCCGGTATTTATAATC-3′; LHX2 (F) 5′-CCAAGGACTTGAAGCAGCTC-3′, LHX2 (R) 5′-TAAGAGGTTGCGCCTGAACT-3′; BMI1 (F) 5-AATCCCCACCTGATGTGTGT-3, BMI1 (R) 5-GCTGGTCTCCAGGTA ACGAA-3; GAPDH (F) 5-TCACCAGGGCTGCTTTTAAC-3′, GAPDH (R) 5′- ATCCACAGTCTTCTGGGTGG -3′. Western blot Total protein extracts were prepared in the Complete Mini protease inhibitor cocktail solution (Roche Diagnostics). Proteins contents were quantified using the Bradford reagent. Proteins were Development • Supplementary information SIX6 Development 143: doi:10.1242/dev.125351: Supplementary information resolved in Laemmli buffer by SDS-PAGE and transferred to a 0.2μm Nitrocellulose Blotting Membrane (BioRad) that was exposed to the primary antibodies: mouse anti-Bmi1 (1:800, Millipore), mouse anti-H2Aub (1:1000, Millipore), mouse anti- βActin (1:1000, abcam), p63, mouse anti-p73 (1:500, abcam), mouse anti-p53 (1:500, Santa Cruz Biotecnology), goat anti-CRX (1:500, Santa Cruz Biotecnology), mouse anti--Tubulin (1:1000, Sigma), anti-Rip3 (1:1000, Santa Cruz Biotecnology), anti-Bmi1 (1:500, abgent), S-Opsin (1:400, Santa Cruz Biotechnology) and histone H3 (1:1000, upstate). Membranes were treated with corresponding horseradish peroxidaseconjugated secondary antibodies (Sigma) and developed using the Immobilon Western (Millipore). Cell cultures Cultures of retinal cells were obtained by dissecting the mice eyes at P5 in 1X oxygenated HBSS (Life Technologies) in order to extract only the neural retina. Retinal cells were then re-suspended and incubated 10 minutes at 37 °C in the enzyme solution composed of 10ml 1X HBSS, 9.3 mg of Papain (Worthington), 1.6 mg of N-acetyl L-cysteine (Sigma), 0.5 mg of DNaseI (Roche) and 10μl EDTA 500mM (Fisher Scientific). After centrifugation cells were dissociated into Neurobasal tm medium (Life technologies) with 0.02 g/l NGF (Invitrogen), 0.02 g/l BDNF (Invitrogen), 1% B27 (Invitrogen), 70 g/ml gentamycin (Invitrogen), 1% fetal bovine serum (Wisent), 0.5% glucose (Sigma) and 10 M Forskolin (Sigma). The cells were then spread and cultivated on coverslips Development • Supplementary information treated with Poly-L-Lysine hydrobromide (Sigma) and BD Matrigel Matrix (BD Biosciences). Development 143: doi:10.1242/dev.125351: Supplementary information Figure S1. Bmi1 is required for cone photoreceptor maintenance after birth and Bmi1-/- mice at P30. Dorso-nasal (DN), dorso-temporal (DT), ventro-nasal (VN), ventrotemporal (VT). Scale bars: 1 mm. Development • Supplementary information (A) Representative images from S-Opsin/PNA double-stained retinal flat mounts from WT, Bmi1+/- Figure S2. Histological anomalies in Bmi1-/- mouse retinas (A, B, C, D) IHC and IF analyses of WT and Bmi1-/- retinas at P30 using specific markers for different retinal cell types. (A’, A’’) crop of the area indicated by the respective dashed rectangles. Amacrine cells’ membrane (Syntaxin), müller glial cells (Gs and Cralbp), rods bipolar cells (Pkcα), amacrine (white-edged arrows) and ganglion cells (black arrows) (Pax6), horizontal cells (Calbindin), c-cones (S-Opsin), rod photoreceptors (4D2), T2 OFF and T8 ON cone bipolar cells (Recoverin), amacrine cells (white arrows) and horizontal cells (white-edged arrows) (Gad65). Retinal pigmented epithelium (RPE); outer nuclear layer (ONL); inner nuclear layer (INL); and ganglion cell layer (GCL). Scale bars: 40μm. Development • Supplementary information Development 143: doi:10.1242/dev.125351: Supplementary information Figure S3. Bmi1 is preferentially expressed in mouse cone photoreceptors (A) IF analysis of WT and Nrl-/- mouse retinal cryosections at P30. Arrows: Note the preferential expression of Bmi1 in neurons of the INL and in cone photoreceptors located in the ONL (white arrows). In contrast, Bmi1 is evenly distributed in the cone-only ONL of Nrl-/- mice. (B) IF analysis Development • Supplementary information Development 143: doi:10.1242/dev.125351: Supplementary information Development 143: doi:10.1242/dev.125351: Supplementary information of dissociated retinal cultures from WT and Bmi1-/- mice at P1 after 4 days in vitro (DIV). Note the expression of Bmi1 in WT cones labeled with S-Opsin, and the absence of Bmi1 in S-Opsin positive cells of Bmi1-mutants. (C) Quantification of S-Opsin positive cones in dissociated WT and Bmi1-/- retinal cultures, expressed as percentage of the initial cone number evaluated at 1 DIV. Outer nuclear layer (ONL); inner nuclear layer (INL); outer segment (OS). Scale bar: 50μm (A) and 20μm (B). WT n=4; Bmi1-/- n= 5. All values are mean ±SEM. (*) P 0.05; (**) 0.01; Student t- Development • Supplementary information test. Development 143: doi:10.1242/dev.125351: Supplementary information Figure S4. Methodology for the quantification of photoreceptors and other retinal cells types (A) Representative mosaic reconstruction from 10x images from S-Opsin/PNA double-stained retinal flat mounts from P30 WT mice. (A’, A’’) 60x confocal microscopy images from retinal flat mount of the DT (A’) and from the VN (A’’) portion indicate with dashed rectangles in (A). (A’) Note the almost complete absence of S-cone (S-Opsin+ cells) in the DT portion where almost only Opsin. The majority of these are dual-photoreceptors expressing both S and M Opsin and a minority of pure S-cone (data not shown). For PRs quantification, 3 images from the VN portion were quantified and averaged as shown by the dashed rectangles in (A). (B) 20x Mosaic Image of the whole retinal section at the level of the optic nerve of an orientated block. The eyes are oriented in the blocks in order to always have VN and DT in opposite positions with respect to the optic nerve on sections. For quantification on retinal sections, 3 consecutive images for sample (as shown by the boxes 1, 2, 3) were taken in the VN side, then quantified and averaged. (B’) Representative 60x confocal microscopy image from retinal section used for quantification. Ventro-nasal (VN), dorsotemporal (TD). n= 3 to 6 retinas were used for genotype. Scale bars: (A) 1 mm, (B) 0,5mm. Development • Supplementary information M-pure cones are present. (A'') Note that in the VN portion approximately all cones express S- Development 143: doi:10.1242/dev.125351: Supplementary information Figure S5. Bmi1 is highly expressed in bipolar neurons IF analysis of a WT mouse retina (cryosections) using Chx10 and Bmi1 antibodies. Note Bmi1 expression in Chx10-positive cells of the INL. Retinal pigment epithelium (RPE); outer nuclear Development • Supplementary information layer (ONL); inner nuclear layer (INL); ganglion cell layer (GCL). Scale bar: 20μm. Development 143: doi:10.1242/dev.125351: Supplementary information Figure S6. Chk2 deletion partially improves the Bmi1-/- phenotype Bmi1-/- /Chk2-/- and Chk2+/- mice at P30. Note: Bmi1-/- /Chk2-/- mice were healthier than Bmi1-/- Development • Supplementary information mice but remained smaller than Chk2+/- control mice. Development 143: doi:10.1242/dev.125351: Supplementary information Table S1. Statistical analysis of ERG parameters Global values from ERG experiment. Each parameter is analyzed by repeated measures ANOVA. The comparisons between the ERG parameters values at the Vmax are analyzed by one-way ANOVA. All values are mean ± SEM. N.S. = not significant; (*) P 0.05; (**) 0.01; (***) 0.001; Photopic system Overall a-wave implicit time a-wave implicit time at Vmax Comparison with the other groups (p-value) Overall b-wave amplitude b-wave amplitude at Vmax Comparison with the other groups (p-value) Overall b-wave implicit time b-wave implicit time at Vmax Comparison with the other groups (p-value) Scotopic system -/- WT F(2,7) = 6.195, p = 0.028 * Overall a-wave amplitude a-wave amplitude at Vmax Comparison with the other groups (p-value) +/- -215.4 ± 32.69 μV +/- = 0.375 N.S. -/- = 0.008 ** -182.5 ± 15.29 μV WT = 0.375 N.S. -/- = 0.039 * F(2,7) = 5.127, p = 0.043 * 8.000 ± 0.4082 ms 8.667 ± 0.3333 ms +/- = 0.246 N.S. WT = 0.246 N.S. -/- = 0.039 * -/- = 0.275 N.S. F(2,7) = 18.970, p = 0.001 *** 241.9 ± 17.32 μV WT = 0.044 * -/- = 0.029 * F(2,7) = 20.852, p = 0.001 *** 27.25 ± 0.6292 ms 31.00 ± 1.000 ms +/- = 0.136 N.S. WT = 0.136 N.S. -/- = 0.001 *** -/- = 0.010 ** 333.8 ± 34.78 μV +/- = 0.044 * -/- = 0.001 *** -88.35 ± 6.706 μV WT = 0.008 ** +/- = 0.039 * -116.1 ± 12.17 μV +/- = 0.939 N.S. -/- = 0.226 N.S. 9.333 ± 0.3333 ms WT = 0.039 * +/- = 0.275 N.S. 21.75 ± 2.175 ms +/- = 0.484 N.S. -/- = 0.932 N.S. 132.3 ± 9.479 μV WT = 0.001 *** +/- = 0.029 * 509.5 ± 24.04 μV +/- = 0.112 N.S. -/- = 0.032 * 39.33 ± 2.848 ms WT = 0.001 *** +/- = 0.010 ** 57.00 ± 1.472 ms +/- = 0.899 N.S. -/- = 0.158 N.S. +/F(2,7) = 1.297, p = 0.332 N.S. -117.4 ± 12.22 μV WT = 0.939 N.S. -/- = 0.281 N.S. F(2,7) = 0.596, p = 0.577 N.S. 19.67 ± 0.3333 ms WT = 0.484 N.S. -/- = 0.464 N.S. F(2,7) = 10.440, p = 0.008 ** 603.7 ± 51.01 μV WT = 0.112 N.S. -/- = 0.004 ** F(2,7) = 0.034, p = 0.966 N.S. 56.67 ± 1.453 ms WT = 0.899 N.S. -/- = 0.217 N.S. -/-138.0 ± 10.05 μV WT = 0.226 N.S. +/- = 0.281 N.S. 22.00 ± 2.517 ms WT = 0.932 N.S. +/- = 0.464 N.S. 371.4 ± 40.33 μV WT = 0.032 * +/- = 0.004 ** 53.00 ± 2.517 ms WT = 0.158 N.S. +/- = 0.217 N.S. Development • Supplementary information WT
© Copyright 2026 Paperzz