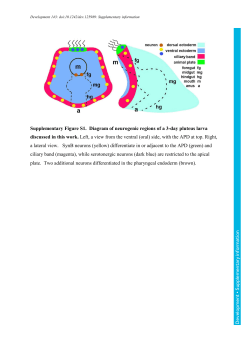
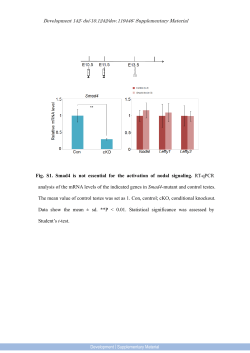
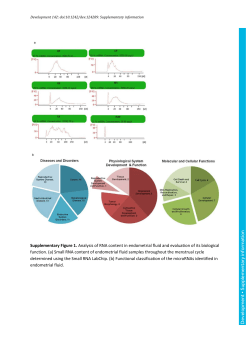
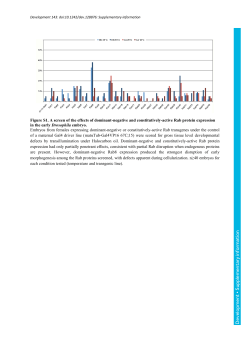
Development 143: doi:10.1242/dev.127100: Supplementary information
Fig. S1. Characteristics of basal mitotic cells and Tbr2-positive cells in the developing
chicken pallium. (A, B) Pulse-chase of EdU-positive cells in the developing chicken
pallium. The expression of Tbr1 in EdU-positive cells were examined at 4 or 24 hours
after EdU administration. All of EdU-positive cells at 4 hours were Tbr1-negative. At 24
hours after labeling, 90% of EdU-positive cells were Tbr1-posotive at the subventricular
EdU-incorporation in the developing chicken pallium. 4 hours of EdU labeling was
performed at each embryonic stage. Scale bar: 25 µm in A (for A, B); 50 µm in C (for
C-F).
Development • Supplementary information
zone (SVZ) and mantle zone (MZ). (C-F) Tbr2-positive cells were negative for
Development 143: doi:10.1242/dev.127100: Supplementary information
Fig. S2. Time-lapse analysis of mitotic cells in the slice culture of the developing
chicken pallium. Neural progenitors were visualized by electroporation of a
GFP-expression vector. (A) A mitotic cell at a subapical position. (B) A mitotic cell on
Development • Supplementary information
the basal side of the ventricular zone. Scale bar: 10 µm.
Fig. S3. (A) Basal mitotic cells induced by LGN-C overexpression retained basal radial
fiber. The cell was visualized by mosaic labeling with pCAG-Cre and pCALNL-GFP
together with LGN-C expression vector. (B-F) Overexpression of 4D vectors increased
the proportion of S-phase cells in the developing chicken pallium. The proportion of
EdU-positive cells in 4D-expressing cells (RFP-positive) was higher than that in
non-transfected cells (RFP-negative, internal control). (G, H) The number of basal
mitotic cells in the 4D-overexpressed pallium was not different than that in the control
pallium. Scale bar: 5 µm in A; 10 µm in B (for B-E), G.
Development • Supplementary information
Development 143: doi:10.1242/dev.127100: Supplementary information
© Copyright 2026 Paperzz